

Neoadjuvant Chemotherapy and Immunotherapy in Luminal B-like Breast Cancer: Results of the Phase II GIADA Trial
- PMID: 34667023
- PMCID: PMC9401542
- DOI: 10.1158/1078-0432.CCR-21-2260
Neoadjuvant Chemotherapy and Immunotherapy in Luminal B-like Breast Cancer: Results of the Phase II GIADA Trial
Abstract
Purpose: The role of immunotherapy in hormone receptor (HR)-positive, HER2-negative breast cancer is underexplored.
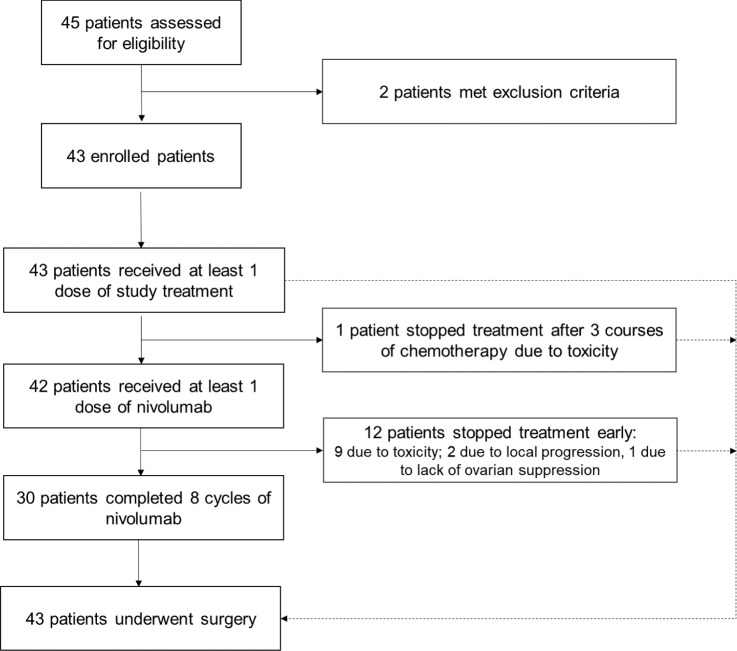
Patients and methods: The neoadjuvant phase II GIADA trial (NCT04659551, EUDRACT 2016-004665-10) enrolled stage II-IIIA premenopausal patients with Luminal B (LumB)-like breast cancer (HR-positive/HER2-negative, Ki67 ≥ 20%, and/or histologic grade 3). Patients received: three 21-day cycles of epirubicin/cyclophosphamide followed by eight 14-day cycles of nivolumab, triptorelin started concomitantly to chemotherapy, and exemestane started concomitantly to nivolumab. Primary endpoint was pathologic complete response (pCR; ypT0/is, ypN0).
Results: A pCR was achieved by 7/43 patients [16.3%; 95% confidence interval (CI), 7.4-34.9]; the rate of residual cancer burden class 0-I was 25.6%. pCR rate was significantly higher for patients with PAM50 Basal breast cancer (4/8, 50%) as compared with other subtypes (LumA 9.1%; LumB 8.3%; P = 0.017). Tumor-infiltrating lymphocytes (TIL), immune-related gene-expression signatures, and specific immune cell subpopulations by multiplex immunofluorescence were significantly associated with pCR. A combined score of Basal subtype and TILs had an AUC of 0.95 (95% CI, 0.89-1.00) for pCR prediction. According to multiplex immunofluorescence, a switch to a more immune-activated tumor microenvironment occurred following exposure to anthracyclines. Most common grade ≥3 treatment-related adverse events (AE) during nivolumab were γ-glutamyltransferase (16.7%), alanine aminotransferase (16.7%), and aspartate aminotransferase (9.5%) increase. Most common immune-related AEs were endocrinopathies (all grades 1-2; including adrenal insufficiency, n = 1).
Conclusions: Luminal B-like breast cancers with a Basal molecular subtype and/or a state of immune activation may respond to sequential anthracyclines and anti-PD-1. Our data generate hypotheses that, if validated, could guide immunotherapy development in this context.
©2021 The Authors; Published by the American Association for Cancer Research.
Figures


Comment on
-
Selected Articles from This Issue.Clin Cancer Res. 2022 Jan 15;28(2):247. doi: 10.1158/1078-0432.CCR-28-2-HI. Clin Cancer Res. 2022. PMID: 35045957 No abstract available.
Similar articles
-
Tumour-infiltrating lymphocytes and prognosis in different subtypes of breast cancer: a pooled analysis of 3771 patients treated with neoadjuvant therapy.Lancet Oncol. 2018 Jan;19(1):40-50. doi: 10.1016/S1470-2045(17)30904-X. Epub 2017 Dec 7. Lancet Oncol. 2018. PMID: 29233559
-
Integrated evaluation of PAM50 subtypes and immune modulation of pCR in HER2-positive breast cancer patients treated with chemotherapy and HER2-targeted agents in the CherLOB trial.Ann Oncol. 2016 Oct;27(10):1867-73. doi: 10.1093/annonc/mdw262. Epub 2016 Aug 2. Ann Oncol. 2016. PMID: 27484801 Clinical Trial.
-
Neoadjuvant chemotherapy with or without anthracyclines in the presence of dual HER2 blockade for HER2-positive breast cancer (TRAIN-2): a multicentre, open-label, randomised, phase 3 trial.Lancet Oncol. 2018 Dec;19(12):1630-1640. doi: 10.1016/S1470-2045(18)30570-9. Epub 2018 Nov 6. Lancet Oncol. 2018. PMID: 30413379 Clinical Trial.
-
De-escalated therapy for HR+/HER2+ breast cancer patients with Ki67 response after 2-week letrozole: results of the PerELISA neoadjuvant study.Ann Oncol. 2019 Jun 1;30(6):921-926. doi: 10.1093/annonc/mdz055. Ann Oncol. 2019. PMID: 30778520 Free PMC article. Clinical Trial.
-
Ki67 and lymphocytes in the pretherapeutic core biopsy of primary invasive breast cancer: positive markers of therapy response prediction and superior survival.Horm Mol Biol Clin Investig. 2017 Sep 22;32(2):/j/hmbci.2017.32.issue-2/hmbci-2017-0022/hmbci-2017-0022.xml. doi: 10.1515/hmbci-2017-0022. Horm Mol Biol Clin Investig. 2017. PMID: 28937963 Review.
Cited by
-
Multiplexed In Situ Spatial Protein Profiling in the Pursuit of Precision Immuno-Oncology for Patients with Breast Cancer.Cancers (Basel). 2022 Oct 6;14(19):4885. doi: 10.3390/cancers14194885. Cancers (Basel). 2022. PMID: 36230808 Free PMC article. Review.
-
Development of a machine learning-based radiomics signature for estimating breast cancer TME phenotypes and predicting anti-PD-1/PD-L1 immunotherapy response.Breast Cancer Res. 2024 Jan 29;26(1):18. doi: 10.1186/s13058-024-01776-y. Breast Cancer Res. 2024. PMID: 38287356 Free PMC article.
-
Combining histological grade, TILs, and the PD-1/PD-L1 pathway to identify immunogenic tumors and de-escalate radiotherapy in early breast cancer: a secondary analysis of a randomized clinical trial.J Immunother Cancer. 2023 May;11(5):e006618. doi: 10.1136/jitc-2022-006618. J Immunother Cancer. 2023. PMID: 37208129 Free PMC article. Clinical Trial.
-
PD-L1 blockade in combination with carboplatin as immune induction in metastatic lobular breast cancer: the GELATO trial.Nat Cancer. 2023 Apr;4(4):535-549. doi: 10.1038/s43018-023-00542-x. Epub 2023 Apr 10. Nat Cancer. 2023. PMID: 37038006 Free PMC article. Clinical Trial.
-
Integrating Tumor-Intrinsic and Immunologic Factors to Identify Immunogenic Breast Cancers from a Low-Risk Cohort: Results from the Randomized SweBCG91RT Trial.Clin Cancer Res. 2023 May 1;29(9):1783-1793. doi: 10.1158/1078-0432.CCR-22-2746. Clin Cancer Res. 2023. PMID: 37071498 Free PMC article. Clinical Trial.
References
-
- Cardoso F, Kyriakides S, Ohno S, Penault-Llorca F, Poortmans P, Rubio IT, et al. . Early breast cancer: ESMO Clinical Practice Guidelines for diagnosis, treatment and follow-up. Ann Oncol 2019;30:1194–220. - PubMed
-
- Cortazar P, Zhang L, Untch M, Mehta K, Costantino JP, Wolmark N, et al. . Pathological complete response and long-term clinical benefit in breast cancer: the CTNeoBC pooled analysis. Lancet 2014;384:164–72. - PubMed
-
- von Minckwitz G, Untch M, Blohmer J-U, Costa SD, Eidtmann H, Fasching PA, et al. . Definition and impact of pathologic complete response on prognosis after neoadjuvant chemotherapy in various intrinsic breast cancer subtypes. J Clin Oncol 2012;30:1796–804. - PubMed
-
- Gianni L, Mansutti M, Anton A, Calvo L, Bisagni G, Bermejo B, et al. . Comparing neoadjuvant nab-paclitaxel vs paclitaxel both followed by anthracycline regimens in women with ERBB2/HER2-negative breast cancer—the evaluating treatment with neoadjuvant abraxane (ETNA) trial: a randomized phase 3 clinical trial. JAMA Oncol 2018;4:302–8. - PMC - PubMed
Publication types
MeSH terms
Substances
Associated data
LinkOut - more resources
Full Text Sources
Medical
Research Materials
Miscellaneous
