Molecular and Metabolic Insights into Anthocyanin Biosynthesis for Leaf Color Change in Chokecherry (Padus virginiana)
- PMID: 34639038
- PMCID: PMC8509056
- DOI: 10.3390/ijms221910697
Molecular and Metabolic Insights into Anthocyanin Biosynthesis for Leaf Color Change in Chokecherry (Padus virginiana)
Abstract
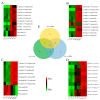
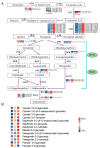
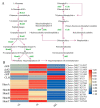
Chokecherry (Padus virginiana L.) is an important landscaping tree with high ornamental value because of its colorful purplish-red leaves (PRL). The quantifications of anthocyanins and the mechanisms of leaf color change in this species remain unknown. The potential biosynthetic and regulatory mechanisms and the accumulation patterns of anthocyanins in P. virginiana that determine three leaf colors were investigated by combined analysis of the transcriptome and the metabolome. The difference of chlorophyll, carotenoid and anthocyanin content correlated with the formation of P. virginiana leaf color. Using enrichment and correlation network analysis, we found that anthocyanin accumulation differed in different colored leaves and that the accumulation of malvidin 3-O-glucoside (violet) and pelargonidin 3-O-glucoside (orange-red) significantly correlated with the leaf color change from green to purple-red. The flavonoid biosynthesis genes (PAL, CHS and CHI) and their transcriptional regulators (MYB, HD-Zip and bHLH) exhibited specific increased expression during the purple-red periods. Two genes encoding enzymes in the anthocyanin biosynthetic pathway, UDP glucose-flavonoid 3-O-glucosyl-transferase (UFGT) and anthocyanidin 3-O-glucosyltransferase (BZ1), seem to be critical for suppressing the formation of the aforesaid anthocyanins. In PRL, the expression of the genes encoding for UGFT and BZ1 enzymes was substantially higher than in leaves of other colors and may be related with the purple-red color change. These results may facilitate genetic modification or selection for further improvement in ornamental qualities of P. virginiana.
Keywords: Padus virginiana; anthocyanin biosynthesis; leaf color; metabolomic; transcriptomics.
Conflict of interest statement
The authors declare that they have no known competing financial interests or personal relationships that could appear to influence the work reported in this paper.
Figures


Similar articles
-
Transcriptome profiling of two contrasting ornamental cabbage (Brassica oleracea var. acephala) lines provides insights into purple and white inner leaf pigmentation.BMC Genomics. 2018 Nov 6;19(1):797. doi: 10.1186/s12864-018-5199-3. BMC Genomics. 2018. PMID: 30400854 Free PMC article.
-
Combined transcriptome and metabolome integrated analysis of Acer mandshuricum to reveal candidate genes involved in anthocyanin accumulation.Sci Rep. 2021 Nov 30;11(1):23148. doi: 10.1038/s41598-021-02607-2. Sci Rep. 2021. PMID: 34848790 Free PMC article.
-
Transcriptome and metabolome analysis reveals anthocyanin biosynthesis pathway associated with ramie (Boehmeria nivea (L.) Gaud.) leaf color formation.BMC Genomics. 2021 Sep 22;22(1):684. doi: 10.1186/s12864-021-08007-0. BMC Genomics. 2021. PMID: 34548018 Free PMC article.
-
Recent insights into anthocyanin biosynthesis, gene involvement, distribution regulation, and domestication process in rice (Oryza sativa L.).Plant Sci. 2024 Dec;349:112282. doi: 10.1016/j.plantsci.2024.112282. Epub 2024 Oct 9. Plant Sci. 2024. PMID: 39389316 Review.
-
Anthocyanin metabolism and its differential regulation in purple tea (Camellia sinensis).Plant Physiol Biochem. 2023 Aug;201:107875. doi: 10.1016/j.plaphy.2023.107875. Epub 2023 Jul 9. Plant Physiol Biochem. 2023. PMID: 37451003 Review.
Cited by
-
Transcriptome Analysis Reveals Coexpression Networks and Hub Genes Involved in Papillae Development in Lilium auratum.Int J Mol Sci. 2024 Feb 19;25(4):2436. doi: 10.3390/ijms25042436. Int J Mol Sci. 2024. PMID: 38397114 Free PMC article.
-
Genome-Wide Analysis of the bHLH Gene Family in Loropetalum chinense var. rubrum: Identification, Classification, Evolution, and Diversity of Expression Patterns under Cultivation.Plants (Basel). 2023 Sep 26;12(19):3392. doi: 10.3390/plants12193392. Plants (Basel). 2023. PMID: 37836132 Free PMC article.
-
Comparative Transcriptome and Metabolome Profiling Reveal Mechanisms of Red Leaf Color Fading in Populus × euramericana cv. 'Zhonghuahongye'.Plants (Basel). 2023 Oct 9;12(19):3511. doi: 10.3390/plants12193511. Plants (Basel). 2023. PMID: 37836251 Free PMC article.
-
Integrative physiological, metabolomic, and transcriptomic analysis reveals the drought responses of two apple rootstock cultivars.BMC Plant Biol. 2024 Mar 26;24(1):219. doi: 10.1186/s12870-024-04902-2. BMC Plant Biol. 2024. PMID: 38532379 Free PMC article.
-
Genome-wide identification, bioinformatics and expression analysis of HD-Zip gene family in peach.BMC Plant Biol. 2023 Mar 2;23(1):122. doi: 10.1186/s12870-023-04061-w. BMC Plant Biol. 2023. PMID: 36864374 Free PMC article.
References
-
- Wang H., Walla J.A., Magnusson V.A., Zhong S., Dai W. Construction of genetic linkage maps and QTL mapping for X-disease resistance in tetraploid chokecherry (Prunus virginiana L.) using SSR and AFLP markers. Mol. Breed. 2014;34:143–157. doi: 10.1007/s11032-014-0025-3. - DOI
-
- Len M., Liu R. Antioxidant activity of Padus virginiana anthocyanins. Food Sci. 2013;34:67–71.
-
- Ren H.Z. Propagation and management of Prunus purpurea. Shanxi For. 2018;4:36–37.
-
- Yang J., Shi S.L., Ji X.H., Zhao L.Q., Xu C.Q. Effect of low temperature stress on physiological indexes of eight species color-leafed trees. North. Hortic. 2018:106–110. doi: 10.11937/bfyy.20172469. - DOI
-
- Tao H.Y. Seed Science & Technology. Cultivation of seedling of Prunus purpurea and Its application in landscape afforestation. Seed Sci. Technol. 2020;38:47–48.
MeSH terms
Substances
Grants and funding
LinkOut - more resources
Full Text Sources

