. 2021 Sep 15;16(1):64.
doi: 10.1186/s13024-021-00488-7.

Adult-onset CNS myelin sulfatide deficiency is sufficient to cause Alzheimer's disease-like neuroinflammation and cognitive impairment

Affiliations

Adult-onset CNS myelin sulfatide deficiency is sufficient to cause Alzheimer's disease-like neuroinflammation and cognitive impairment

Shulan Qiu et al. Mol Neurodegener. .

Abstract

Background: Human genetic association studies point to immune response and lipid metabolism, in addition to amyloid-beta (Aβ) and tau, as major pathways in Alzheimer's disease (AD) etiology. Accumulating evidence suggests that chronic neuroinflammation, mainly mediated by microglia and astrocytes, plays a causative role in neurodegeneration in AD. Our group and others have reported early and dramatic losses of brain sulfatide in AD cases and animal models that are mediated by ApoE in an isoform-dependent manner and accelerated by Aβ accumulation. To date, it remains unclear if changes in specific brain lipids are sufficient to drive AD-related pathology.

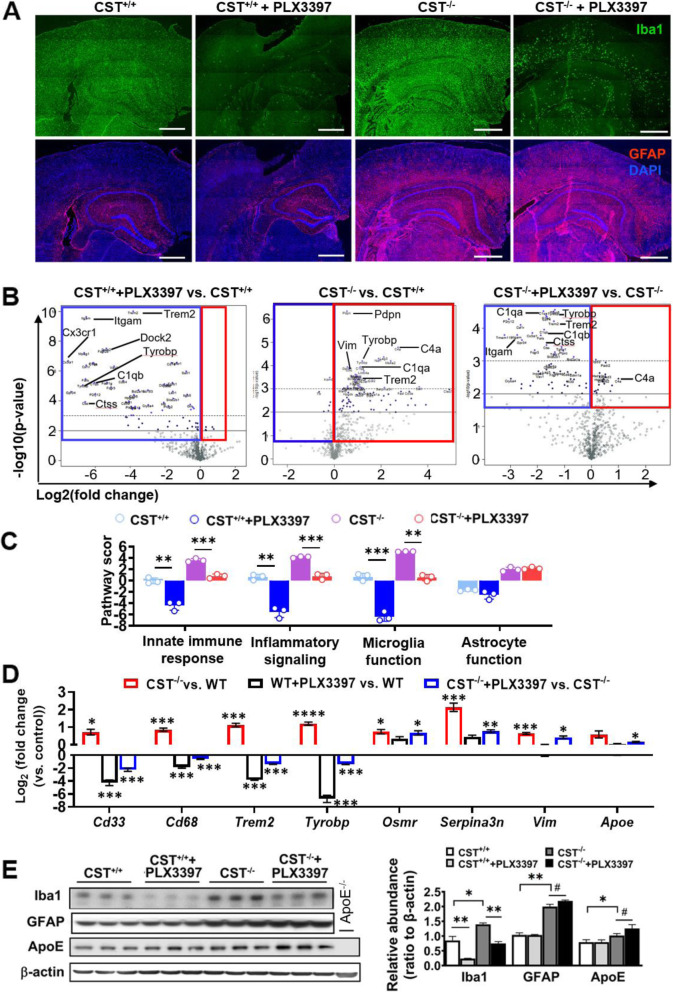
Methods: To study the consequences of CNS sulfatide deficiency and gain insights into the underlying mechanisms, we developed a novel mouse model of adult-onset myelin sulfatide deficiency, i.e., tamoxifen-inducible myelinating glia-specific cerebroside sulfotransferase (CST) conditional knockout mice (CSTfl/fl/Plp1-CreERT), took advantage of constitutive CST knockout mice (CST-/-), and generated CST/ApoE double knockout mice (CST-/-/ApoE-/-), and assessed these mice using a broad range of methodologies including lipidomics, RNA profiling, behavioral testing, PLX3397-mediated microglia depletion, mass spectrometry (MS) imaging, immunofluorescence, electron microscopy, and Western blot.

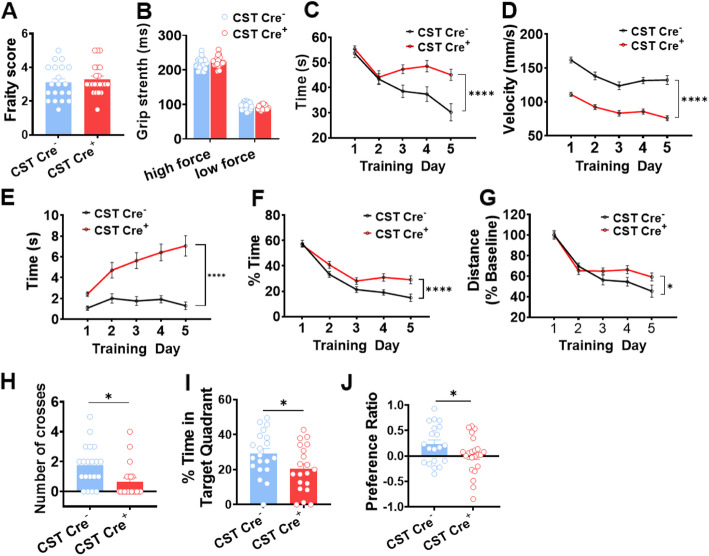
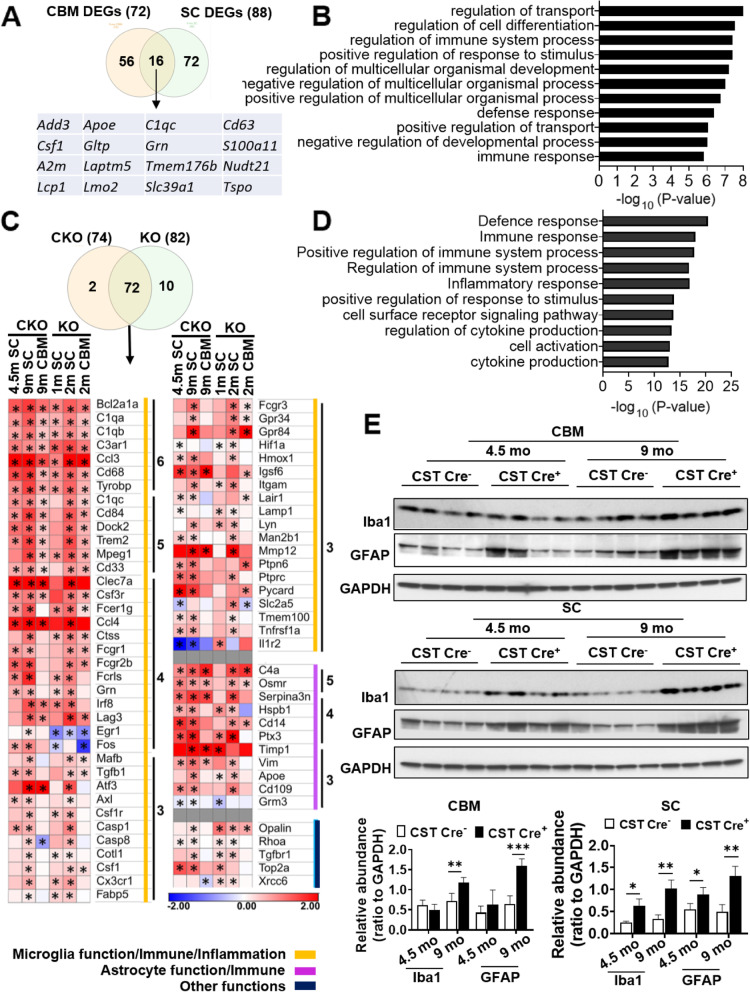
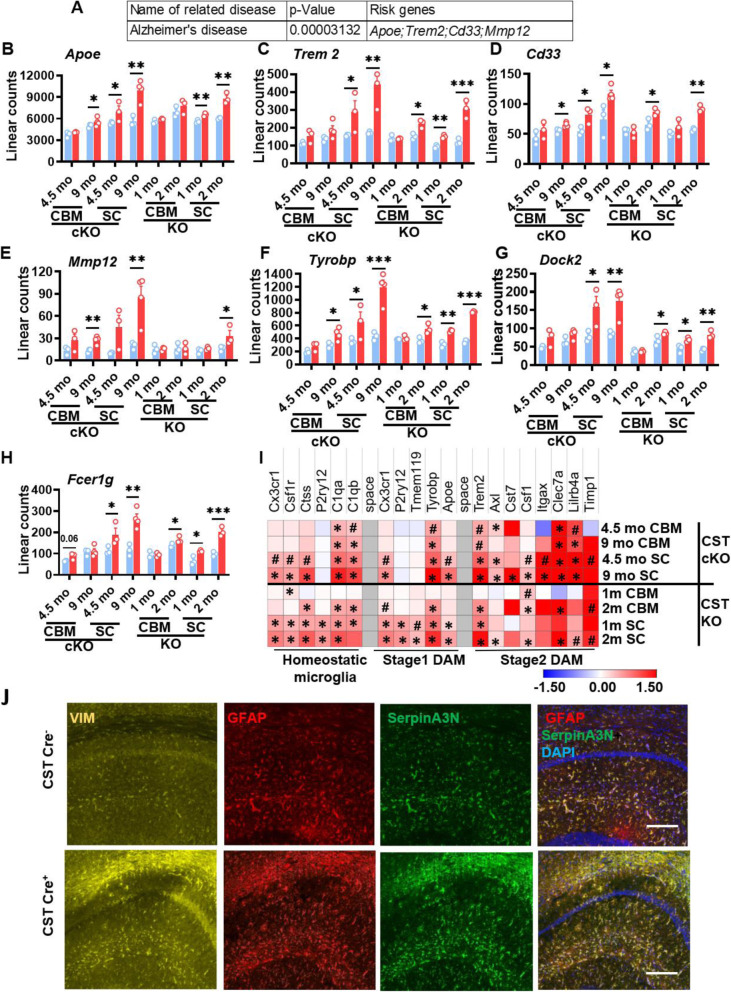
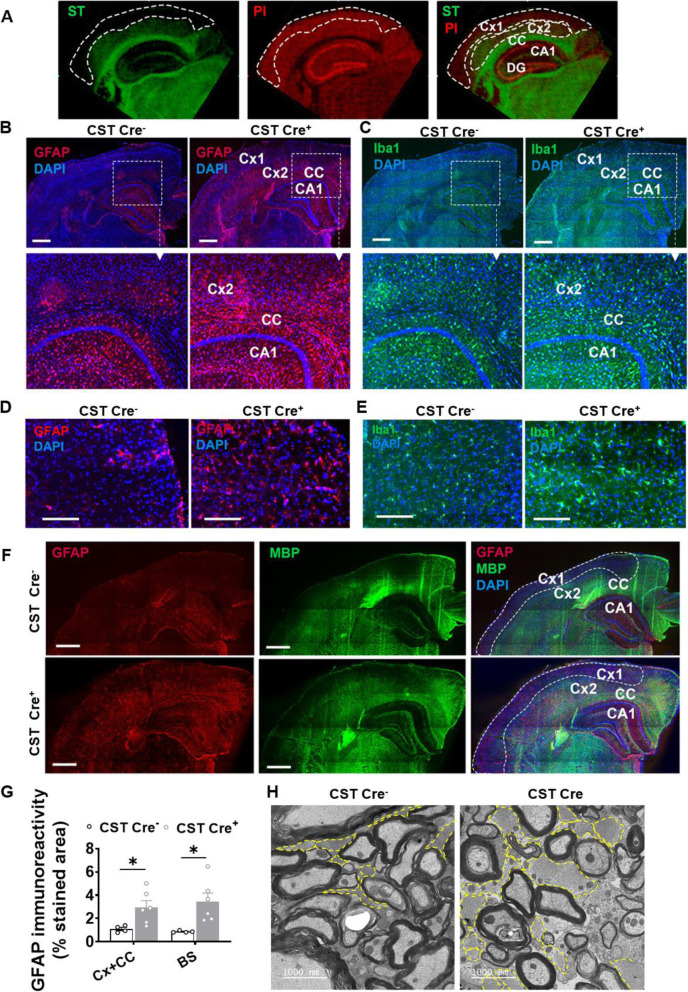
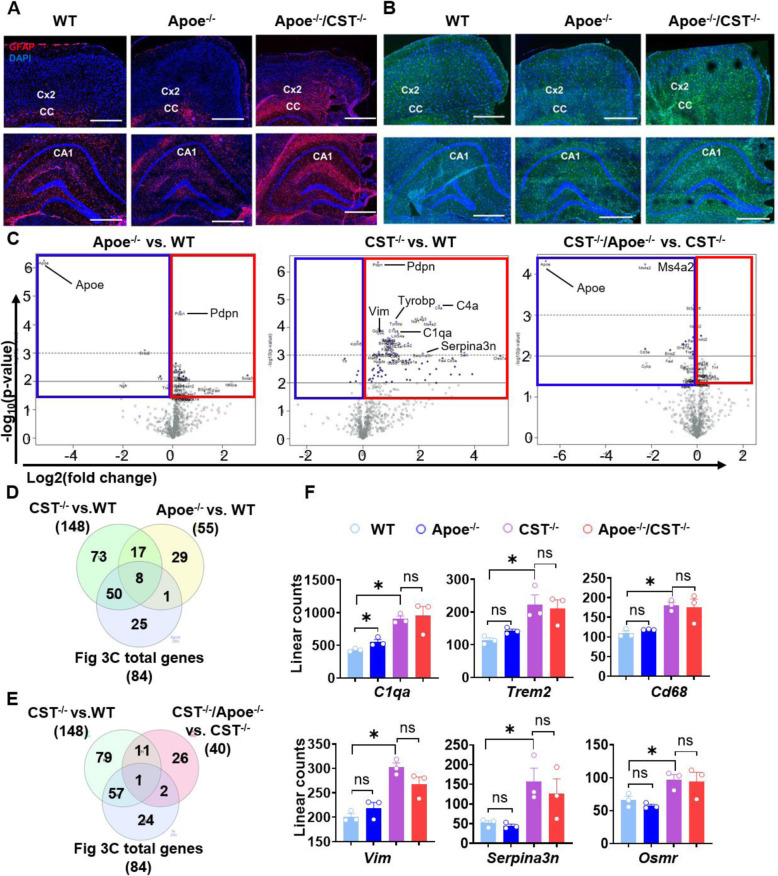
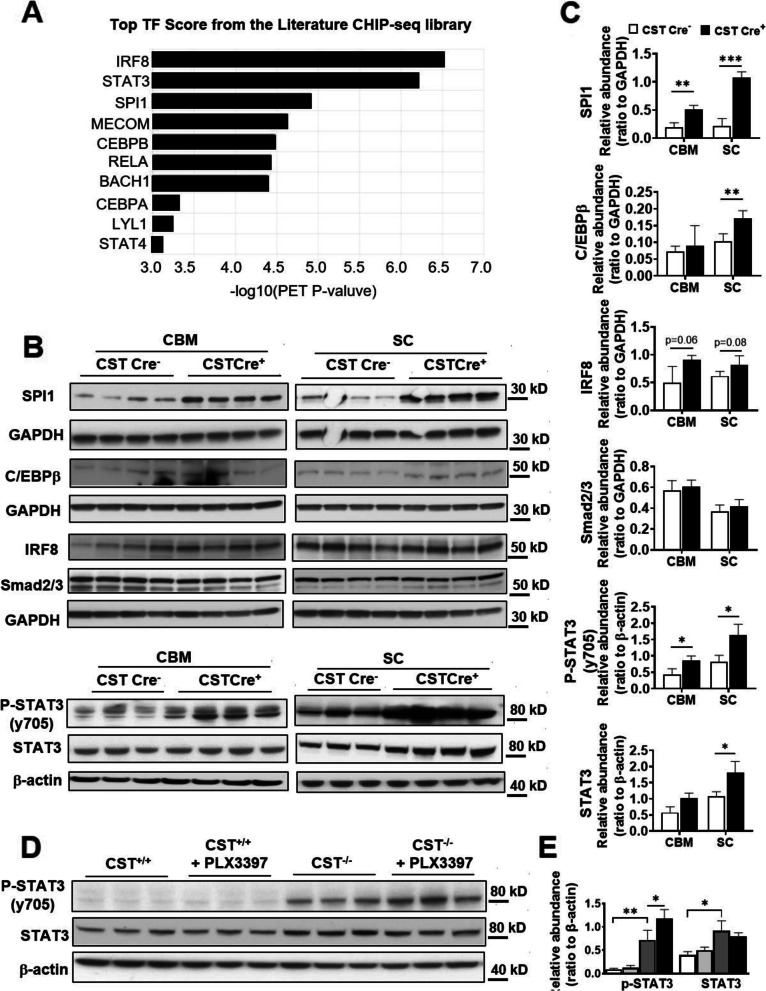
Results: We found that mild central nervous system (CNS) sulfatide losses within myelinating cells are sufficient to activate disease-associated microglia and astrocytes, and to increase the expression of AD risk genes (e.g., Apoe, Trem2, Cd33, and Mmp12), as well as previously established causal regulators of the immune/microglia network in late-onset AD (e.g., Tyrobp, Dock, and Fcerg1), leading to chronic AD-like neuroinflammation and mild cognitive impairment. Notably, neuroinflammation and mild cognitive impairment showed gender differences, being more pronounced in females than males. Subsequent mechanistic studies demonstrated that although CNS sulfatide losses led to ApoE upregulation, genetically-induced myelin sulfatide deficiency led to neuroinflammation independently of ApoE. These results, together with our previous studies (sulfatide deficiency in the context of AD is mediated by ApoE and accelerated by Aβ accumulation) placed both Aβ and ApoE upstream of sulfatide deficiency-induced neuroinflammation, and suggested a positive feedback loop where sulfatide losses may be amplified by increased ApoE expression. We also demonstrated that CNS sulfatide deficiency-induced astrogliosis and ApoE upregulation are not secondary to microgliosis, and that astrogliosis and microgliosis seem to be driven by activation of STAT3 and PU.1/Spi1 transcription factors, respectively.

Conclusion: Our results strongly suggest that sulfatide deficiency is an important contributor and driver of neuroinflammation and mild cognitive impairment in AD pathology.

Keywords: Alzheimer’s disease; Astrogliosis; Cerebroside sulfotransferase (CST); Cognitive impairment; Lipidomics; Microgliosis; Neuroinflammation; RNA profiling; Sulfatide.


Conflict of interest statement

Authors declare that they have no competing interests.

Figures

Fig. 1
Fig. 1
A novel inducible myelinating glia-specific CST cKO mouse model recapitulates AD-like adult-onset CNS-specific sulfatide loss without affecting oligodendrocyte/myelin homeostasis. (A) Tamoxifen injection and tissue harvest/analysis protocol. CST Cre and CST Cre+ mice were injected with tamoxifen at 3–4 mo of age and sacrificed at 4.5 and 9 mo post-injection, at 7.5 and 12 mo of age, respectively. (B) RNA extracted from the cerebrum (CRM) and spinal cord (SC) of CST Cre and CST Cre+ mice was assessed using the NanoString nCounter mouse Neuroinflammation Panel, linear mRNA counts for the Cst (Gal3st1) gene are shown. NanoString nSolver recommended test (heteroscedastic Welch’s t-Test), n = 3–4. (C) Lipid extracts from CRM, SC, and sciatic nerve (SN) of CST Cre and CST Cre+ mice were assessed by shotgun lipidomics; total sulfatide levels are shown as nmol/mg of total protein. See Fig. S2B-F for additional lipid classes. Two-way ANOVA with Bonferroni posthoc test for multiple comparisons, n = 4–8. (D) Heatmap displaying log2 fold changes of oligodendrocyte/myelin function-related genes included in the Nanotring panel (except Gal3st1, which is shown separately) from CRM, SC of CST cKO mice, as well as from 1 and 2 mo old CST KO mice for comparison, relative to their respective controls. Heteroscedastic Welch’s t-Test, n = 3–4. P-value is displayed within each heat map cell (*p < 0.05). (E) Oligodendrocyte pathway scores were obtained using nSolver 4.0 Advanced Analysis (NanoString Technologies). Two-way ANOVA with Bonferroni posthoc test for multiple comparisons, n = 3–4. (F) CRM and SC NP40 homogenate supernatants were assessed by Western blot using antibodies against myelin-associated glycoprotein (MAG) and 2′,3′-Cyclic nucleotide 3′-phosphodiesterase (CNP). Two-tailed unpaired t-Test, n = 3–4. *p < 0.05, **p < 0.01, ***p < 0.001. Data represent the mean ± S.E.M
Fig. 2
Fig. 2
Adult-onset sulfatide deficiency caused cognitive impairment. The following behavior paradigms were run on CST cKO mice 10 mo post-injection. (A) Frailty Index. (B) Grip strength test. (C-G) Acquisition phase of the Morris Water Maze (MWM) test using a hidden platform, Two-way ANOVA p-value for the genotype effect in MWM test is shown between the data lines. (C) Swim time (latency). (D) Swim velocity. (E) Floating time (movement< 20 mm/s). (F) Thigmotaxis. (G) Swim distance that was normalized to the baseline of the first day of MWM test. (H-I) Probe trial of the MWM test on day 6, when platform was removed. (H) The times to cross the former platform location. (I) The percentage of time spent at the target quadrant. (J) Novel Object Recognition (NOR) test: Preference Ratio (time spent on novel object/time spent old object). (A, H-J) Two-tailed unpaired t-Test. n = 20–22. (B-G) Two-way ANOVA. n = 20–22. *p < 0.05, **p < 0.01, ***p < 0.001, ****p < 0.0001. Data represent the mean ± S.E.M
Fig. 3
Fig. 3
CNS sulfatide depletion induces a chronic immune/inflammatory response characterized by strong progressive activation of microglia and astrocytes. (A) Venn diagram showing the number of specific and shared differentially expressed genes (DEGs) in the CRM and SC of CST cKO mice compared to their respective controls from the Nanostring AD panel. Shared DEGs are listed. (B) Gene Ontology (GO) analysis for the 16 shared DEGs was performed using the Database for Annotation, Visualization and Integrated Discovery (DAVID). Top functions are listed. (C) Venn diagram showing the number of DEGs found in at least three groups from six groups of different CNS regions/time points from both CST cKO and CST KO mice. Heatmap displaying log2 fold changes of the 72 DEGs that were shared by both CST cKO and CST KO mice. DEGs were grouped into three major categories by lines of different color and ordered based on how many times they were significantly altered in six groups. See Fig. S3F for the list of the DEGs that were specific to CST cKO or CST KO mice. Heteroscedastic Welch’s t-Test, n = 3–4. p-values are displayed within each heat map cell (*p < 0.05). (D) List of the top functions from GO analysis for the 72 shared DEGs. (E)) Western blot analysis from cerebrum and spinal cord of 4.5 mo and 9 mo post-injection CST cKO mice using antibodies against Iba1 and GFAP. Relative expression was quantified and plotted as a ratio to GAPDH. Two-tailed unpaired t-Test, n = 4. *p < 0.05, **p < 0.01. Data represent the mean ± S.E.M
Fig. 4
Fig. 4
Sulfatide deficiency caused AD-like neuroinflammation, leading to disease-associated microglia and astrocytes signatures. (A) Gene list enrichment analysis using Enrichr for the 72 DEGs shared by both CST cKO and CST KO CNS (listed in Fig. 3C), The top 1 disease reaching a significant difference was Alzheimer’s disease with four AD risk genes: Apoe, Trem2, Cd33, and Mmp12 among the DEGs. (B-E) Linear counts of each of these AD risk genes at different CNS regions/time points for CST cKO and CST KO, compared to their respective controls. (F-H) Three genes previously described as key causal regulators of immune networks for late-onset AD were also among the shared DEGs: Tyrobp, Dock, Fcerg1. (I) Heatmap displaying log2 fold changes of the homeostatic microglia and stage1/2 reactive microglia-specific genes (those included in the Nanostring panel) in the CNS of CST cKO and KO, compared to their respective controls. 0.05 < #p < 0.1, *p < 0.05. (J) Immunofluorescence staining on the hippocampus (CA1 region shown) of CST Cre and CST Cre+ brain 9 mo post injection using antibodies against typical markers of disease-associated astrocytes: VIM (yellow), GFAP (red) and SerpinA3N (green). Scale bar: 200 μm. (B-I) Heteroscedastic Welch’s t-Test, n = 3–4. *p < 0.05, **p < 0.01, ***p < 0.001. Data represent the mean ± S.E.M
Fig. 5
Fig. 5
Adult-onset myelin sulfatide deficiency lead to marked astrogliosis and microgliosis within specific myelin-enriched brain regions. (A) MALDI-imaging of an adult WT mouse brain displaying the distribution of the most abundant sulfatide species (ST(N24:1), m/z 888, green), as well as a neuronal rich phosphatidylinositol species (PI(38:5), m/z 883.5, red). (B-E) Representative immunofluorescence images of CST cKO Cre and CST cKO Cre+ mice 9 mo post-injection using antibodies against GFAP (red) and Iba1 (green) on brain (B,C) and brain stem (D,E). Scale bar: 500 μm (B, C) and 200 μm (D,E). Quantification of GFAP IF staining area percentage on (cortex + corpus callosum) and brain stem was shown in (G). (F) Co-staining of GFAP (red) and myelin basic protein (MBP, green) in brain of CST cKO Cre and CST cKO Cre+ mice 9 mo post-injection. Scale bar: 500 μm. (G) GFAP relative expression on (cortex + corpus callosum) and brain stem was quantified and plotted as a IF staining area percentage. (H) Electron microscopy images from the spinal cord of CST cKO Cre and CST cKO Cre+ mice 11 mo post-injection. Astrocytes, identified by the intermediate filament GFAP and glycogen clusters were highlighted by the yellow dash line. Cx: cortex (Cx1: outer cortex without enriched sulfatide; Cx2: inner cortex with enriched sulfatide); CC: corpus callosum; CA1: Cornu Ammonis 1 region of the hippocampus; DG: hippocampal dentate gyrus
Fig. 6
Fig. 6
Myelin sulfatide deficiency induced AD-like neuroinflammation even in the absence of ApoE. (A,B) Representative immunofluorescence images from brain of 3-mo-old ApoE+/+/CST+/+, ApoE−/−/CST+/+, and ApoE−/−/CST−/− mice using antibodies against GFAP (red) and Iba1 (green). Cx: cortex; CC: corpus callosum; CA1: Cornu Ammonis 1 region of the hippocampus. Scale bar: 200 μm. (C-F) The brain mRNA from the four genotypes (ApoE+/+/CST+/+, ApoE−/−/CST+/+, ApoE+/+/CST−/−and ApoE−/−/CST−/−) was accessed using NanoString neuroinflammation panel. (C) Volcano plot displaying -log10 p-value and log2 fold change for each gene to show the CST KO effect (middle) and the ApoE KO effect in the presence (CST+/+, left) or absence of sulfatide (CST−/−, right). (D) Venn diagrams showing the number of specific and shared upregulated DEGs from ApoE−/− vs. WT, CST−/− vs. WT and the DEGs listed in Fig. 3C. The gene lists were shown in Fig. S9. (E) Venn diagrams showing the number of specific and shared upregulated DEGs from CST−/− vs.WT, ApoE−/−/CST−/− vs. CST−/− and the DEGs listed in Fig. 3C. The gene lists were shown in Fig. S9. (F) Linear counts of several typical microgliosis- and astrogliosis-related genes in ApoE+/+/CST+/+, ApoE−/−/CST+/+, ApoE+/+/CST−/−and ApoE−/−/CST−/− mouse brain. Heteroscedastic Welch’s t-Test, n = 3. *p < 0.05, ns: no statistical significance
Fig. 7
Fig. 7
Sulfatide deficiency-induced astrogliosis and upregulated ApoE were not secondary to microgliosis. CST+/+ and CST−/− mice were fed PLX3397-containing or control chow-like diet from 1 to 3 mo of age. (A) Representative immunofluorescence images from brain sections using antibodies against Iba-1 (green) and GFAP (red); nuclei were stained with DAPI; See Fig. S10A for higher magnification and merged images. Scale bar: 500 μm. (B-D) Brain mRNA from four groups (CST+/+, CST+/++PLX3397, CST−/−, and CST−/− + PLX3397 mice) was accessed using NanoString neuroinflammation panel. (B) Volcano plot displaying -log10 p-value and log2 fold change for each gene to show the CST KO effect (middle) and drug-effect within CST+/+ (left) and CST−/− (right) brain. See Fig. S10B-D for PCA and Venn diagrams showing the number of specific and shared DEGs between treatments. (C) NanoString pathway score analysis for astrocyte function, microglia function, innate immune response, and inflammatory signaling for each of the four groups. Two-way ANOVA with Bonferroni post-hoc test for multiple comparisons, n = 3. (D) Fold changes of several typical microgliosis or astrogliosis related genes in CST+/+ and CST−/− brain with or without PLX3397 treatment to display the drug effects on microglia and astrocytes. Heteroscedastic Welch’s t-Test, n = 3. (E) Western blot analysis from cerebrum homogenates using antibodies against Iba-1, GFAP, ApoE and β-actin. Two-tailed unpaired t-Test, n = 3. #p < 0.1, *p < 0.05, **p < 0.01, ***p < 0.001. Data represent the mean ± S.E.M
Fig. 8
Fig. 8
Myelin sulfatide deficiency resulted in upregulation of SPI1, STAT3, and C/EBPβ transcription factors in CNS. (A) The transcription factors (TF) score by using ChEA3 (ChIP-X Enrichment Analysis Version) with 72 DEGs listed in Fig. 3C. (B) Western blot analysis from cerebrum and spinal cord of 9 mo post-injection CST cKO mice using antibodies against transcription factors SPI1, C/EBPβ, IRF8, Smad2/3, STAT3 and its Y705 phosphorylation. (C) Relative expression was quantified and plotted as a ratio to GAPDH or β-actin for (B). (D) Western blot analysis from cerebrum of CST+/+ and CST−/− mice with or without PLX3397 treatment using antibodies against STAT3 and its Y705 phosphorylation and β-actin. (E) Relative expression was quantified and plotted as a ratio to β-actin for (D). (C,E) Two-tailed unpaired t-Test, n = 3. *p < 0.05, **p < 0.01. Data represent the mean ± S.E.M
Fig. 9
Fig. 9
The schematic summary diagram showing the relationship between sulfatide loss, ApoE overexpression and the sulfatide deficiency caused AD-like neuroinflammation

Similar articles

Cited by

References

    1. Cummings J, Ritter A, Zhong K. Clinical trials for disease-modifying therapies in Alzheimer's disease: a primer, lessons learned, and a blueprint for the future. J Alzheimers Dis. 2018;64(s1):S3–S22. doi: 10.3233/JAD-179901. - DOI - PMC - PubMed
    1. Heneka MT, Carson MJ, Khoury JE, Landreth GE, Brosseron F, Feinstein DL, Jacobs AH, Wyss-Coray T, Vitorica J, Ransohoff RM, Herrup K, Frautschy SA, Finsen B, Brown GC, Verkhratsky A, Yamanaka K, Koistinaho J, Latz E, Halle A, Petzold GC, Town T, Morgan D, Shinohara ML, Perry VH, Holmes C, Bazan NG, Brooks DJ, Hunot S, Joseph B, Deigendesch N, Garaschuk O, Boddeke E, Dinarello CA, Breitner JC, Cole GM, Golenbock DT, Kummer MP. Neuroinflammation in Alzheimer's disease. Lancet Neurol. 2015;14(4):388–405. doi: 10.1016/S1474-4422(15)70016-5. - DOI - PMC - PubMed
    1. Kaur D, Sharma V, Deshmukh R. Activation of microglia and astrocytes: a roadway to neuroinflammation and Alzheimer's disease. Inflammopharmacology. 2019;27(4):663–677. doi: 10.1007/s10787-019-00580-x. - DOI - PubMed
    1. Newcombe EA, Camats-Perna J, Silva ML, Valmas N, Huat TJ, Medeiros R. Inflammation: the link between comorbidities, genetics, and Alzheimer's disease. J Neuroinflammation. 2018;15(1):276. doi: 10.1186/s12974-018-1313-3. - DOI - PMC - PubMed
    1. Rajendran L, Paolicelli RC. Microglia-mediated synapse loss in Alzheimer's disease. J Neurosci. 2018;38(12):2911–2919. doi: 10.1523/JNEUROSCI.1136-17.2017. - DOI - PMC - PubMed

Publication types

MeSH terms