. 2021 Aug 23;6(16):e140687.
doi: 10.1172/jci.insight.140687.

The role of SHP/REV-ERBα/CYP4A axis in the pathogenesis of alcohol-associated liver disease

Affiliations

The role of SHP/REV-ERBα/CYP4A axis in the pathogenesis of alcohol-associated liver disease

Zhihong Yang et al. JCI Insight. .

Abstract

Alcohol-associated liver disease (ALD) represents a spectrum of histopathological changes, including alcoholic steatosis, steatohepatitis, and cirrhosis. One of the early responses to excessive alcohol consumption is lipid accumulation in the hepatocytes. Lipid ω-hydroxylation of medium- and long-chain fatty acid metabolized by the cytochrome P450 4A (CYP4A) family is an alternative pathway for fatty acid metabolism. The molecular mechanisms of CYP4A in ALD pathogenesis have not been elucidated. In this study, WT and Shp-/- mice were fed with a modified ethanol-binge, National Institute on Alcohol Abuse and Alcoholism model (10 days of ethanol feeding plus single binge). Liver tissues were collected every 6 hours for 24 hours and analyzed using RNA-Seq. The effects of REV-ERBα agonist (SR9009, 100 mg/kg/d) or CYP4A antagonist (HET0016, 5 mg/kg/d) in ethanol-fed mice were also evaluated. We found that hepatic Cyp4a10 and Cyp4a14 expression were significantly upregulated in WT mice, but not in Shp-/- mice, fed with ethanol. ChIP quantitative PCR and promoter assay revealed that REV-ERBα is the transcriptional repressor of Cyp4a10 and Cyp4a14. Rev-Erbα-/- hepatocytes had a marked induction of both Cyp4a genes and lipid accumulation. REV-ERBα agonist SR9009 or CYP4A antagonist HET0016 attenuated Cyp4a induction by ethanol and prevented alcohol-induced steatosis. Here, we have identified a role for the SHP/REV-ERBα/CYP4A axis in the pathogenesis of ALD. Our data also suggest REV-ERBα or CYP4A as the potential therapeutic targets for ALD.

Keywords: Fatty acid oxidation; Hepatology; Mouse models; Transcription.


Figures

Figure 1
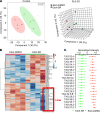
Figure 1. Activation of hepatic Cyp4a10 and Cyp4a14 in mice fed with ethanol plus binge model was attenuated in Shp−/− mice.
(A) Heatmap of RNA-Seq analysis from WT and Shp−/− mice treated with or without ethanol plus binge model (n = 3/group/ZT time point). SC, Shp−/− control; SE, Shp−/− treated with ethanol; WC, WT control; WE, WT treated with ethanol; ZT, Zeitgeber time. (B) IPA-generated hydroxylation of lipid network using the data from the liver tissue at ZT 12 from each experimental group using Ingenuity Pathway Analysis (IPA). Green, down-regulated in indicated comparisons; numbers under the blue box, fold changes; red, upregulated in indicated comparisons. (C) Genome browser view of RNA-Seq reads in the Cyp4a10 and Cy4a14 loci. (D) qPCR validation of Cyp4a10 and Cyp4a14 mRNAs expression. *P < 0.05, **P < 0.01, ***P < 0.001, ****P < 0.0001 versus WC; #P < 0.05, ##P < 0.01, ###P < 0.001, ####P < 0.0001 versus WE. Two-way ANOVA. (E) Western blot analysis of CYP4A expression. The ZT time point highlight in red is when the CYP4A expression reached the peak in that group (n = 3/group/ZT time point).
Figure 2
Figure 2. REV-ERBα is the potential transcriptional regulator of Cyp4a10 and Cyp4a14.
(A) Proximity ligation assay (PLA, red) demonstrated the interaction between GFP-SHP (green) and FLAG-REV-ERBα proteins in HEK293T cells. Scale bar: 100 μm. (B) Three RNA-Seq data sets, Rev-Erbα−/− versus WT (GSE59486, GSE59460), Shp−/− versus WT (GSE43893), and WE versus WC (ZT 12), were integrated to identify overlapping genes, which were coregulated by each pathway. Venn diagram indicated 9 overlapping genes, including both Cyp4a10 and Cyp4a14 (red). WC, WT control; WE, WT treated with ethanol. (C) ChIP-Seq (GSE67962) revealed the location of REV-ERBα binding peaks on Cyp4a10 and Cyp4a14 promoters in mouse livers (red arrows). The mutated REV-ERBα DNA-binding domain (DBD-mut) served as negative controls. The binding peak indicated by the purple arrow could be the binding independent from REV-ERBα DNA-binding domain. (D) The diagram of Cyp4a10 and Cyp4a14 promoter with distance from transcription start site (TSS) and REV-ERBα binding sites. Black arrows indicated location of the ChIP primers. Mut, mutant on the REV-ERBα binding site in the promoter constructs. (E) ChIP assay with anti-REV-ERBα Ab or IgG (negative control) from mouse liver at ZT 12. WT-Con, WT control; WT-Etoh, WT-ethanol. ****P < 0.0001 versus IgG; ###P < 0.001, ####P < 0.0001 versus WT-Con. One-way ANOVA. (F) Luciferase assay with Cyp4a10 or Cyp4a14 promoter and cotransfected with 0, 50, or 100 ng/well of REV-ERBα plasmids in 24-well plates. *P < 0.05, **P < 0.01 versus control. One-way ANOVA. (G) Luciferase assay with indicated promoters and cotransfected with 0, 50, 100 ng/well of pLKO-shRNA-REV-ERBα plasmids (sh-Rev-Erbα). *P < 0.05, **P < 0.01, ***P < 0.001 versus control. One-way ANOVA. (H) Luciferase assay with indicated promoters and cotransfected with 100 ng/well pcDNA3 (p) or REV-ERBα (Rev100) plasmids. **P < 0.01 versus pcDNA3. Two-tailed Student’s t test. (I) Luciferase assay with indicated promoters and plasmids (100 ng/each). **P < 0.01, ***P < 0.001 versus control. One-way ANOVA.
Figure 3
Figure 3. Deficiency of REV-ERBα largely induced both Cyp4a10 and Cyp4a14 expression, promoted lipid accumulation and oxidative stress.
(A) qPCR analysis of hepatic Cyp4a10 and Cyp4a14 mRNAs in WT or Rev-Erbα−/− mice ***P < 0.001; ****P < 0.0001 versus WT. Two-tailed Student’s t test. (B) Western blot analysis of CYP4A protein from WT and Rev-Erbα−/− primary hepatocytes treated with or without 50 mM ethanol (Etoh) for 24 hours. (C) Oil Red O (left) and Nile Red (right) staining in primary hepatocytes of WT or Rev-Erbα−/− mice treated with or without 50 mM ethanol for 24 hours. Scale bar: 100 μm. (D) The quantification of the positive area (% to total area) from Nile Red staining (right). *P < 0.05, **P < 0.01 versus WT-E(-); ##P < 0.05 versus WT-E(+). One-way ANOVA. (E) ROS generation from WT and Rev-Erbα−/− primary hepatocytes treated with or without 50 mM Ethanol for indicated times. *P < 0.05, **P < 0.01 versus WT. One-way ANOVA.
Figure 4
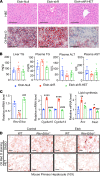
Figure 4. Treatment of REV-ERBα agonist SR9009 or CYP4A antagonist HET0016 substantially improved alcoholic steatosis and alcohol-induced liver injury.
(A) Gross appearance (top), H&E staining (middle), and Oil Red O staining (bottom) of the livers of mice treated with SR9009 (100 mg/kg/d) or HET0016 (5 mg/kg/d) from days 1–11 over the course of ethanol feeding (n = 4/group). (B) QPCR analysis of Cyp4a10 and Cyp4a14 mRNAs. *P < 0.05, **P < 0.01, ****P < 0.0001 versus Con-DMSO; ####P < 0.001 versus Etoh-DMSO. One-way ANOVA. (C) Plasma ALT in indicated groups. Ns versus Con-DMSO or Etoh-DMSO. One-way ANOVA. (D) QPCR analysis of genes related to lipid metabolism (top panel) and lipid delivery (bottom panel). *P < 0.05, **P < 0.01, ***P < 0.001, ****P < 0.0001 versus Etoh-DMSO. One-way ANOVA. (E) IHC staining of CYP2E1 or CYP4A in each experimental group. Con, control; Etoh, ethanol; HET, CYP4A antigonist-HET0016; SR, REV-ERBα agonist-SR9009. Scale bar: 200 μm.
Figure 5
Figure 5. Treatment with REV-ERBα agonist SR9009 partially restored the dysregulation of hepatic metabolic profiles in ethanol-fed mice.
(A) The predominance of partial least squares-discriminant analysis (PLS-DA) scores plots in 2D (left) and 3D (right) format. The ovals filled with different color indicated 95% CI Hotelling’s ellipses. (B) Volcano plot (upper) indicated the significantly changed metabolites. The red dots represent metabolites with a P value ≤0.05 and log2(FC) > or < 1. FC: fold changes. Red-circled dots were selected metabolites, shown in box plots (lower). (C) Heatmap showing differential abundance of metabolites in ethanol-fed mice (Etoh-DMSO) versus Control (Con-DMSO) (upper) and ethanol-fed mice treated with SR9009 (Etoh-SR) versus ethanol-fed mice (Etoh-DMSO). Red label indicated metabolites decreased in ethanol-fed mice, which were restored with SR9009 treatment.
Figure 6
Figure 6. REV-ERBα agonist SR9009 treatment reduced hepatic TAGs in lipidomic profiles in ethanol-fed mice.
(A) The predominance of partial least squares-discriminant analysis (PLS-DA) scores plots in 2D (left) and 3D (right) format. The ovals filled with different color indicated 95% CI Hotelling’s ellipses. (B) Heatmap showing differential abundance of lipids in ethanol-fed mice treated with SR9009 (Etoh-SR) versus ethanol-fed control mice (Etoh-DMSO). Red square indicated TAGs decreased in SR9009-treated ethanol-fed mice. (C) Top 20 significantly reduced TAGs in SR9009-treated ethanol-fed mice.
Figure 7
Figure 7. CYP4A antagonist HET0016 attenuated Rev-Erbα deficiency enhanced lipid accumulation in ethanol treatment.
(A) HE (top) and Oil Red O staining (bottom) in Etoh binged mice livers of indicated groups. WT mice were injected with Null (Etoh-Null) or shRNA (Etoh-shR) for Rev-Erbα for 1 week before being subjected to the Etoh-binge model. During the Etoh feeding period, mice were IP injected with DMSO or HET0016 (HET, 5 mg/kg) (Etoh-shR-HET) daily. Scale bar: 200 μm. (B) Liver TG and plasma TG, ALT, and AST levels in indicated groups. (C) qPCR analysis of Rev-Erbα, Cyp4a10, and Cyp4a14, and Acc and Fasn mRNAs. *P < 0.05; **P < 0.01; ****P < 0.0001 versus Etoh-Null; #P < 0.05; ###P < 0.001; ####P < 0.0001 versus Etoh-shR. One-way ANOVA. (D) Oil Red O staining in primary hepatocytes of WT or Rev-Erbα−/− mice. Primary hepatocytes were pretreated with HET0016 (4 μM) for 6 hours followed by 50 mM Etoh for 24 hours. Scale bar: 100 μm.
Figure 8
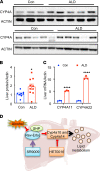
Figure 8. CYP4A was induced in human alcoholic liver cirrhosis.
(A) Western blot analysis of CYP4A protein levels in controls and patients with alcoholic liver disease (ALD). ACTIN was used as the loading control. (B) The intensity scan of the Western blot bands using ImageJ (Version 2.0.0). *P < 0.05 versus controls. Student’s t test. (C) qPCR analysis for CYP4A11 and CYP4A22, the human homolog of the mouse Cyp4a14 and Cyp4a10, in human patients with ALD. ALD (n = 10, triplicated after pooled); Con, controls (n = 8, triplicated after pooled). ****P < 0.0001 versus Control. Student’s t test. (D) Proposed mechanism of the SHP/REV-ERBα/CYP4A axis in the pathogenesis of ALD. Alcohol activates CYP4A through the inhibition of REV-ERBα leading to hepatic steatosis and liver injury. Treatment with REV-ERBα agonist SR9009 or CYP4A antagonist HET0016 ameliorated alcohol-induced liver injury.

Similar articles

Cited by

References

    1. Liangpunsakul S, et al. Alcoholic liver disease in Asia, Europe, and North America. Gastroenterology. 2016;150(8):1786–1797. doi: 10.1053/j.gastro.2016.02.043. - DOI - PMC - PubMed
    1. Gilmore W, et al. Alcohol: taking a population perspective. Nat Rev Gastroenterol Hepatol. 2016;13(7):426–434. doi: 10.1038/nrgastro.2016.70. - DOI - PubMed
    1. Lachenmeier DW, et al. Influence of unrecorded alcohol consumption on liver cirrhosis mortality. World J Gastroenterol. 2014;20(23):7217–7222. doi: 10.3748/wjg.v20.i23.7217. - DOI - PMC - PubMed
    1. Sozio MS, et al. The role of lipid metabolism in the pathogenesis of alcoholic and nonalcoholic hepatic steatosis. Semin Liver Dis. 2010;30(4):378–390. doi: 10.1055/s-0030-1267538. - DOI - PubMed
    1. Mandrekar P, et al. Alcoholic hepatitis: Translational approaches to develop targeted therapies. Hepatology. 2016;64(4):1343–1355. doi: 10.1002/hep.28530. - DOI - PMC - PubMed

Publication types

MeSH terms