. 2022 Jan;43(1):177-193.
doi: 10.1038/s41401-021-00715-3. Epub 2021 Jul 22.

Cepharanthine sensitizes human triple negative breast cancer cells to chemotherapeutic agent epirubicin via inducing cofilin oxidation-mediated mitochondrial fission and apoptosis

Affiliations

Cepharanthine sensitizes human triple negative breast cancer cells to chemotherapeutic agent epirubicin via inducing cofilin oxidation-mediated mitochondrial fission and apoptosis

Li-Wen Shen et al. Acta Pharmacol Sin. 2022 Jan.

Abstract

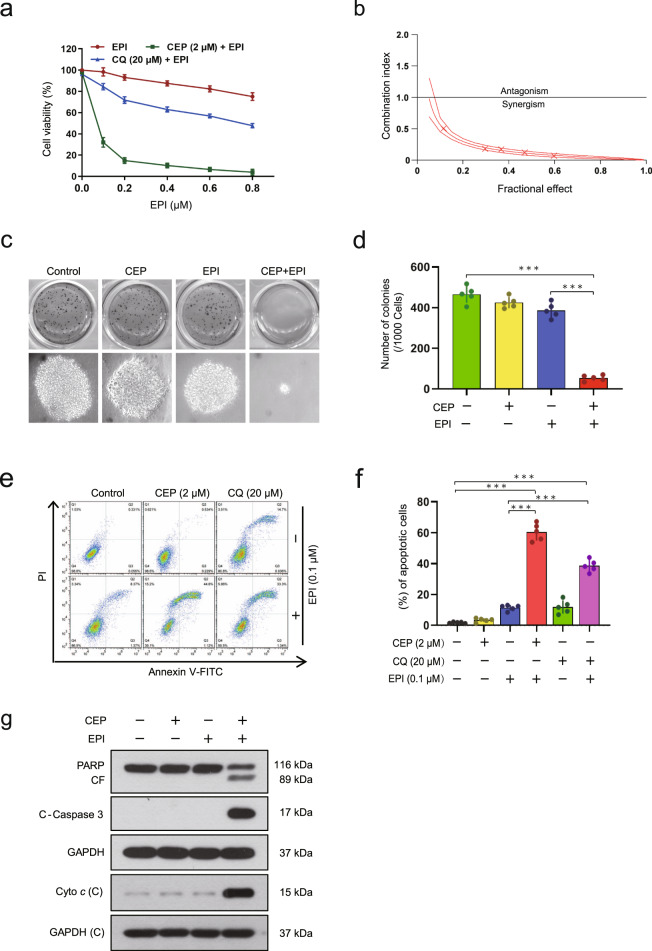
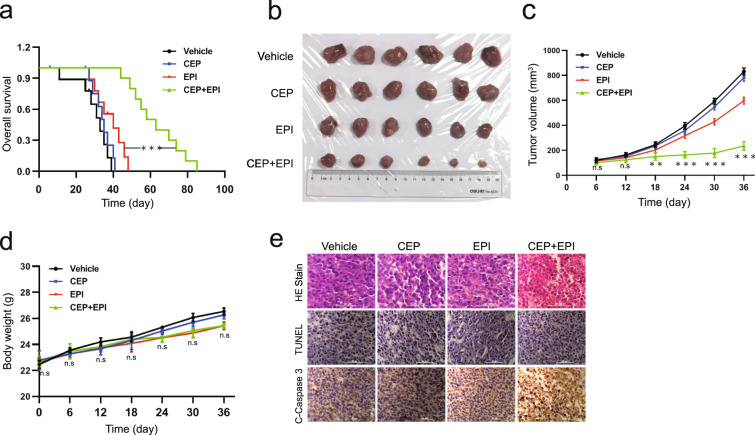
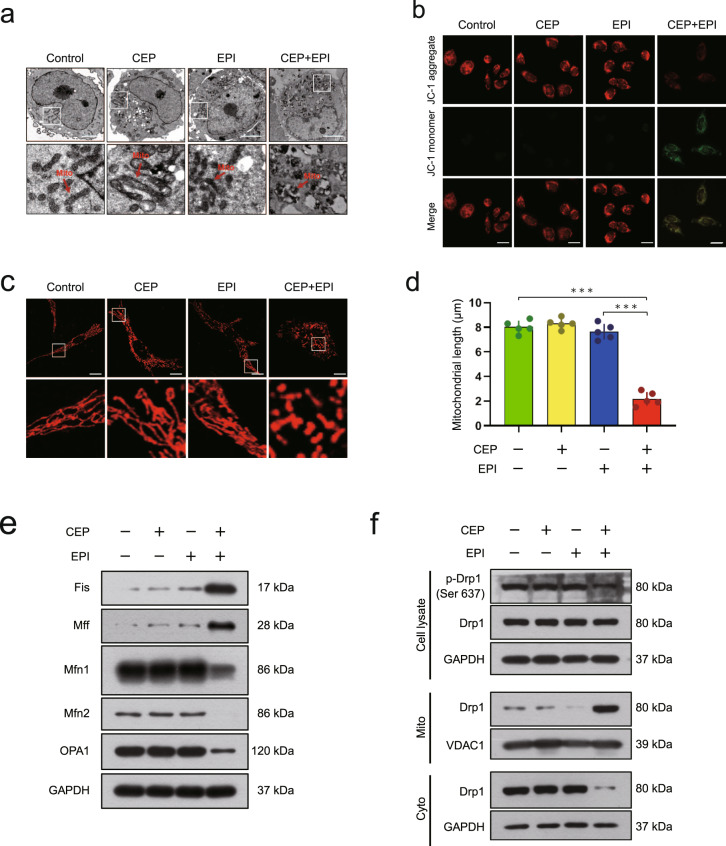
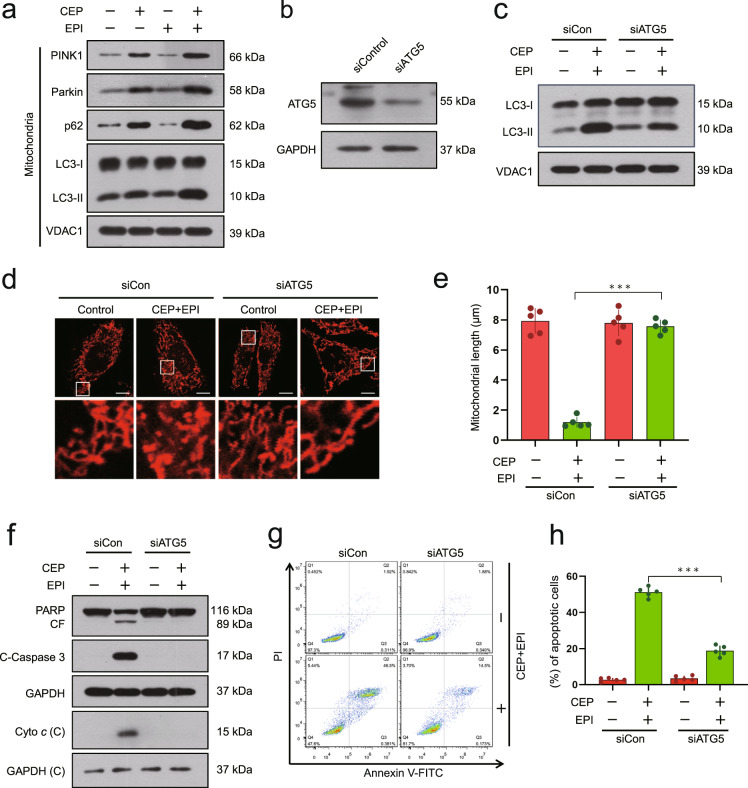
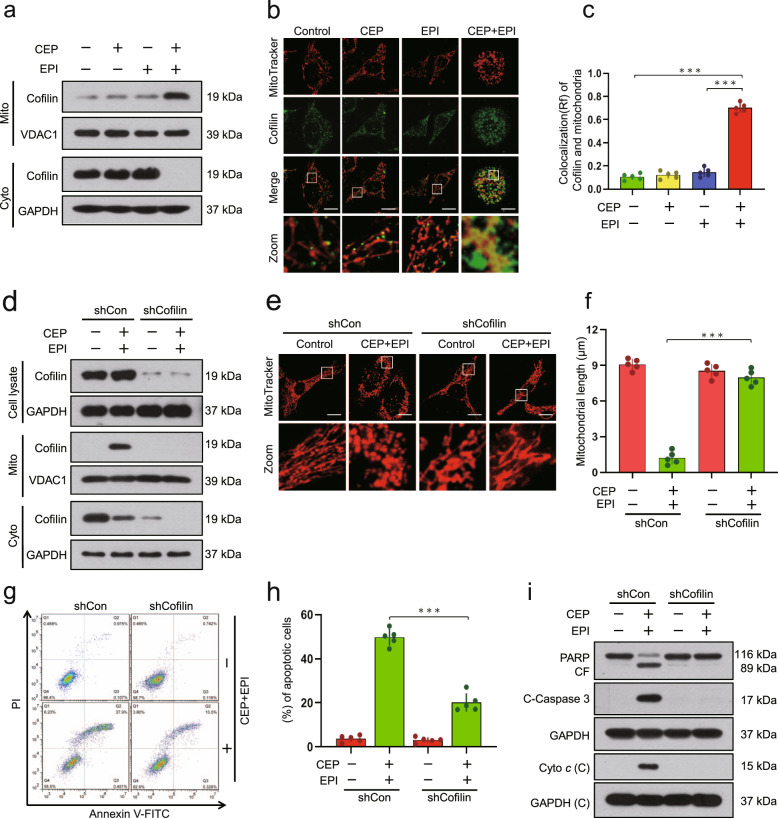
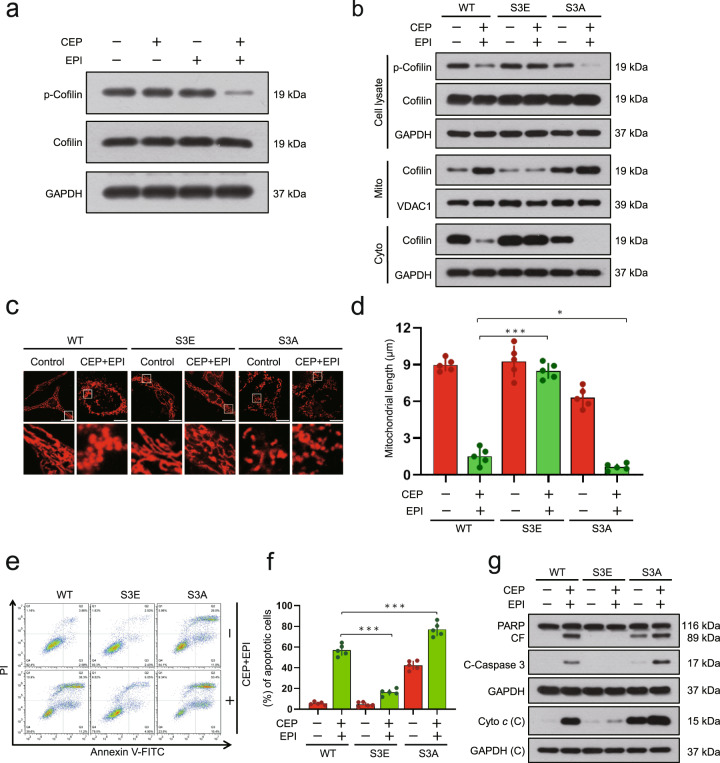
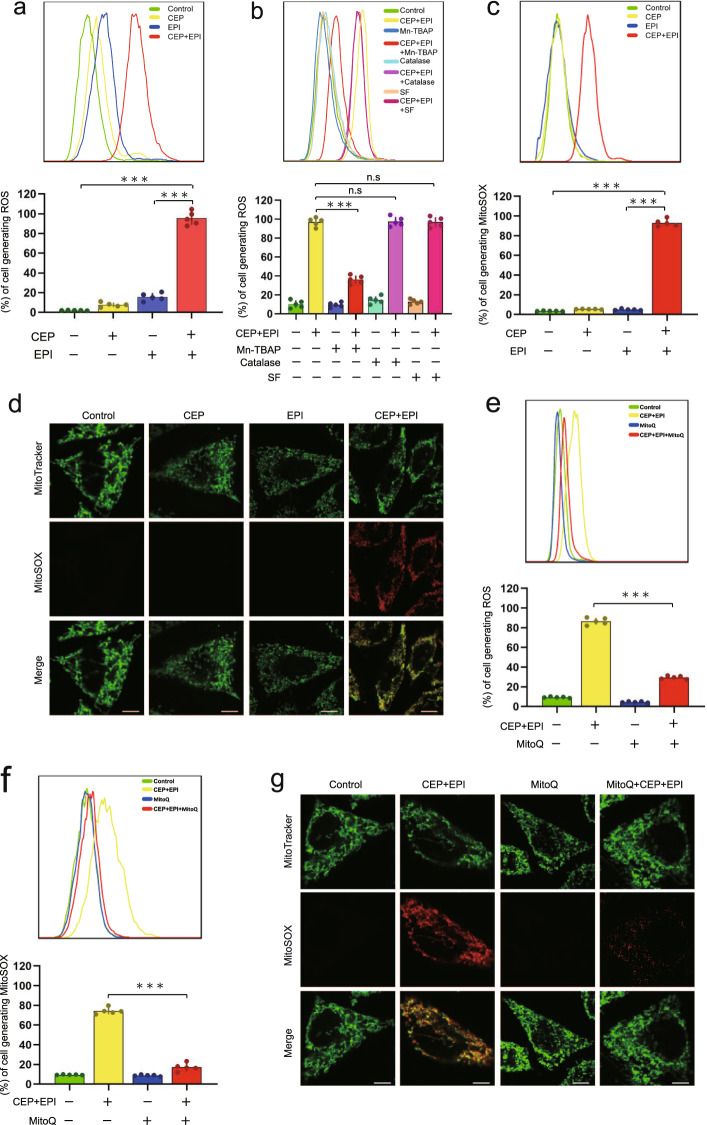
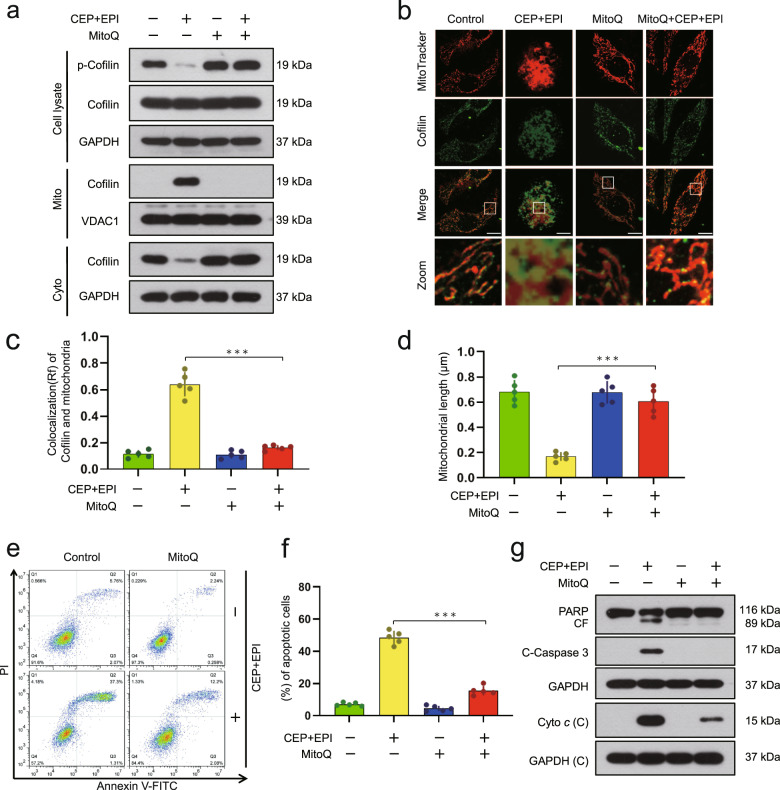
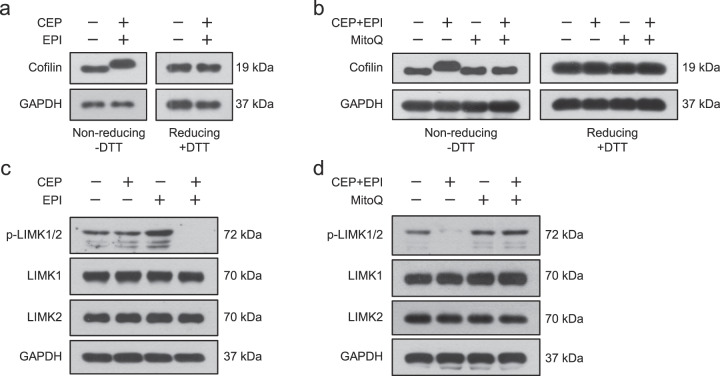
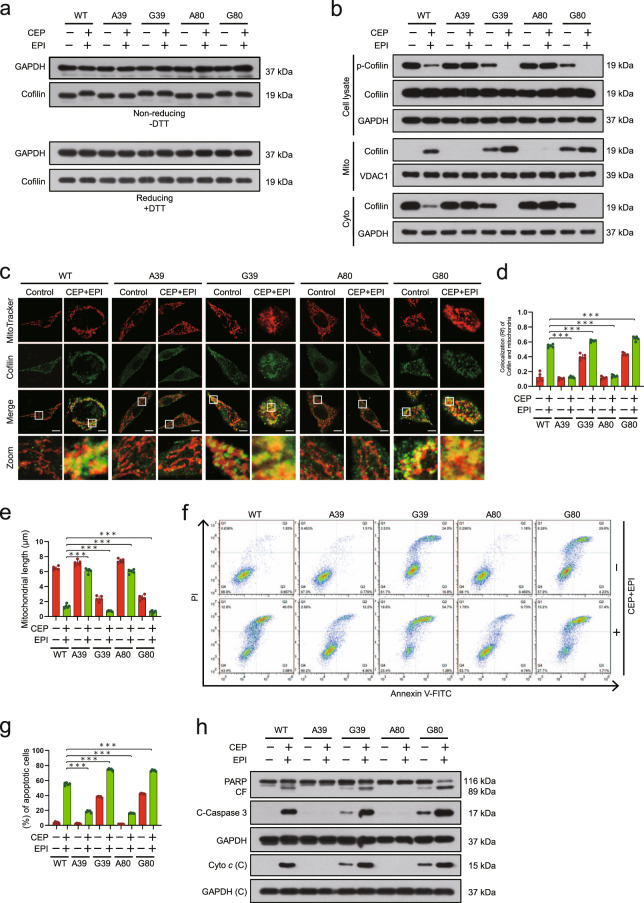
Inhibition of autophagy has been accepted as a promising therapeutic strategy in cancer, but its clinical application is hindered by lack of effective and specific autophagy inhibitors. We previously identified cepharanthine (CEP) as a novel autophagy inhibitor, which inhibited autophagy/mitophagy through blockage of autophagosome-lysosome fusion in human breast cancer cells. In this study we investigated whether and how inhibition of autophagy/mitophagy by cepharanthine affected the efficacy of chemotherapeutic agent epirubicin in triple negative breast cancer (TNBC) cells in vitro and in vivo. In human breast cancer MDA-MB-231 and BT549 cells, application of CEP (2 μM) greatly enhanced cepharanthine-induced inhibition on cell viability and colony formation. CEP interacted with epirubicin synergistically to induce apoptosis in TNBC cells via the mitochondrial pathway. We demonstrated that co-administration of CEP and epirubicin induced mitochondrial fission in MDA-MB-231 cells, and the production of mitochondrial superoxide was correlated with mitochondrial fission and apoptosis induced by the combination. Moreover, we revealed that co-administration of CEP and epirubicin markedly increased the generation of mitochondrial superoxide, resulting in oxidation of the actin-remodeling protein cofilin, which promoted formation of an intramolecular disulfide bridge between Cys39 and Cys80 as well as Ser3 dephosphorylation, leading to mitochondria translocation of cofilin, thus causing mitochondrial fission and apoptosis. Finally, in mice bearing MDA-MB-231 cell xenografts, co-administration of CEP (12 mg/kg, ip, once every other day for 36 days) greatly enhanced the therapeutic efficacy of epirubicin (2 mg/kg) as compared with administration of either drug alone. Taken together, our results implicate that a combination of cepharanthine with chemotherapeutic agents could represent a novel therapeutic strategy for the treatment of breast cancer.

Keywords: apoptosis; cepharanthine; cofilin; epirubicin; mitochondrial fission; mitochondrial superoxide; oxidative stress; triple negative breast cancer.


Conflict of interest statement

The authors declare no competing interest.

Figures

Fig. 1
Fig. 1. Cepharanthine increases sensitivity to epirubicin in vitro.
a MDA-MB-231 cells were treated with various concentrations of epirubicin (EPI) in the presence or absence of 2 μM cepharanthine (CEP) or 20 μM CQ for 48 h, and MTT assays were performed to assess cell proliferation. b The combination index (CI) values for each fraction affected were determined using commercially-available software (Calcusyn, Biosoft). CI values less than 1.0 correspond to synergistic interactions. c, d Colony formation was detected using a soft agar assay in MDA-MB-231 cells treated without or with CEP (2 μM) or EPI (0.1 μM) or combination of CEP/EPI. e, f Cells were treated without or with 0.1 μM EPI in the presence or absence of 2 μM CEP or 20 μM CQ for 48 h, and Annexin V-FITC/PI staining and flow cytometry were employed to determine apoptosis. g Total cellular extract and cytosol fractions were prepared and subjected to Western blot using antibodies against total PARP, cleaved-PARP (CF), cleaved caspase 3 (C-Caspase 3), and cytochrome c (Cyto c). GAPDH was used as loading controls. Data represented as mean ± SD (n = 5, ***P < 0.001, Student’s two-tailed unpaired t-tests).
Fig. 2
Fig. 2. Cepharanthine enhances the therapeutic efficacy of epirubicin in vivo.
Sixty-four BALB/c nude mice were inoculated subcutaneously with MDA-MB-231 cells and randomly divided into four groups (16 mice per group, 10 mice were used for determination of survival and 6 mice for determination of tumor volume and H&E, TUNEL, and immunohistochemistry analyses). a Comparison of the overall survival of mice between vehicle, cepharanthine, epirubicin and combination of cepharanthine/epirubicin (n = 10 mice per group). Statistical significance in survival was determined by log-rank test. ***P < 0.01, comparison between epirubicin and cepharanthine/epirubicin. b, c Tumor volumes were measured on the indicated days. Data represented as mean ± SD (n = 6, **P < 0.01, ***P < 0.001, ns not significant, Student’s two-tailed unpaired t-tests). d Body weight of mice was measured on the indicated days. e Representative images of H&E, TUNEL, and immunohistochemistry staining for determination of morphology, apoptosis and expression of C-caspase 3 in xenograft tumor sections. Scar bar, 50 µm.
Fig. 3
Fig. 3. Combination of cepharanthine/epirubicin induces mitochondrial fission.
MDA-MB-231 cells were treated without or with cepharanthine or epirubicin alone or combination of cepharanthine/epirubicin for 48 h. a Representative images of transmission electronic microscopy. b The mitochondrial membrane potential (MMP) was detected by JC-1 staining. c Mitochondrial morphology was determined by MitoTracker Red CMXRos staining and confocal microscopy. Scale bars, 10 μm. d Mitochondrial length was measured with ImageJ software. 50 cells of 5 independent experiments (mean ± SD, ***P < 0.001, Student’s two-tailed unpaired t-tests). e Western blot was performed to detect the expression of Fis1, MFF, Mfn1, Mfn2 and OPA1. GAPDH was used as loading control. f Whole cell lysates (Cell lysate), cytosolic (Cyto) and mitochondrial (Mito) fractions were prepared and subjected to Western blot by using antibody against Drp1 and phospho-Drp1. GAPDH and VDAC1 were used as loading control.
Fig. 4
Fig. 4. Excessive accumulation of mitophagosomes contributes to apoptosis induced by cepharanthine/epirubicin combination.
a MDA-MB-231 cells were treated with cepharanthine in the presence or absence of epirubicin for 48 h, after which the mitochondrial fractions were prepared and subjected to Western blot analysis using antibodies against p62, LC3-I/LC3-II, PINK1 and Parkin. VDAC1 was used as loading control. b Cells were transfected with control siRNA (siControl) or siATG5, and Western blot analysis was used to determine the expression of ATG5. GAPDH was used as loading control. For c–h, cells stably expressing siControl or siATG5 were treated with cepharanthine in the presence or absence of epirubicin for 48 h. c The mitochondrial fractions were prepared and subjected to Western blot using antibodies against LC3-I/LC3-II. VDAC1 was used as loading control. d Mitochondrial morphology was determined by MitoTracker Red CMXRos staining and confocal microscopy. Scale bars, 10 μm. e Mitochondrial length was measured with ImageJ software. 50 cells of 5 independent experiments. f Western blot was performed to detect the expression of PARP, cleaved-PARP (CF), C-caspase 3 and cytochrome c. g, h Apoptosis was determined by Annexin V-FITC/PI staining and flow cytometry. Data represented as mean ± SD (n = 5, ***P < 0.001, Student’s two-tailed unpaired t-tests).
Fig. 5
Fig. 5. Combination of cepharanthine/epirubicin causes translocation of cofilin to the mitochondria.
MDA-MB-231 cells were treated without or with cepharanthine or epirubicin alone or combination of cepharanthine/epirubicin for 48 h. a Cytosolic and mitochondrial fractions were prepared and subjected to Western blot using antibody against cofilin. GAPDH and VDAC1 were used as loading control. b Representative images of confocal microscopy which showed the colocalization of cofilin (green) and MitoTracker (red). Scale bars, 10 μm. c The Pearson’s correlation coefficient (R2) of cofilin and MitoTracker colocalization was from 50 cells of five independent experiments. For (d–i), MDA-MB-231 cells stably expressing Non-Target shRNA (shCon) or cofilin shRNA (shCofilin) were treated with or without combination of cepharanthine/epirubicin. d Whole cell lysates (Cell lysate), cytosolic (Cyto) and mitochondrial (Mito) fractions were prepared and subjected to Western blot by using antibody against cofilin. e Mitochondrial morphology was determined by MitoTracker Red CMXRos staining and confocal microscopy. Scale bars, 10 μm. f Mitochondrial length was measured with ImageJ software. 50 cells of 5 independent experiments. g, h Apoptosis was determined by Annexin V-FITC/PI staining and flow cytometry. i Western blot was performed to detect the expression of PARP, cleaved-PARP (CF), C-caspase 3 and cytochrome c. Data represented as mean ± SD (n = 5, ***P < 0.001, Student’s two-tailed unpaired t-tests).
Fig. 6
Fig. 6. Dephosphorylation of cofilin contributes to combination-mediated mitochondrial fission and apoptosis.
a MDA-MB-231 cells were treated without or with cepharanthine or epirubicin alone or combination of cepharanthine/epirubicin for 48 h, after which Western blot was employed to determine the levels of phospho-cofilin (p-Cofilin) and cofilin. For (bg), MDA-MB-231 cells stably expressing Cofilin-WT or Cofilin-S3E or Cofilin-S3A were treated without or with combination of cepharanthine/epirubicin. b Whole cell lysates (Cell lysate), cytosolic (Cyto) and mitochondrial (Mito) fractions were prepared and subjected to Western blot by using antibody against cofilin and phospho-cofilin. c Mitochondrial morphology was determined by MitoTracker Red CMXRos staining and confocal microscopy. Scale bars, 10 μm. d Mitochondrial length was measured with ImageJ software. 50 cells of 5 independent experiments. e, f Apoptosis was determined by Annexin V-FITC/PI staining and flow cytometry. g Western blot was performed to detect the expression of C-PARP, C-caspase 3 and cytochrome c. Data represented as mean ± SD (n = 5, *P < 0.05, ***P < 0.001, Student’s two-tailed unpaired t-tests).
Fig. 7
Fig. 7. Combination of cepharanthine/epirubicin induces mitochondrial oxidative stress.
a MDA-MB-231 cells were treated without or with cepharanthine or epirubicin alone or combination of cepharanthine/epirubicin for 48 h, after which ROS production was determined by DCFHDA staining and flow cytometry. b Cells were pretreated with antioxidants including as TBAP (200 μM), catalase (5000 U/mL), and sodium formate (SF, 2 mM) for 1 h, followed by treatment with combination of cepharanthine/epirubicin for 48 h, ROS production was determined by DCFHDA staining and flow cytometry. c, d Cells were treated in (a), mitochondrial superoxide production was determined by the fluorescent probes MitoSOX™ staining and flow cytometry. Scale bars, 10 μm. e, f Cells were pretreated with MitoQ (a mitochondrial targeted antioxidant), followed by treatment with combination of cepharanthine/epirubicin for 48 h, ROS and MitoSOX production was determined by DCFHDA or MitoSOX™ staining and flow cytometry. g The fluorescence intensity of mitochondrial superoxide as measured by MitoSOX and MitoTracker in cells treated without or with MitoQ or combination of cepharanthine/epirubicin. Scale bars, 10 μm. Data represented as mean ± SD (n = 5, ***P < 0.001, ns not significant, Student’s two-tailed unpaired t-tests).
Fig. 8
Fig. 8. Mitochondrial superoxide leads to dephosphorylation and mitochondrial translocation of cofilin.
MDA-MB-231 cells were treated without or with combination of cepharanthine/epirubicin in the presence or absence of MitoQ. a Whole cell lysates, cytosolic or mitochondrial fractions were prepared and subjected to Western blot using antibodies against phospho-cofilin (Ser3) and cofilin. b Representative images of confocal microscopy which showed the colocalization of cofilin (green) and MitoTracker (red). Scale bars, 10 μm. c The Pearson’s correlation coefficient (R2) of cofilin and MitoTracker colocalization was from 50 cells of five independent experiments. d Mitochondrial length was measured with ImageJ software. 50 cells of 5 independent experiments. e, f apoptosis was determined by Annexin V-FITC/PI staining and flow cytometry. g Western blot was performed to determine the expression of PARP, cleaved-PARP (CF), C-caspase 3 and cytochrome c. Data represented as mean ± SD (n = 5, ***P < 0.001, Student’s two-tailed unpaired t-tests).
Fig. 9
Fig. 9. Combination-mediated mitochondrial superoxide leads to oxidation of cofilin and inactivation of LIM kinase.
a MDA-MB-231 cells were treated without or with combination of cepharanthine/epirubicin, the expression of cofilin was analyzed either by nonreducing SDS-PAGE (left, DTT) or by reducing SDS-PAGE (right, +DTT). b Cells were treated without or with combination of cepharanthine/epirubicin in the presence or absence of MitoQ, the expression of cofilin was analyzed either by nonreducing SDS-PAGE (left, DTT) or by reducing SDS-PAGE (right, +DTT). c MDA-MB-231 cells were treated without or with cepharanthine or epirubicin alone or combination of cepharanthine/epirubicin for 48 h, after which Western blot was performed to determine the expression of phospho-LIMK1/2, LIMK1 and LIMK2. d Cells were treated without or with combination of cepharanthine/epirubicin in the presence or absence of MitoQ, the expression of phospho-LIMK1/2 was analyzed by Western blot.
Fig. 10
Fig. 10. Cys39 and Cys80 are key sites for combination-mediated dephosphorylation and mitochondrial translocation of cofilin.
MDA-MB-231 cells expressing either WT-cofilin or cysteine-to-glycine mutants of cofilin (C39G and C80G) or cysteine-to-Ala (C39A and C80A) were treated without or with combination of cepharanthine/epirubicin for 48 h. a The expression of cofilin was analyzed either by nonreducing SDS-PAGE (left, DTT) or by reducing SDS-PAGE (right, +DTT). b Whole cell lysates, cytosolic and mitochondrial fractions were prepared and subjected to Western blot by using antibodies against phospho-cofilin and cofilin. c Mitochondrial morphology was determined by MitoTracker Red CMXRos staining and confocal microscopy. Scale bars, 10 μm.  The Pearson’s correlation coefficient (R2) of cofilin and MitoTracker colocalization was from 50 cells of five independent experiments. e Mitochondrial length was measured with ImageJ software. 50 cells of 5 independent experiments. f, g apoptosis was determined by Annexin V-FITC/PI staining and flow cytometry. h Western blot was performed to determine the expression of PARP, cleaved-PARP (CF), C-caspase 3 and cytochrome c in cytosolic fraction. Data represented as mean ± SD (n = 5, ***P < 0.001, Student’s two-tailed unpaired t-tests).

Similar articles

Cited by

References

    1. Cheung EC, DeNicola GM, Nixon C, Blyth K, Labuschagne CF, Tuveson DA, et al. Dynamic ROS control by TIGAR regulates the initiation and progression of pancreatic cancer. Cancer Cell. 2020;37:168–82. - PMC - PubMed
    1. Cheng X, Geng F, Pan M, Wu X, Zhong Y, Wang C, et al. Targeting DGAT1 ameliorates glioblastoma by increasing fat catabolism and oxidative stress. Cell Metab. 2020;32:229–42. - PMC - PubMed
    1. Fendt SM, Lunt SY. Dynamic ROS regulation by TIGAR: balancing anti-cancer and pro-metastasis effects. Cancer Cell. 2020;37:141–2. - PubMed
    1. Chen Y, Gibson SB. Is mitochondrial generation of reactive oxygen species a trigger for autophagy? Autophagy. 2008;4:246–8. - PubMed
    1. Ishii N, Ishii T, Hartman PS. The role of the electron transport SDHC gene on lifespan and cancer. Mitochondrion. 2007;7:24–28. - PubMed

MeSH terms