. 2021 Aug 16;131(16):e148853.
doi: 10.1172/JCI148853.

MicroRNA-26a-3p rescues depression-like behaviors in male rats via preventing hippocampal neuronal anomalies

Affiliations

MicroRNA-26a-3p rescues depression-like behaviors in male rats via preventing hippocampal neuronal anomalies

Ye Li et al. J Clin Invest. .

Abstract

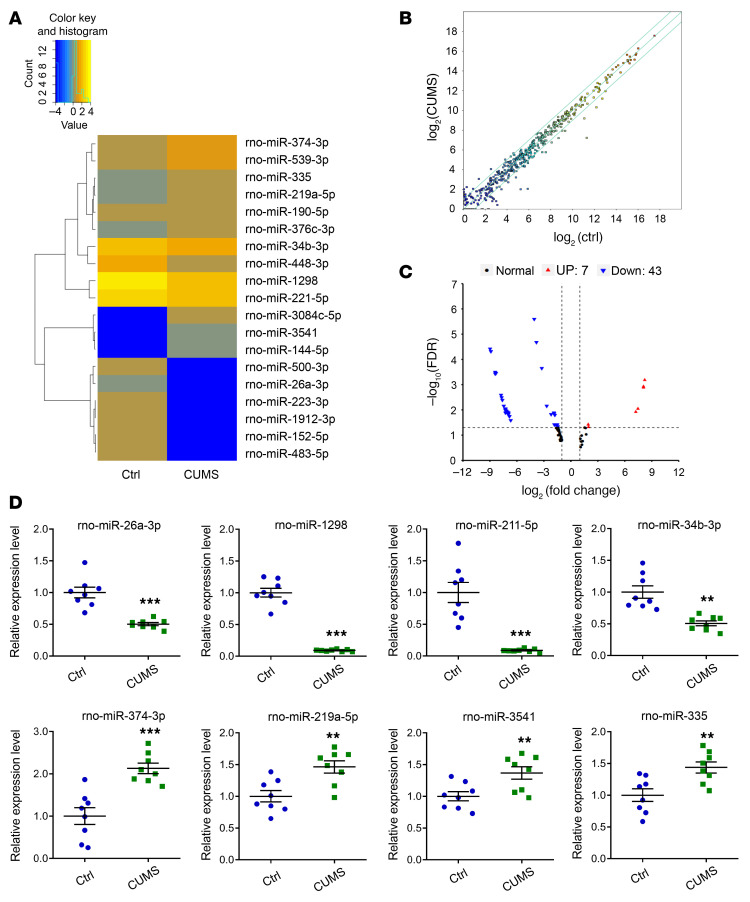
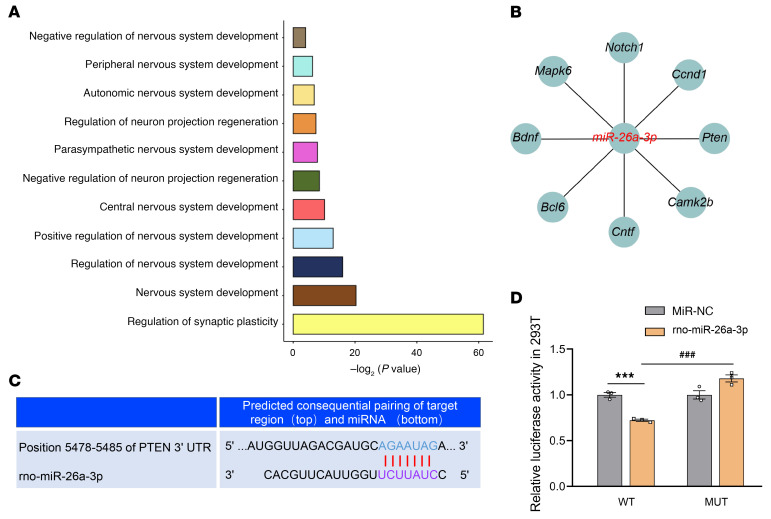
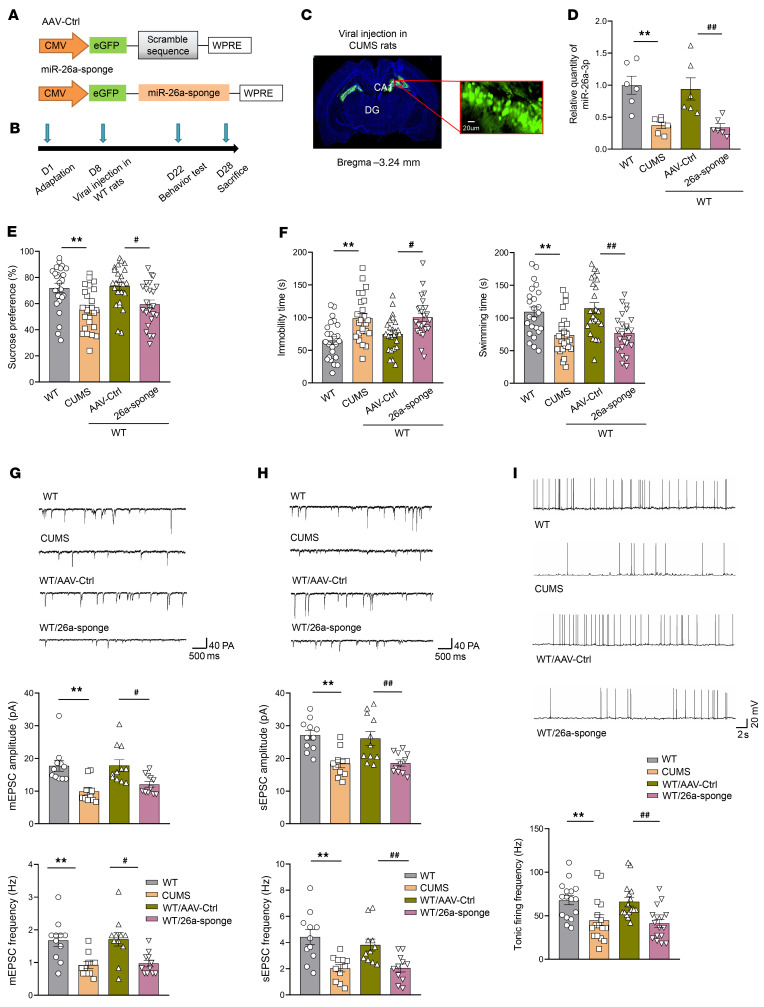
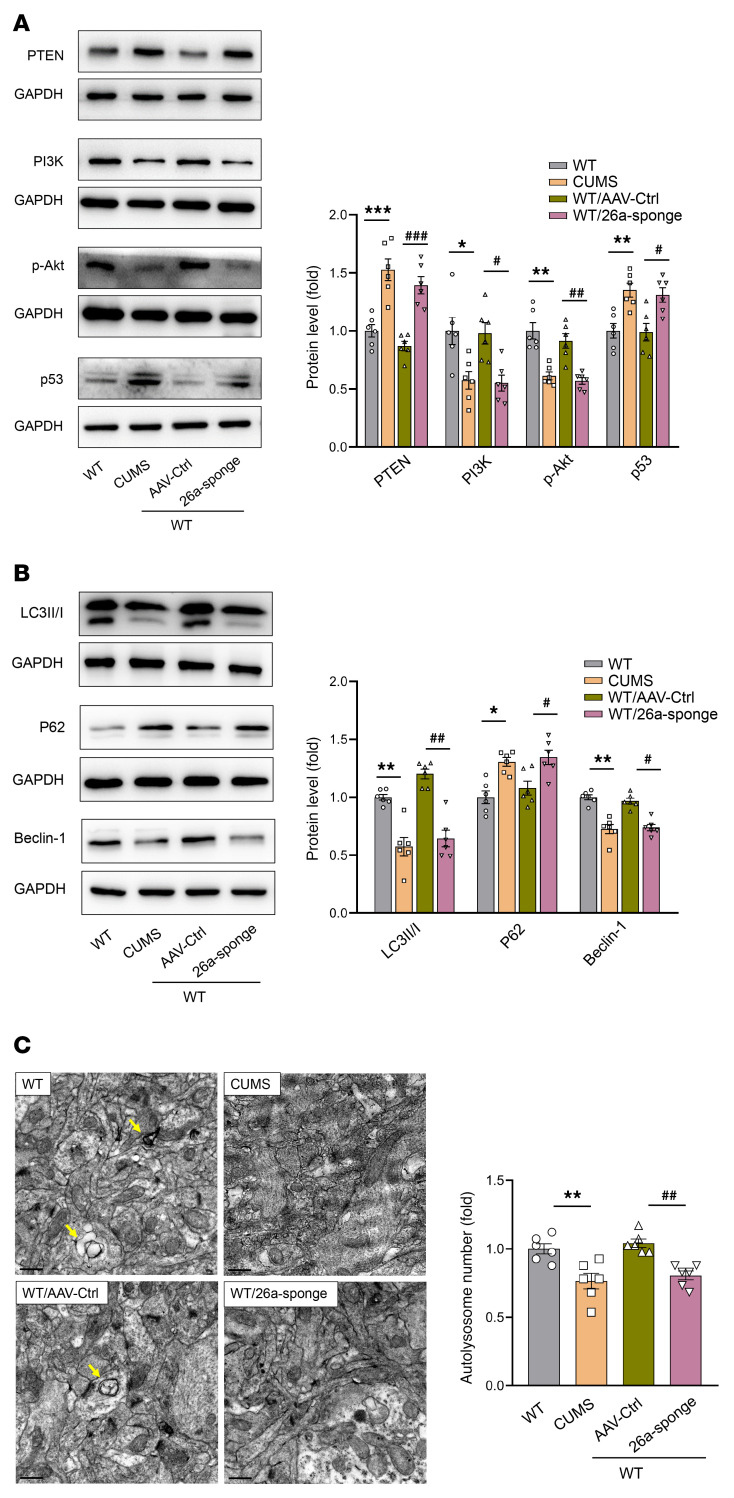
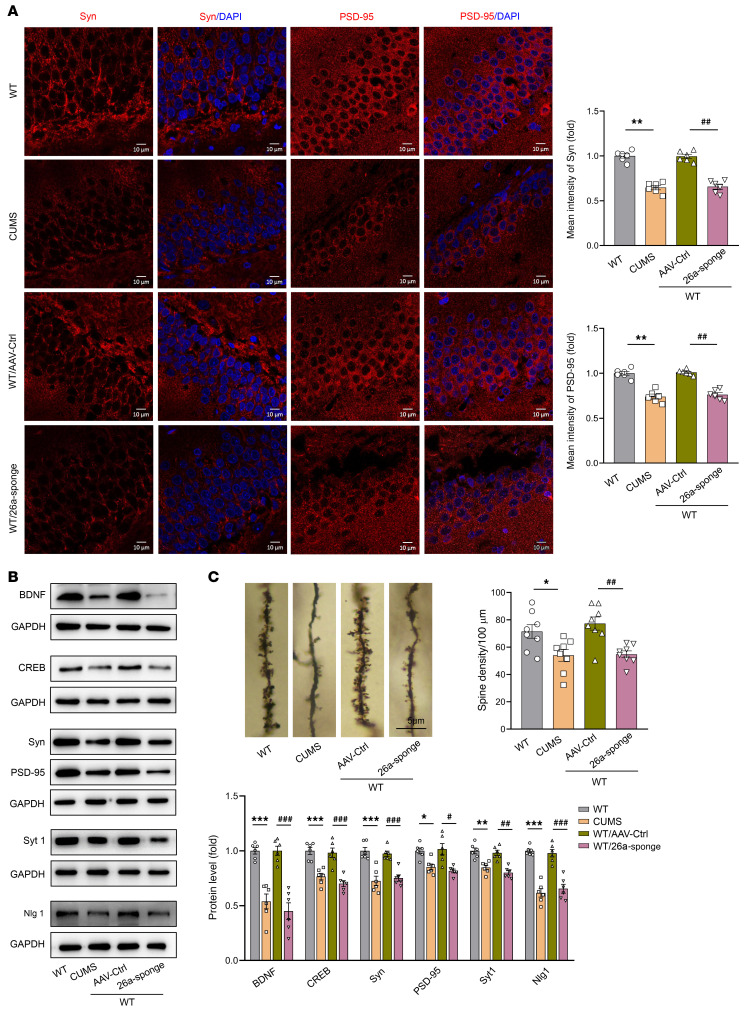
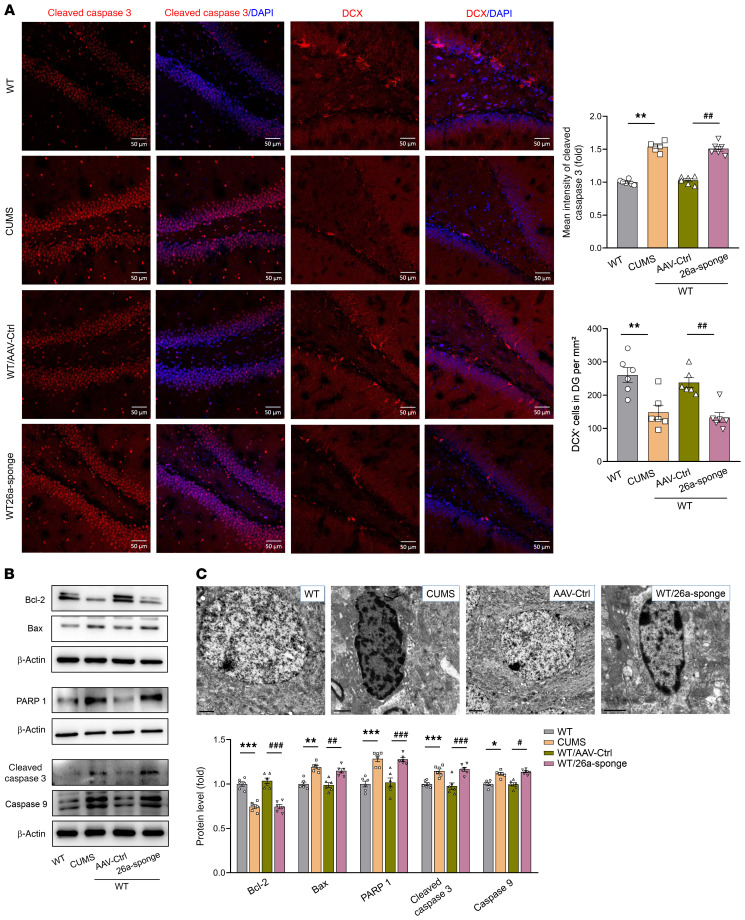
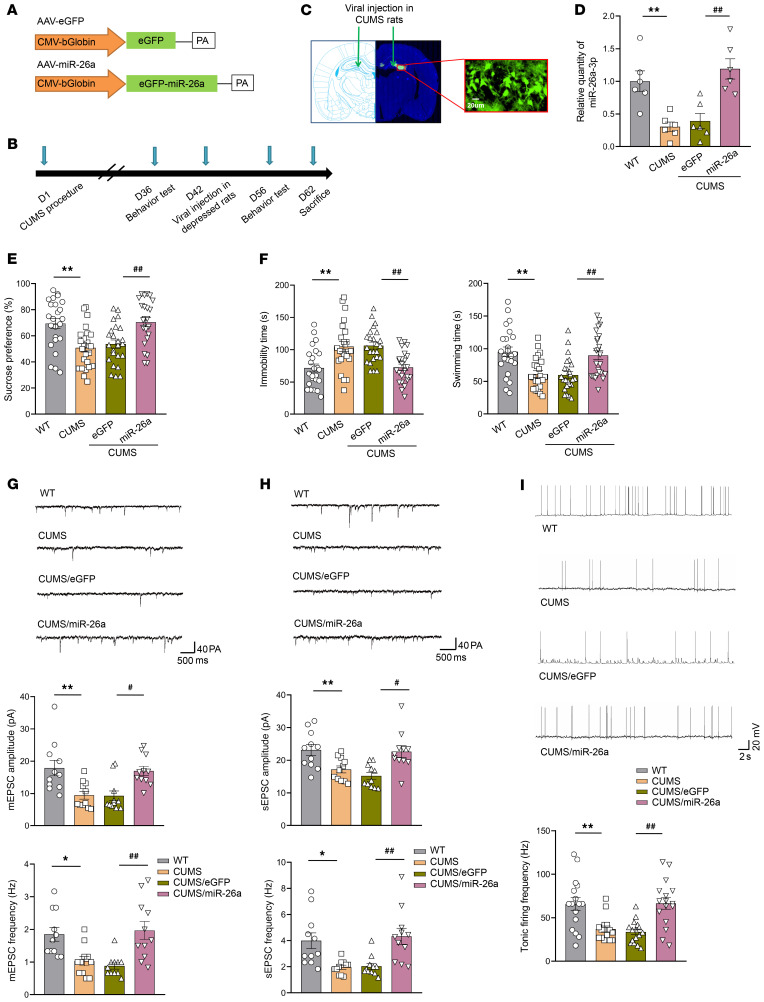
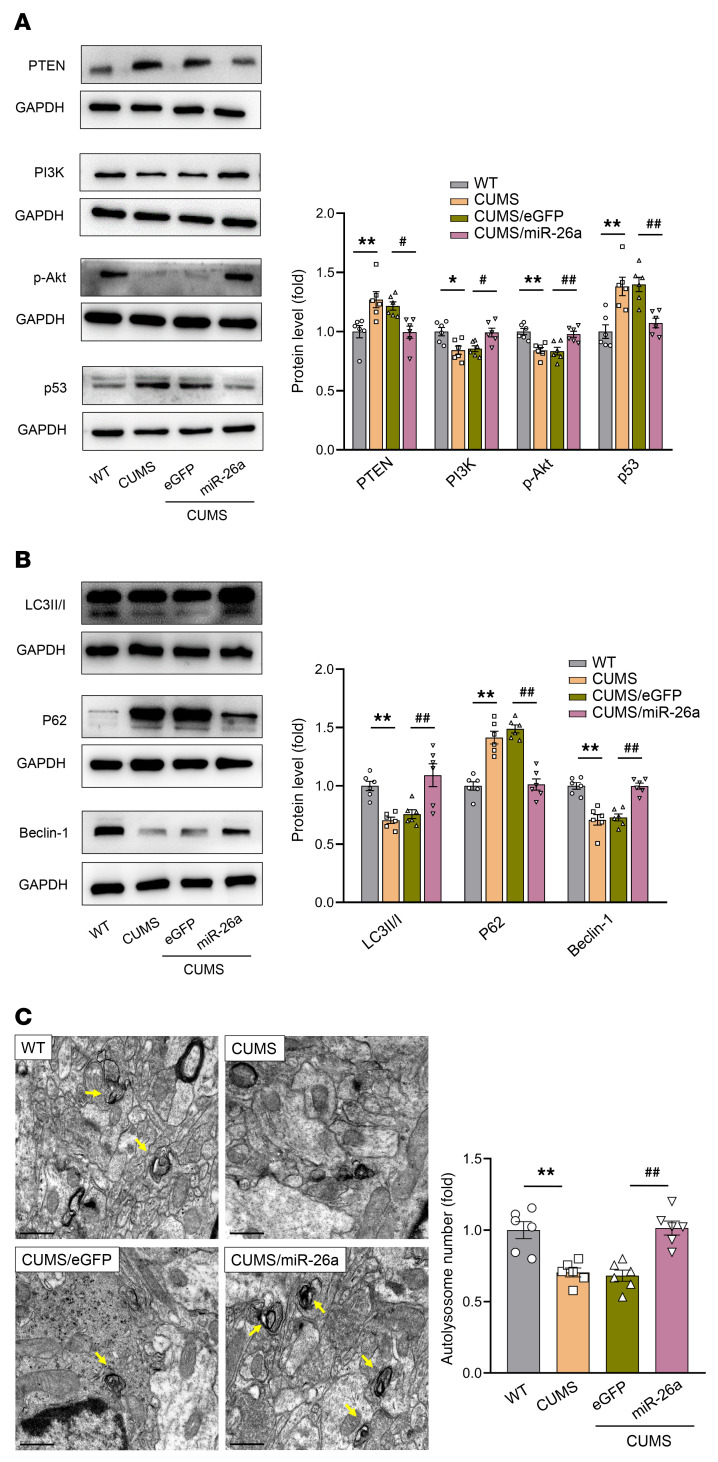
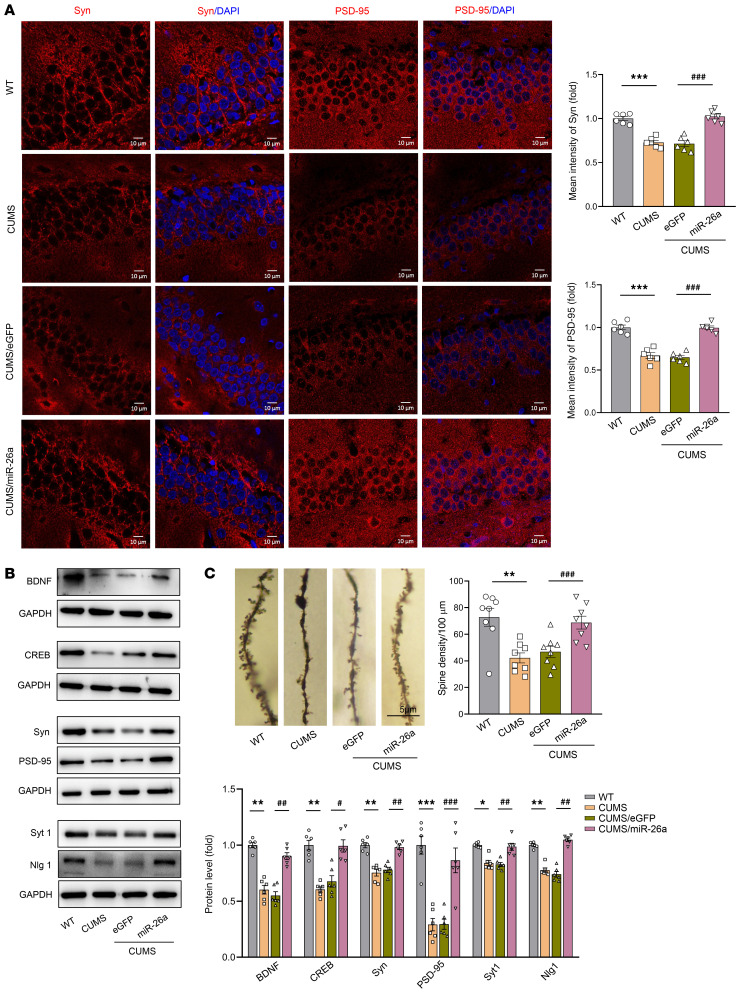
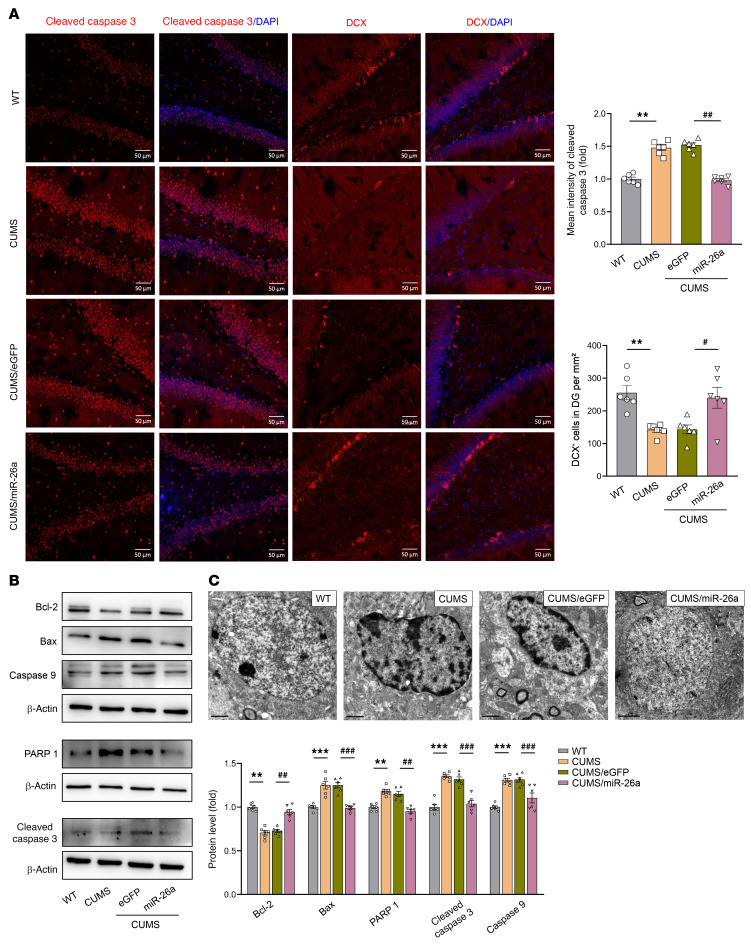
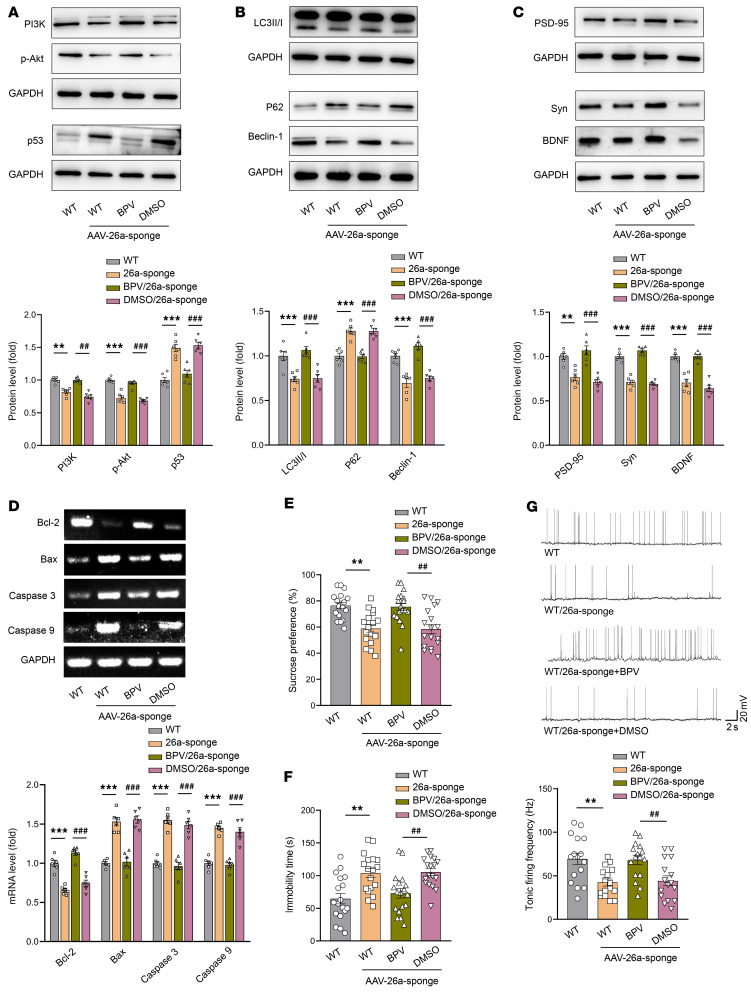
Depression is a neuropsychiatric disease associated with neuronal anomalies within specific brain regions. In the present study, we screened microRNA (miRNA) expression profiles in the dentate gyrus (DG) of the hippocampus and found that miR-26a-3p was markedly downregulated in a rat model of depression, whereas upregulation of miR-26a-3p within DG regions rescued the neuronal deterioration and depression-like phenotypes resulting from stress exposure, effects that appear to be mediated by the PTEN pathway. The knockdown of miR-26a-3p in DG regions of normal control rats induced depression-like behaviors, effects that were accompanied by activation of the PTEN/PI3K/Akt signaling pathway and neuronal deterioration via suppression of autophagy, impairments in synaptic plasticity, and promotion of neuronal apoptosis. In conclusion, these results suggest that miR-26a-3p deficits within the hippocampal DG mediated the neuronal anomalies contributing to the display of depression-like behaviors. This miRNA may serve as a potential therapeutic target for the treatment of depression.

Keywords: Behavior; Depression; Neuroscience; Synapses.


Conflict of interest statement

Conflict of interest: The authors have declared that no conflict of interest exists.

Figures

Figure 1
Figure 1. miRNA expression profiles of DG tissue derived from control and CUMS-induced depression groups.
(A) Representative heatmap of differential miRNA expression levels obtained by sequencing on the Illumina HiSeq 2500 platform. n = 3 rats per group. (B) Scatter plots were used to evaluate differences in the expression of miRNAs between the 2 groups. The miRNAs above the top green line and below the bottom green line indicate a greater than 2.0-fold change between the 2 groups. n = 3 rats per group. (C) Volcano plot indicating differential expression between the 2 groups. P less than 0.05 and fold change greater than 2 were considered statistically significant. n = 3 rats per group. (D) The expression levels of 8 miRNAs were validated by qPCR in DG tissues. n = 8 rats per group. Experiments were performed in triplicate with 3 biological replicates for all panels. Data are presented as mean ± SEM. **P < 0.01, ***P < 0.001 vs. control by Student’s t test. Ctrl, control.
Figure 2
Figure 2. Prediction and validation of target genes of miR-26a-3p and its signaling pathways.
(A) DAVID functional annotation for the miR-26a-3p target genes with horizontal axes showing −log2-transformed P values. (B) Bioinformatics prediction by DIANA-miRPath of 8 target genes of miR-26a-3p that appear to be related to pathways in depression. (C) Putative seed-matching sites between miR-26a-3p and PTEN. (D) Dual-luciferase reporter assay was performed to detect relative luciferase activities of WT and MUT PTEN reporters. n = 3 per group. Experiments repeated at least 3 times. Data are presented as mean ± SEM. ***P < 0.001 vs. WT + miR-NC; ###P < 0.001 vs. WT + rno-miR-26a-3p by 1-way ANOVA with post hoc Tukey’s correction. MUT, mutated.
Figure 3
Figure 3. Knockdown of miR-26a-3p within the DG induced depression-like behaviors in normal rats.
(A) Schematic of AAV vectors engineered to knock down miR-26a-3p or a vector control construct. (B) Experimental paradigm for virus injection and behavioral testing. D, day. (C) Illustration of bilateral virus injection site in the DG hippocampus. Scale bar: 20 μm. (D) Quantitative real-time PCR was used to validate the efficiency of miR-26a-3p knockdown. n = 6 rats per group. Three independent biological replicate experiments were performed for each group. (E) Knockdown of miR-26a-3p within the DG decreased sucrose consumption in the sucrose preference test and (F) increased immobility times and decreased swimming times of rats in the forced-swim test. n = 18 rats per group for behavioral test. Knockdown of miR-26a-3p in DG neurons produced changes in (G) mEPSCs, (H) sEPSCs, and (I) spontaneous burst activity. n = 10 cells from 6 rats per group in G and H; n = 16 cells from 6 rats per group in I. Electrophysiological recordings were repeated in at least 3 independent experiments. Data are presented as mean ± SEM. **P < 0.01 vs. WT; #P < 0.05, ##P < 0.01 vs. AAV-control (WT + AAV-control) by 1-way ANOVA with post hoc Tukey’s correction. Ctrl, control.
Figure 4
Figure 4. Knockdown of miR-26a-3p within the DG inhibited autophagy in normal rats.
(A) Knockdown of miR-26a-3p increased expression of PTEN and p53, accompanied by decreased expression of PI3K and phosphorylated Akt within the DG. n = 6 rats per group. (B) Knockdown of miR-26a-3p decreased LC3-II/LC3-I and beclin-1 expression, accompanied by increased expression of p62. n = 6 rats per group. (C) Knockdown of miR-26a-3p decreased the number of autolysosomes in the DG. n = 6 rats per group and at least 20 micrographs from 1 animal. Scale bars: 500 nm. Experiments were performed in triplicate with 3 biological replicates for all panels. Data are presented as mean ± SEM. *P < 0.05, **P < 0.01, ***P < 0.001 vs. WT; #P < 0.05, ##P < 0.01, ###P < 0.001 vs. AAV-control (WT + AAV-control) by 1-way ANOVA with Tukey’s post hoc correction. Ctrl, control.
Figure 5
Figure 5. Knockdown of miR-26a-3p within the DG of normal rats induced dysregulation of neuroplasticity.
(A) Representative confocal microscopic images showing expression of Syn and PSD-95 within the DG of different groups. Scale bars: 10 μm. n = 6 rats per group and at least 4–6 images from 1 animal. (B) Knockdown of miR-26a-3p decreased protein levels of neuroplasticity-related mediators in the DG. n = 6 rats per group. Western blotting results for Syn and PSD-95 were from the same samples and run in parallel in different gels. Three independent biological replicate experiments were performed. (C) Representative Golgi staining images and summary of data showing dendritic spines in DG neurons of different groups. Scale bar: 5 μm. n = 8 rats per group and at least 5 pyramidal neurons from 1 animal. Immunofluorescence and Golgi staining were repeated at least 3 times and quantitation was done for representative samples from each group. Data are presented as mean ± SEM. *P < 0.05, **P < 0.01, ***P < 0.01 vs. WT; #P < 0.05, ##P < 0.01, ###P < 0.001 vs. AAV-control (WT + AAV-control) by 1-way ANOVA with Tukey’s post hoc correction. Ctrl, control; Syt1, synaptotagmin 1; Nlg1, neuroligin 1.
Figure 6
Figure 6. Knockdown of miR-26a-3p within the DG of normal rats induced neuronal apoptosis.
(A) Representative confocal microscopic images showing expression of cleaved caspase-3 and DCX within the DG of different groups. Scale bars: 50 μm. n = 6 rats per group and at least 4–6 images from 1 animal. (B) Knockdown of miR-26a-3p increased protein levels of proapoptotic factors in the DG. n = 6 rats per group. Western blotting results were from the same samples and run in parallel in different gels. Three independent biological replicate experiments were performed. (C) Representative electron micrographs showing nuclear chromatin abnormalities in DG neurons of different groups. Scale bars: 1 μm. n = 6 per group and at least 5 pyramidal neurons from 1 animal. Immunofluorescence and electron microscopy experiments were repeated at least 3 times and quantitation was done for representative samples from each group. Data are presented as mean ± SEM. *P < 0.05, **P < 0.01, ***P < 0.001 vs. WT; #P < 0.05, ##P < 0.01, ###P < 0.001 vs. AAV-control (WT + AAV-control) by 1-way ANOVA with Tukey’s post hoc correction. Ctrl, control.
Figure 7
Figure 7. Overexpression of miR-26a-3p in the DG of CUMS rats reverses depression-like symptoms produced by CUMS exposure.
(A) Schematic of AAV-miR-26a-3p vector used to overexpress miR-26a-3p. (B) Experimental paradigm for CUMS, virus injection, and behavioral testing. (C) Representative site of virus injection in the DG. Scale bar: 20 μm. (D) Quantitative real-time PCR showing efficiency of miR-26a-3p overexpression in DG regions. n = 6 rats per group. Three independent biological replicate experiments were performed for each group. (E) Overexpression of miR-26a-3p in the DG of CUMS rats increased sucrose consumption in the sucrose preference test and (F) decreased immobility times and increased swimming times in the forced-swim test. n = 18 rats per group for behavioral test. Overexpression of miR-26a-3p in DG neurons produced changes in (G) mEPSCs, (H) sEPSCs, and (I) spontaneous burst activity. n = 11 cells from 6 rats per group in G and H; n = 16 cells from 6 rats per group in I. Electrophysiological recordings were repeated in at least 3 independent experiments. Data are presented as mean ± SEM. *P < 0.05, **P < 0.01 vs. WT; #P < 0.05, ##P < 0.01 vs. eGFP control (CUMS + AAV-eGFP) by 2-way ANOVA with Tukey’s post hoc correction.
Figure 8
Figure 8. Overexpression of miR-26a-3p in the DG of CUMS rats restored the attenuation in autophagy resulting from CUMS exposure.
(A) Overexpression of miR-26a-3p in CUMS rats decreased expression of PTEN and p53 and increased expression of PI3K and phosphorylated Akt within the DG. n = 6 rats per group. (B) Overexpression of miR-26a-3p increased LC3-II/LC3-I and beclin-1 expression and decreased expression of p62 in CUMS rats. n = 6 rats per group. (C) Overexpression of miR-26a-3p in the DG of CUMS rats increased the number of autolysosomes. Scale bars: 500 nm. n = 6 rats per group with at least 20 micrographs from 1 animal. Experiments were performed in triplicate with 3 biological replicates for all panels. Data are presented as mean ± SEM. *P < 0.05, **P < 0.01 vs. WT; #P < 0.05, ##P < 0.01 vs. eGFP control (CUMS + AAV-eGFP) by 2-way ANOVA with Tukey’s post hoc correction.
Figure 9
Figure 9. Overexpression of miR-26a-3p in the DG of CUMS rats restored the dysregulation of neuroplasticity resulting from CUMS exposure.
(A) Representative confocal microscopic images showing the expression levels of Syn and PSD-95 within the DG. Scale bars: 10 μm. n = 6 rats per group and at least 4–6 images from 1 animal. (B) Overexpression of miR-26a-3p increased protein levels of neuroplasticity-related mediators in CUMS rats. n = 6 rats per group. Western blotting results were from the same samples and run in parallel in different gels. Independent biological replicate experiments were repeated 3 times. (C) Representative images and summary of data showing dendritic spines in DG neurons. Scale bar: 5 μm. n = 8 rats per group and at least 5 pyramidal neurons from 1 animal. Immunofluorescence and Golgi staining were repeated at least 3 times and quantitation was done for representative samples from each group. Data are presented as mean ± SEM. *P < 0.05, **P < 0.01, *** P < 0.001 vs. WT; #P < 0.05, ##P < 0.01, ###P < 0.001 vs. eGFP control (CUMS + AAV-eGFP) by 2-way ANOVA with Tukey’s post hoc correction. Syt1, synaptotagmin 1; Nlg1, neuroligin 1.
Figure 10
Figure 10. Overexpression of miR-26a-3p within the DG of CUMS rats suppressed neuronal apoptosis resulting from CUMS exposure.
(A) Representative confocal microscopic images showing expression of cleaved caspase-3 and DCX within the DG. Scale bars: 50 μm. n = 6 rats per group and at least 4–6 images from 1 animal. (B) Overexpression of miR-26a-3p decreased protein levels of proapoptotic factors in CUMS rats. n = 6 rats per group. Western blotting results of Bcl-2, Bax, and caspase-9 were from the same samples and run in parallel in different gels. Independent biological replicate experiments were repeated 3 times. (C) Representative electron micrographs showing nuclear chromatin abnormalities in DG neurons. Scale bars: 1 μm. n = 4 rats per group and at least 20 micrographs from 1 animal. Immunofluorescence and electron microscopy experiments were repeated at least 3 times and quantitation was done for representative samples from each group. Data are presented as mean ± SEM. **P < 0.01, ***P < 0.001 vs. WT; #P < 0.05, ##P < 0.01, ###P < 0.001 vs. eGFP control (CUMS + AAV-eGFP) by 2-way ANOVA with Tukey’s post hoc correction.
Figure 11
Figure 11. PTEN inhibition attenuated neuronal and behavioral anomalies resulting from miR-26a-3p deficits in the DG.
(A) bpV(pic) treatment increased expression of PI3K and phosphorylated Akt and decreased p53 expression levels in miR-26a-3p–knockdown rats. Western blotting results of PI3K and p-Akt were from the same samples and run in parallel in different gels. n = 6 rats per group with 3 independent biological replicate experiments. (B) bpV(pic) treatment increased LC3-II/LC3-I and beclin-1 expression, and decreased expression of p62 in miR-26a-3p–knockdown rats. Western blotting results for p62 and beclin-1 were from the same samples and run in parallel in different gels. n = 6 rats per group with 3 independent biological replicate experiments. (C) bpV(pic) treatment increased protein levels of BDNF, PSD-95, and Syn within the DG of miR-26a-3p–knockdown rats. Western blotting results for Syn and BDNF were from the same samples and run in parallel in different gels. n = 6 per rats group with 3 independent biological replicate experiments. (D) bpV(pic) treatment decreased mRNA levels of Bax, caspase-3, and caspase-9, and increased Bcl-2 mRNA levels in miR-26a-3p–knockdown rats. n = 6 rats per group with 3 independent biological replicate experiments. (E) bpV(pic) treatment in miR-26a-3p–knockdown rats increased sucrose consumption in the sucrose preference test and (F) decreased immobility times and increased swimming times in the forced-swim test. (G) bpV(pic) treatment in DG neurons produced changes in spontaneous burst activity. n = 16 rats per group. Each data point represents 1 animal. Electrophysiological recordings were repeated at least 3 times. Data are presented as mean ± SEM. n = 18 rats per group in behavioral tests. **P < 0.01, ***P < 0.001 vs. WT; ##P < 0.01, ###P < 0.001 vs. AAV-26a-sponge (WT + AAV-miR-26a-sponge) by 2-way ANOVA with Tukey’s post hoc correction.

Similar articles

Cited by

References

    1. Oh DH, et al. Neuropathological abnormalities of astrocytes, GABAergic neurons, and pyramidal neurons in the dorsolateral prefrontal cortices of patients with major depressive disorder. Eur Neuropsychopharmacol. 2012;22(5):330–338. doi: 10.1016/j.euroneuro.2011.09.001. - DOI - PubMed
    1. Stockmeier CA, et al. Cellular changes in the postmortem hippocampus in major depression. Biol Psychiatry. 2004;56(9):640–650. doi: 10.1016/j.biopsych.2004.08.022. - DOI - PMC - PubMed
    1. Boldrini M, et al. Hippocampal granule neuron number and dentate gyrus volume in antidepressant-treated and untreated major depression. Neuropsychopharmacology. 2013;38(6):1068–1077. doi: 10.1038/npp.2013.5. - DOI - PMC - PubMed
    1. Krishnan V, Nestler EJ. The molecular neurobiology of depression. Nature. 2008;455(7215):894–902. doi: 10.1038/nature07455. - DOI - PMC - PubMed
    1. Bastos AG, et al. The efficacy of long-term psychodynamic psychotherapy, fluoxetine and their combination in the outpatient treatment of depression. Psychother Res. 2015;25(5):612–624. doi: 10.1080/10503307.2014.935519. - DOI - PubMed

Publication types

MeSH terms