

Microglia RAGE exacerbates the progression of neurodegeneration within the SOD1G93A murine model of amyotrophic lateral sclerosis in a sex-dependent manner
- PMID: 34130712
- PMCID: PMC8207569
- DOI: 10.1186/s12974-021-02191-2
Microglia RAGE exacerbates the progression of neurodegeneration within the SOD1G93A murine model of amyotrophic lateral sclerosis in a sex-dependent manner
Abstract
Background: Burgeoning evidence highlights seminal roles for microglia in the pathogenesis of neurodegenerative diseases including amyotrophic lateral sclerosis (ALS). The receptor for advanced glycation end products (RAGE) binds ligands relevant to ALS that accumulate in the diseased spinal cord and RAGE has been previously implicated in the progression of ALS pathology.
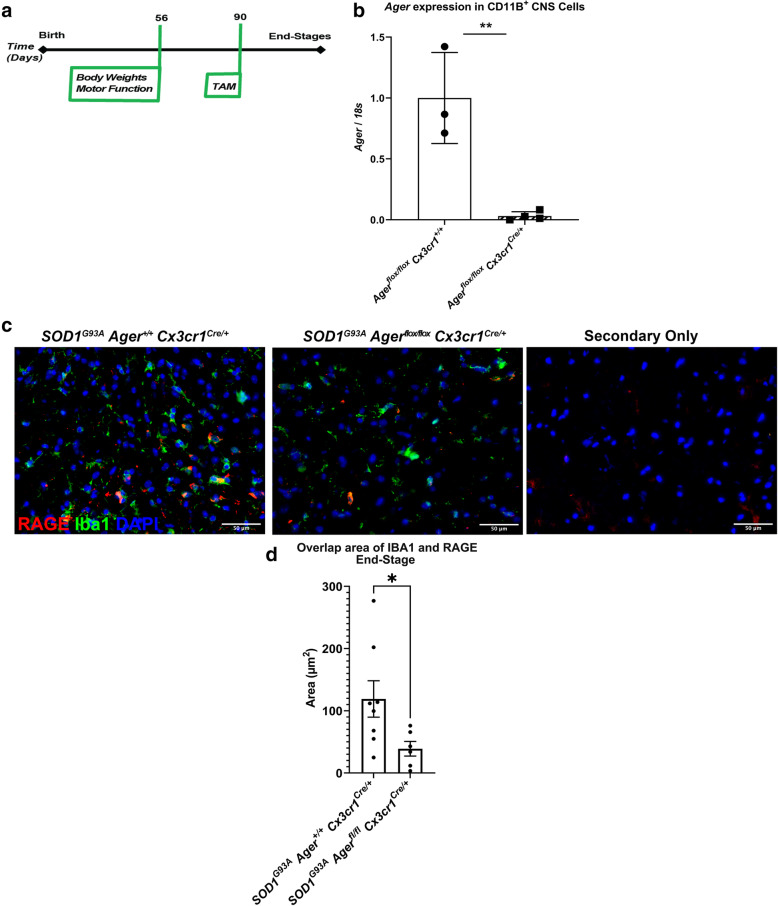
Methods: We generated a novel mouse model to temporally delete Ager from microglia in the murine SOD1G93A model of ALS. Microglia Ager deficient SOD1G93A mice and controls were examined for changes in survival, motor function, gliosis, motor neuron numbers, and transcriptomic analyses of lumbar spinal cord. Furthermore, we examined bulk-RNA-sequencing transcriptomic analyses of human ALS cervical spinal cord.
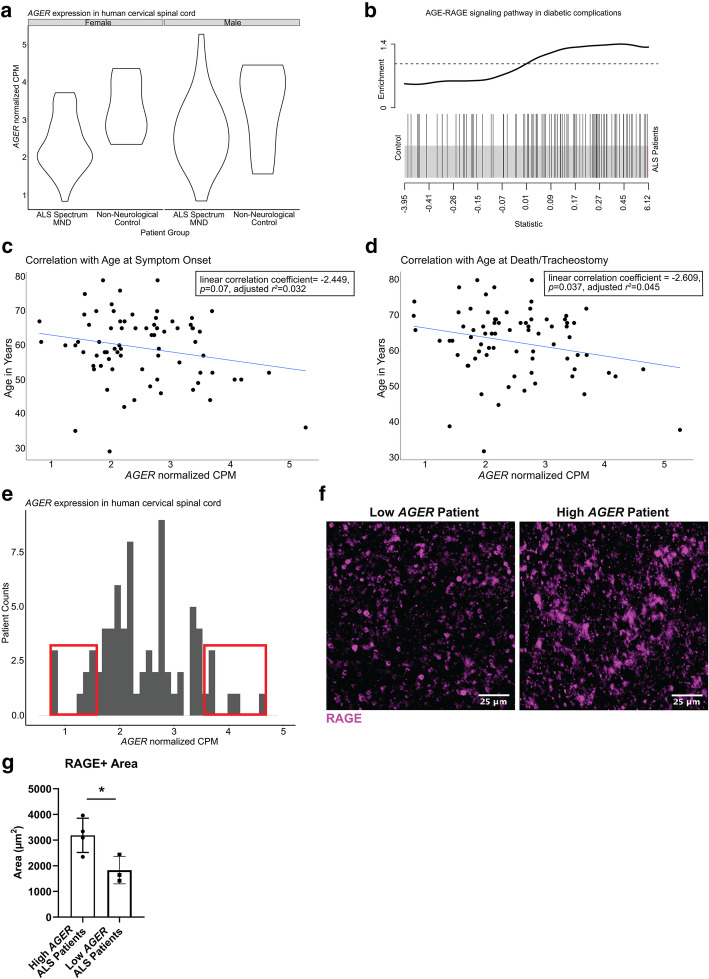
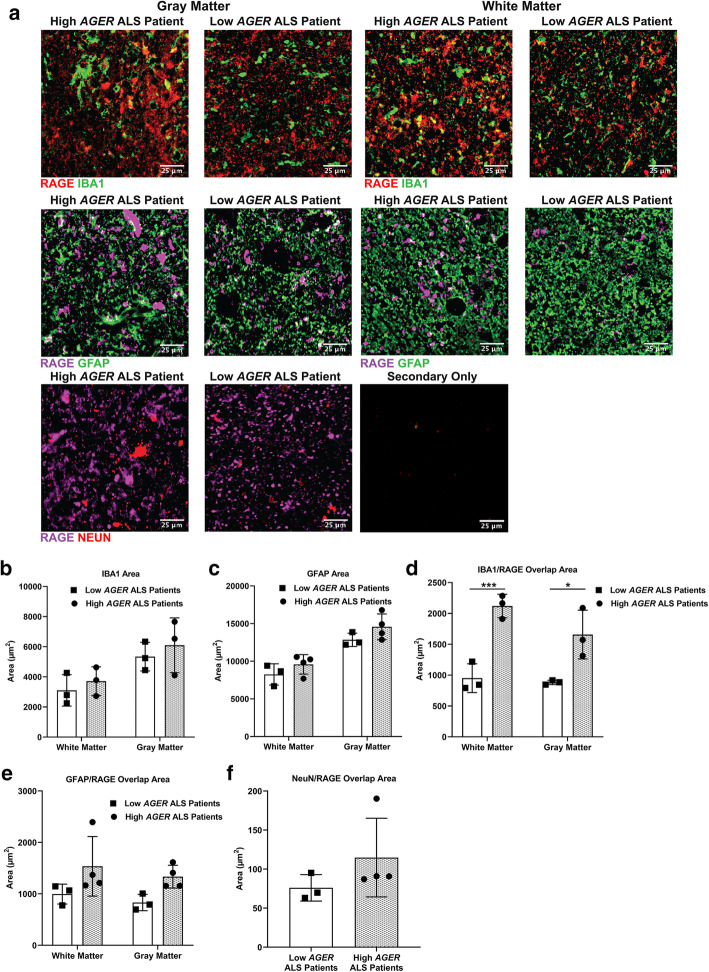
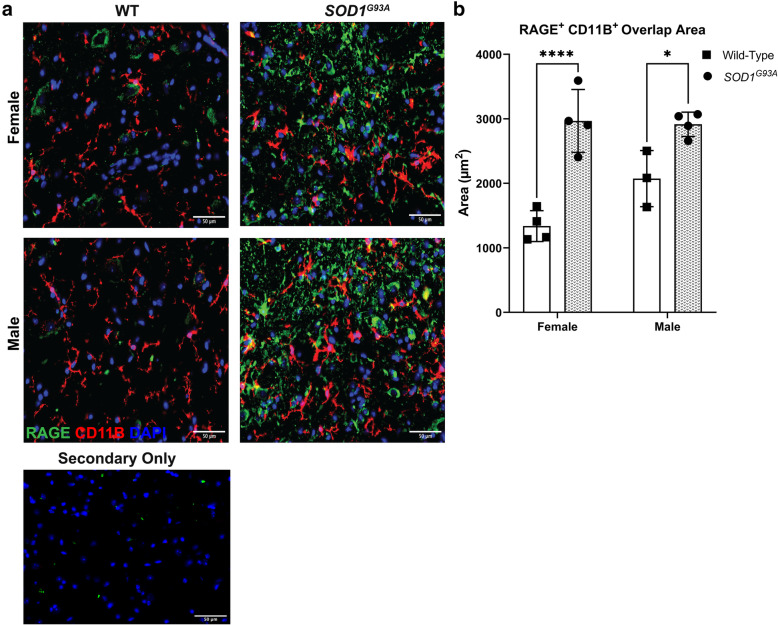
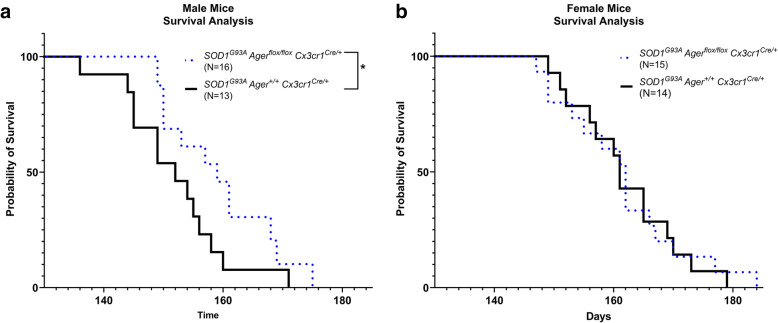
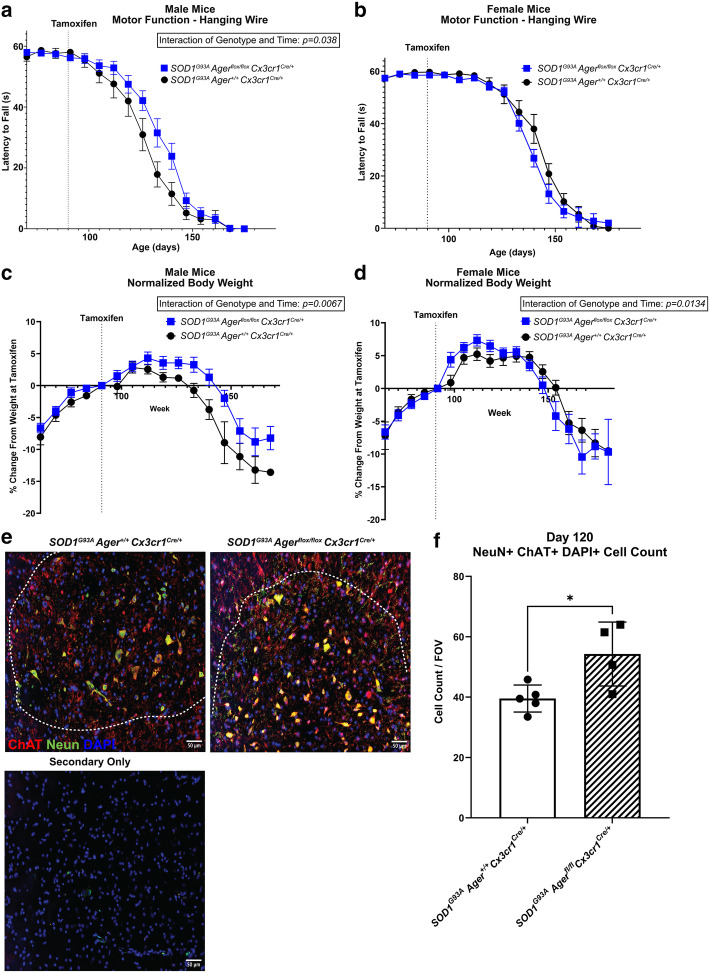
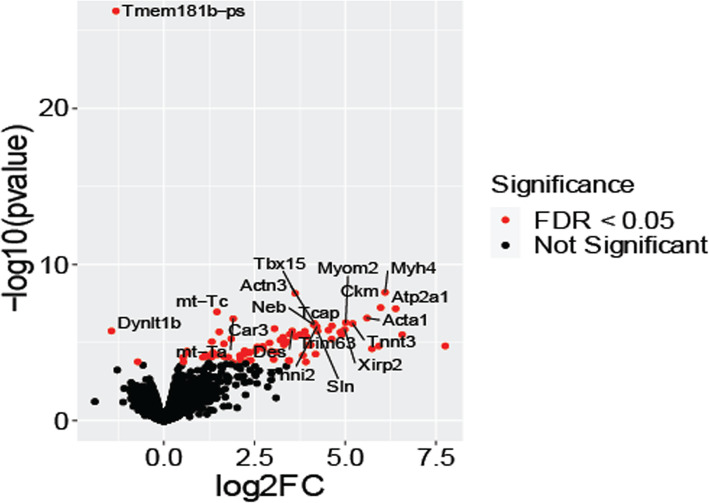
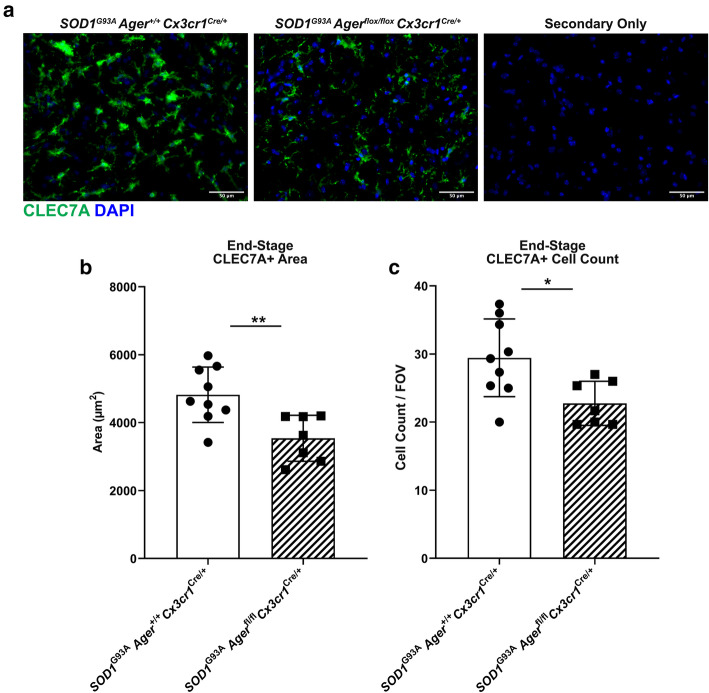
Results: Transcriptomic analysis of human cervical spinal cord reveals a range of AGER expression in ALS patients, which was negatively correlated with age at disease onset and death or tracheostomy. The degree of AGER expression related to differential expression of pathways involved in extracellular matrix, lipid metabolism, and intercellular communication. Microglia display increased RAGE immunoreactivity in the spinal cords of high AGER expressing patients and in the SOD1G93A murine model of ALS vs. respective controls. We demonstrate that microglia Ager deletion at the age of symptomatic onset, day 90, in SOD1G93A mice extends survival in male but not female mice. Critically, many of the pathways identified in human ALS patients that accompanied increased AGER expression were significantly ameliorated by microglia Ager deletion in male SOD1G93A mice.
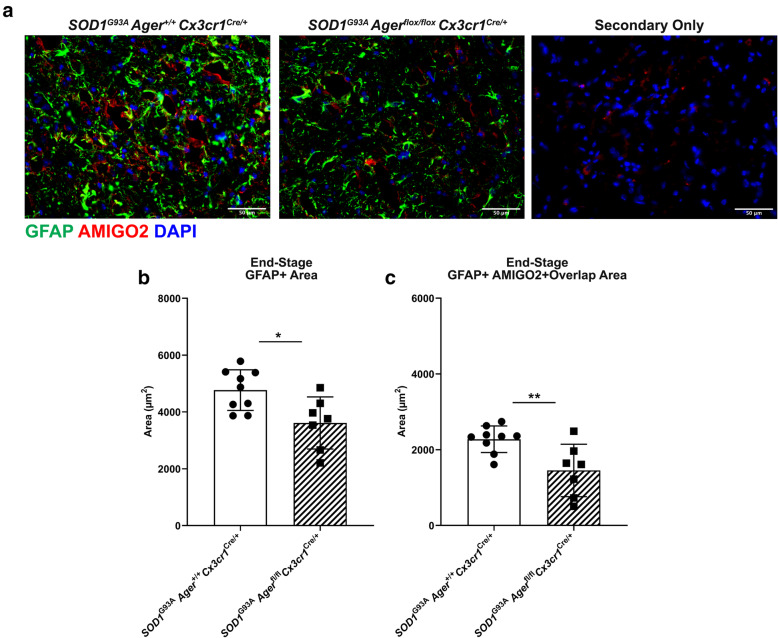
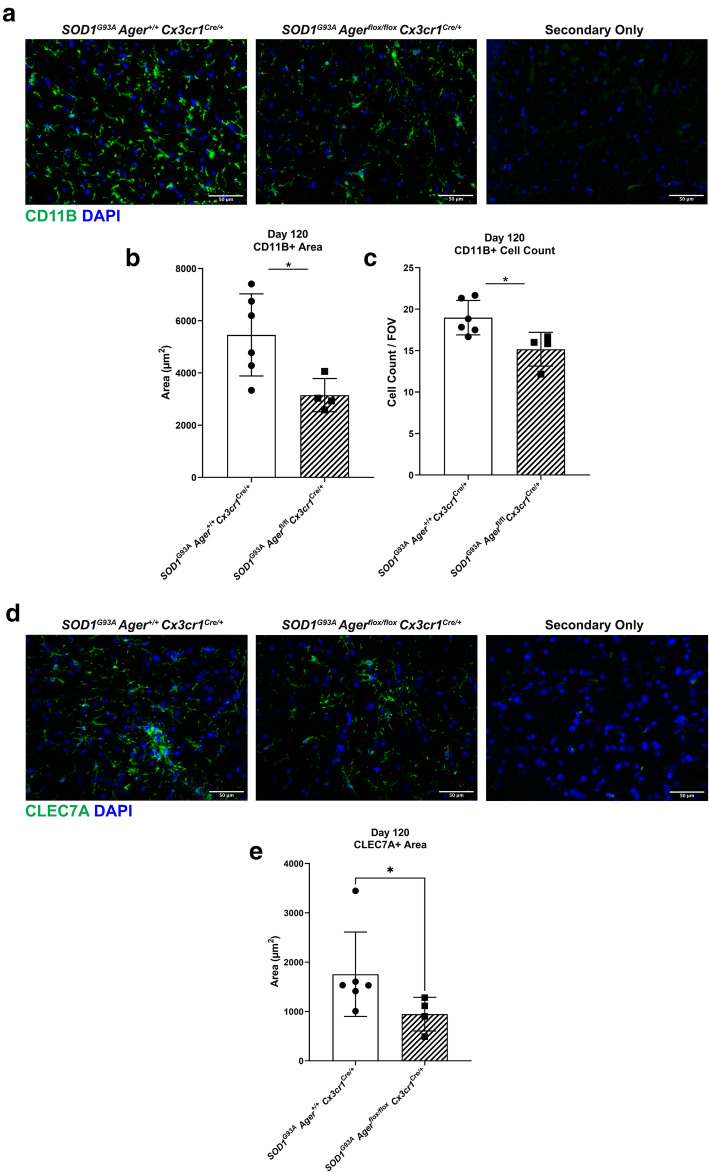
Conclusions: Our results indicate that microglia RAGE disrupts communications with cell types including astrocytes and neurons, intercellular communication pathways that divert microglia from a homeostatic to an inflammatory and tissue-injurious program. In totality, microglia RAGE contributes to the progression of SOD1G93A murine pathology in male mice and may be relevant in human disease.
Keywords: ALS; Astrocytes; Macrophage; Microglia; Neurodegeneration; RAGE.
Conflict of interest statement
A.M.S is an inventor on awarded (US 9,353,3078, US 9364472) and pending (US 16/094270, Europe 177864360.0) patent applications assigned to NYU Grossman Medical Center.
Figures
Similar articles
-
Absence of Receptor for Advanced Glycation End Product (RAGE) Reduces Inflammation and Extends Survival in the hSOD1G93A Mouse Model of Amyotrophic Lateral Sclerosis.Mol Neurobiol. 2020 Oct;57(10):4143-4155. doi: 10.1007/s12035-020-02019-9. Epub 2020 Jul 16. Mol Neurobiol. 2020. PMID: 32676989
-
The Involvement of RAGE and Its Ligands during Progression of ALS in SOD1 G93A Transgenic Mice.Int J Mol Sci. 2022 Feb 16;23(4):2184. doi: 10.3390/ijms23042184. Int J Mol Sci. 2022. PMID: 35216298 Free PMC article.
-
Effects of RAGE inhibition on the progression of the disease in hSOD1G93A ALS mice.Pharmacol Res Perspect. 2020 Aug;8(4):e00636. doi: 10.1002/prp2.636. Pharmacol Res Perspect. 2020. PMID: 32776498 Free PMC article.
-
New Insights on the Mechanisms of Disease Course Variability in ALS from Mutant SOD1 Mouse Models.Brain Pathol. 2016 Mar;26(2):237-47. doi: 10.1111/bpa.12351. Brain Pathol. 2016. PMID: 26780365 Free PMC article. Review.
-
Update on the pathological roles of prostaglandin E2 in neurodegeneration in amyotrophic lateral sclerosis.Transl Neurodegener. 2023 Jun 19;12(1):32. doi: 10.1186/s40035-023-00366-w. Transl Neurodegener. 2023. PMID: 37337289 Free PMC article. Review.
Cited by
-
Advanced Glycation End Products in Health and Disease.Microorganisms. 2022 Sep 15;10(9):1848. doi: 10.3390/microorganisms10091848. Microorganisms. 2022. PMID: 36144449 Free PMC article. Review.
-
Bone Marrow Harbors a Unique Population of Dendritic Cells with the Potential to Boost Neutrophil Formation upon Exposure to Fungal Antigen.Cells. 2021 Dec 24;11(1):55. doi: 10.3390/cells11010055. Cells. 2021. PMID: 35011617 Free PMC article.
-
Early Signs of Neuroinflammation in the Postnatal Wobbler Mouse Model of Amyotrophic Lateral Sclerosis.Cell Mol Neurobiol. 2023 Jul;43(5):2149-2163. doi: 10.1007/s10571-022-01294-5. Epub 2022 Oct 11. Cell Mol Neurobiol. 2023. PMID: 36219378
-
Role and Therapeutic Potential of RAGE Signaling in Neurodegeneration.Curr Drug Targets. 2022;23(12):1191-1209. doi: 10.2174/1389450123666220610171005. Curr Drug Targets. 2022. PMID: 35702767 Free PMC article.
-
In Vitro Methodologies to Study the Role of Advanced Glycation End Products (AGEs) in Neurodegeneration.Nutrients. 2022 Jan 15;14(2):363. doi: 10.3390/nu14020363. Nutrients. 2022. PMID: 35057544 Free PMC article. Review.
References
-
- NINDS. Amyotrophic Lateral Sclerosis (ALS) Fact Sheet. Bethesda: NIH Neurological Institute; 2013. No. 16-916
-
- Dal Canto MC, Gurney ME. Neuropathological changes in two lines of mice carrying a transgene for mutant human Cu,Zn SOD, and in mice overexpressing wild type human SOD: a model of familial amyotrophic lateral sclerosis (FALS) Brain Res. 1995;676(1):25–40. doi: 10.1016/0006-8993(95)00063-V. - DOI - PubMed
MeSH terms
Substances
Grants and funding
LinkOut - more resources
Full Text Sources
Medical
Molecular Biology Databases
Miscellaneous
