. 2021 May 13;184(10):2696-2714.e25.
doi: 10.1016/j.cell.2021.03.048. Epub 2021 Apr 22.

Chaperone-mediated autophagy prevents collapse of the neuronal metastable proteome

Affiliations

Chaperone-mediated autophagy prevents collapse of the neuronal metastable proteome

Mathieu Bourdenx et al. Cell. .

Abstract

Components of the proteostasis network malfunction in aging, and reduced protein quality control in neurons has been proposed to promote neurodegeneration. Here, we investigate the role of chaperone-mediated autophagy (CMA), a selective autophagy shown to degrade neurodegeneration-related proteins, in neuronal proteostasis. Using mouse models with systemic and neuronal-specific CMA blockage, we demonstrate that loss of neuronal CMA leads to altered neuronal function, selective changes in the neuronal metastable proteome, and proteotoxicity, all reminiscent of brain aging. Imposing CMA loss on a mouse model of Alzheimer's disease (AD) has synergistic negative effects on the proteome at risk of aggregation, thus increasing neuronal disease vulnerability and accelerating disease progression. Conversely, chemical enhancement of CMA ameliorates pathology in two different AD experimental mouse models. We conclude that functional CMA is essential for neuronal proteostasis through the maintenance of a subset of the proteome with a higher risk of misfolding than the general proteome.

Keywords: Alzheimer’s disease; aging; chaperones; chemical activators of autophagy; lysosomes; neurodegeneration; protein aggregation; proteotoxicity; supersaturated proteome; tau.


Conflict of interest statement

Declaration of interests A.M.C. and E.G. are cofounders and scientific advisors for Life Biosciences. A.M.C. consults for Generian Pharmaceuticals and Cognition Therapeutics. N.J.K. consults for Maze Therapeutics and Interline Therapeutics, received research support from Vir Biotechnology and F. Hoffmann-La Roche, and is a shareholder of Tenaya Therapeutics. The remaining authors declare no competing interests. CA compound is under US patent US9512092 (E.G., A.M.C., and Q.X.).

Figures
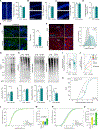
Figure 1.
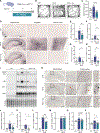
Figure 1.. CMA deficiency in excitatory neurons leads to proteostasis collapse
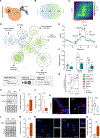
(A–C) Thickness of somatosensory cortex (A), CA1 (B), and dentate gyrus (DG) (C) in control (CTR) and CKL2A−/− mice assessed by Hoechst nuclear staining. Shown are representative images (left) and quantification (right). (D) Hippocampal surface in CKL2A−/− relative to CTR mice. (E) Lipofuscin autofluorescence in the hippocampus of CTR and CKL2A−/− mice. Shown are representative images (left) and quantification of puncta per cell (right) (related quantification in the stratum radiatum are shown in Figure S3C). (F) Immunostaining for K63-linkage ubiquitin in CTR and CKL2A−/− mice hippocampal neurons (left) and staining intensity distribution per cell body (right). Insert highlights the CA3 region. (G and H) Immunoblot for carbonyl groups (to detect oxidized proteins; G) and ubiquitinated proteins (total, K63- and K48-linkage; H) in the hippocampus of CTR and CKL2A−/− mice. Shown are representative immunoblots (top) and normalized densitometric quantification (bottom). (I–K) Comparative quantitative proteomics of CTR and CKL2A−/− mice cortex. Enrichment of total proteins (I) and prone-to-aggregate proteins (J) in the insoluble fraction (solid and discontinuous lines represent presence and absence of KFERQ-like motifs, respectively) and fold increase of the σf supersaturation score of proteins in the insoluble fraction (K). (L–O) Cumulative distribution of the supersaturation score σu (L) σf (N) of putative CMA substrates compared the whole proteome. Mean value of supersaturation score σu (M) σf (O) for different types of KFERQ-like motifs. Whole, whole proteome; Cano, canonical motif; P, phosphorylation (phosph.)-generated motif; K, acetylation (acet.)-generated motif. Scale bars represent 50 μm (A, C, and F), 40 μm (B), and 20 μm (E). Data represent mean ± SEM and individual values (A–E and G–I). Comparisons were made with an unpaired t test (A–I) and one-way ANOVA followed by Tukey’s post hoc test (M and O). *p < 0.05, **p < 0.005, and ***p < 0.0005. See also Figure S3, Data S1, and Table S1.
Figure 2.
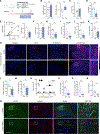
Figure 2.. Blockage of CMA and macroautophagy in excitatory neurons leads to collapse of different subsets of the neuronal proteome
(A) Diagram of the two autophagic pathways blocked in excitatory neurons this study, macroautophagy (blue) and CMA (green). (B–D) Comparative quantitative proteomics of the insoluble fractions of CKL2A−/− and CKATG7−/− mice brains. Venn diagram of proteins in the insoluble fractions (B), rank-rank hypergeometric overlap (RRHO) plot comparing enriched proteins in the insoluble fractions (C), and network visualization of Gene Ontology enrichment of insoluble proteins (D) (blue edges show similarity between nodes in CKATG7−/−, and green nodes show similarity between nodes in CKL2A−/− mice). (E and F) Extracellular acidification rates (ECARs) in primary cortical neurons from CTR and CKL2A−/− mice upon addition of the indicated compounds (E) and glycolytic properties calculated from the areas under the curve in ECAR (F). (G) Shift from soluble to insoluble fraction of individual glycolysis-related enzymes in CTR and L2A−/− mice. Solid and dashed lines indicate presence or absence of KFERQ-like motifs, respectively. (H–J) Clathrin-mediated endocytosis related proteins in cortex of CTR and L2A−/− mice at 6 months. Representative immunoblots (H) and quantifications (I and J). (K) Transferrin uptake at 10 min in differentiated neuroblastoma cell lines transduced with empty vector (control) or shL2A construct (L2A(−)). Representative images of transferrin (magenta) and Hoechst (blue) (left). Inset: higher magnification and quantification of transferrin uptake expressed as folds of control (CTR) cells. n = 15–25 cells per condition (right). Scale bar, 20 μm. See also Figure S4P. (L and M) Arpc2 in cortex of CTR and L2A−/− mice at 6 months. Representative immunoblots (L) and quantification (M). (N and O) Immunostaining for actin in hippocampal neurons of CTR and L2A−/− mice at 6 months. Representative images with higher magnification illustrating actin-rich rod-like structures (N) and quantification (O). Scale bars represent 20 μm (K and O). Data represent mean ± SEM, and individual values are shown in (F), (I), (J), (M), and (O). Comparisons were made using an unpaired t test (F, I–K,M, and O). *p < 0.05, **p < 0.005, and ***p < 0.0005. See also Figure S4, Data S1, and Tables S2 and S3.
Figure 3.
Figure 3.. CMA activity is inhibited in a tauopathy mouse model and Alzheimer’s disease patient brains
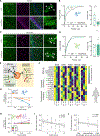
(A–D) CMA (measured as the number of fluorescent puncta per cell) in CA1 pyramidal neurons (A and B) and GFAP-positive astrocytes (D and E) in the hippocampus of CTR and hTauP301L-expressing mice (Tau) at 12 months. (A and C) KFERQ-Dendra fluorescence (green), immunostaining for human tau (magenta), and Hoechst staining (blue). Arrowheads: KFERQ-Dendra+ puncta. (B and D) Distribution of the number of KFERQ-Dendra+ puncta per cell in CTR and Tau mice (left) and mean number of puncta per cell per animal (right) (right). Dendra values are from 9–17 (B) or 10–19 (D) individual cell from three to five animals per genotype. Scale bar, 50 μm. (E) Schematic representation of the CMA network. Proteins involved in CMA are grouped based on function (effectors and modulators) and localization (lysosomal and extra-lysosomal) (modified from Kirchner et al., 2019). (F) Normalized expression (Z scoring within each cell type) of CMA network components (organized in functional groups and colored dots indicate the effect of a given element on CMA activity; green, positive element; red, negative element). (G and H) CMA activation score of excitatory (Excit.) and inhibitory (Inhib.) neurons (G) and astrocytes (Astro.), microglia (Microg.), and oligodendrocytes (Oligo.) (H) in brains with low (Braak stage 0–II), medium (Braak stage III to IV), and advanced (Braak score V to VI) pathology. (I and J) Negative correlation between CMA activation score in excitatory neurons and pathology markers using Braak pathology staging (I) and NIA-Reagan score (J). Data represent mean ± SEM in (B), (D), (G), and (H) and individual values in (B), (D), (I), and (J). Comparisons were made using a Kruskal-Wallis test followed by Dunn’s post hoc test (B and D), two-way ANOVA followed by Sidak’s multiple comparisons test (G and H), or Pearson correlation test (I and J). **p < 0.005 and ***p < 0.0005. See also Figure S5.
Figure 4.
Figure 4.. Loss of CMA in neurons accelerates pathology in a mouse model of AD-related proteotoxicity
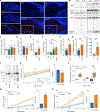
(A) Immunostaining for Aβ (green) and S422-phosphorylated (pS422) tau (red) and Hoechst staining (blue) in the hippocampus of Tg and Tg-L2A−/− mice. Montages of individual images from the scanning of whole-brain slices are shown. Right shows higher magnification images of the dorsal hippocampus. Insets show boxed areas at higher magnification. Scale bar, 1,500 μm. (B–H) Immunoblots for the indicated proteins in brains of 12-month-old CTR, L2A−/−, Tg, and Tg-L2A−/− mice (B) and densitometric quantifications expressed as fold of CTR (C and F) or fold of Tg (D, E, G, and H) for endogenous murine tau (C), human tau (D), S202/T205-phosphorylated tau (AT8)(E), APP (F), C-terminal fragments (CTFs) of APP (G), and αCTFs (H). n = 9 mice per genotype. (I) ELISA for Aβ42 of low-speed supernatants of hippocampus from Tg and Tg-L2A−/− mice. n = 8–10 mice per genotype. (J) Immunoblot for oligomeric tau (HT7, left) and pS422 tau (right) of the low-speed sarkosyl-insoluble fraction of brains from the indicated mouse genotypes. (K–N) AlphaLISA of low-speed supernatants of hippocampus from Tg and Tg-L2A−/− mice for total tau (K), S202/T205-phosphorylated (pS202-T205) tau (L), S422-phosphorylated (pS422) tau (M), and aggregated tau (N). Left panels show time course and right panels show regression coefficient (±95% confidence interval [CI]). n = 3–10 mice per genotype/time point. Data represent mean ± SEM (linear regression panels) and individual values (all other panels). Comparisons were made using a Kruskal-Wallis test followed by Dunn’s post hoc test (C and F), unpaired t test (D, E, and G–I), or two-way ANOVA followed by Sidak’s post hoc analysis (J–M). *p < 0.05, **p < 0.005, and ***p < 0.0005. See also Figure S6 and Data S1.
Figure 5.
Figure 5.. Neuronal loss of CMA has a synergistic deleterious impact on AD-related brain proteotoxicity
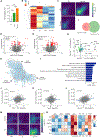
(A) Number of differentially expressed (DE) proteins between Tg, L2A−/−, and Tg-L2A−/− mice brains compared to CTR. Comparisons were made with two-way ANOVA followed by Sidak’s post hoc analysis. ***p < 0.0005. (B) Heatmap and hierarchical clustering analysis based on changes in protein abundance between genotypes. (C) RRHO plots show similarity in enriched proteins between genotypes. (D and E) Volcano plot of the quantitative proteomic analysis of brain from Tg-L2A−/− compared with L2A−/− (D) or Tg (E) mice brains. Top left: number of significant hits. Red dots indicate DE proteins (p < 0.01 and |fold change| > 1.25). (F and G) Venn diagram of significantly DE nonoverlapping and overlapping proteins in Tg-L2A−/− compared to L2A−/− and Tg mice (F) and fold and directionality of changes of the eight overlapping proteins (G). (H) Network visualization of Gene Ontology enrichment analysis of proteins specifically modified in Tg-L2A−/− mice brains. (I) Gene Ontology analysis of proteins specifically increased in Tg-L2A−/− mice brains. (J–L) Comparison between AD human cases (Johnson et al., 2020) and L2A−/−, Tg, and Tg-L2A−/− mice proteomes. The human cases were normalized to cognitively control subjects (“AD-Control”), whereas L2A−/−, Tg, and Tg-L2A−/− mice results were normalized to CTR mice. Blue line indicates the linear regression (±95% CI) between human and mouse values. (M) RRHO plots to show similarity in enriched proteins between both asymptomatic (AsymAD) and symptomatic AD (AD) cases and L2A−/−, Tg, and Tg-L2A−/− mice. (N) Human Aβ-correlated proteins (from Bai et al., 2020) validated in L2A−/−, Tg, and Tg-L2A−/− mice. Numbers at the bottom indicated the number of consistent changes between AD and mouse proteome. See also Table S4.
Figure 6.
Figure 6.. Chemical activation of CMA improves behavior and neuropathology in a mouse model of frontotemporal-dementia-related proteotoxicity
(A) Schematic of regimen of CMA activator (CA) administration to mice overexpressing human P301S tau (PS19). (B and C) Spontaneous locomotion in an open field of 9-month-old CTR or PS19 mice administered vehicle (Veh) or CA. Shown are representative tracks (B) and total distance traveled in 10 min (C). (D–H) Immunostaining for MC1 tau in the hippocampus, the amygdala, and the piriform cortex of 9-month-old CTR, PS19 mice ±CA. Representative images of the indicated brain regions (D). Scale bars represent 500 μm (hippocampus) and 200 μm (amygdala and piriform cortex). Quantification of the area stained in the hippocampus (E), piriform cortex (F), and amygdala (G). Quantification of the number of MC1-positive neurons per mm2 in the amygdala (H). (I–M) Immunoblots for tau and phosphorylated tau. Representative immunoblots and densitometric quantifications for the indicated proteins: S422-phosphorylated tau (J), S202/T205-phosphorylated tau (AT8) (K), MC1 tau (L), and total tau (M). (N–P) Immunostaining for Iba1 (N) and quantification of average cell size in the hippocampus (O) and the piriform cortex (P). Scale bars represent 500 μm (hippocampus) and 200 μm (piriform cortex). Data are mean ± SEM. Individual values are shown for n = 9–10 mice per genotype and treatment (C, E–H, and J–P). Comparisons were made using one-way ANOVA followed by Tukey’s post hoc analysis (C, E, G, H, J, and L–P) or Kruskal-Wallis test followed by Dunn’s post hoc test (F and K). *p < 0.05, **p < 0.005, and ***p < 0.0005. See also Figure S7 and Data S1.
Figure 7.
Figure 7.. Chemical activation of CMA improves behavior and neuropathology in a mouse model of AD-related proteotoxicity
(A) Schematic of regimen of CMA activator (CA) administration to TauPS2APP (Tg) mice. (B–D) Performance of Tg mice administered vehicle (Veh) or CMA activator (CA) in the novel object recognition test (B) (left plot: percentage of time dedicated to the novel object; right plot: discrimination index), the elevated plus maze (C), and the forced swim test (D). (E) Clasping score in Tg mice ±CA: time course of clasping score increase (left) and mean linear regression coefficient (right). (F) Performance of Tg mice ±CA in horizontal grid test. (G–P) Immunostaining of immature amyloid plaques (MOAB2), mature amyloid depositions (6E10), β sheet marker (thioflavin S), and threonine-231-phosphorylated tau (pThr231 tau) in the dorsal hippocampus of Tg mice ±CA. (G) Representative images. Montages of individual images from the scanning of whole-brain slices are shown. Inset: higher magnification of pThr231 tau staining. Scale bar, 200 μm. Quantification of the percentage of area positive and plaque size for MOAB2 (H and K), 6E10 (I and L), or thioflavin S (J and M). Relationship between number of plaques and average plaque size for different markers of plaque maturity (ThS > 6E10 > MOAB2) (N). Quantification of percentage of area positive for pThr231 tau (O) and the overlap between pThr231 tau staining and 6E10 staining (P). (Q and R) Immunostaining of astrocytes (GFAP, green), amyloid pathology (MOAB2, magenta), and nuclei (Hoechst, blue) in the dorsal hippocampus of Tg mice ±CA (Q) and colocalization coefficient (R). Montages of individual images from the scanning of whole-brain slices are shown. Inset: higher magnification of the boxed area. Scale bar, 200 μm (Q). All quantifications (except clasping; E) were done at 12 months in four to six mice per group. Data represent mean ± SEM. Comparisons were made using unpaired t test (B–D, F, and H–P), Mann-Whitney U test (Q), or two-way ANOVA test followed by Sidak’s post hoc analysis (E). *p < 0.05, **p < 0.005, and ***p < 0.0005. See also Figure S8.

Similar articles

Cited by

References

    1. Alberi L, Liu S, Wang Y, Badie R, Smith-Hicks C, Wu J, Pierfelice TJ, Abazyan B, Mattson MP, Kuhl D, et al. (2011). Activity-induced Notch signaling in neurons requires Arc/Arg3.1 and is essential for synaptic plasticity in hippocampal networks. Neuron 69, 437–444. - PMC - PubMed
    1. Alvarez-Erviti L, Seow Y, Schapira AH, Rodriguez-Oroz MC, Obeso JA, and Cooper JM (2013). Influence of microRNA deregulation on chaperone-mediated autophagy and a-synuclein pathology in Parkinson’s disease. Cell Death Dis. 4, e545. - PMC - PubMed
    1. Anguiano J, Garner TP, Mahalingam M, Das BC, Gavathiotis E, and Cuervo AM (2013). Chemical modulation of chaperone-mediated autophagy by retinoic acid derivatives. Nat. Chem. Biol. 9, 374–382. - PMC - PubMed
    1. Aniento F, Roche E, Cuervo AM, and Knecht E (1993). Uptake and degradation of glyceraldehyde-3-phosphate dehydrogenase by rat liver lysosomes. J. Biol. Chem. 268, 10463–10470. - PubMed
    1. Bai B, Wang X, Li Y, Chen PC, Yu K, Dey KK, Yarbro JM, Han X, Lutz BM, Rao S, et al. (2020). Deep Multilayer Brain Proteomics Identifies Molecular Networks in Alzheimer’s Disease Progression. Neuron 106, 700. - PMC - PubMed

Publication types

LinkOut - more resources