. 2021 Mar 8;22(1):78.
doi: 10.1186/s13059-021-02286-2.

Giotto: a toolbox for integrative analysis and visualization of spatial expression data

Affiliations

Giotto: a toolbox for integrative analysis and visualization of spatial expression data

Ruben Dries et al. Genome Biol. .

Abstract

Spatial transcriptomic and proteomic technologies have provided new opportunities to investigate cells in their native microenvironment. Here we present Giotto, a comprehensive and open-source toolbox for spatial data analysis and visualization. The analysis module provides end-to-end analysis by implementing a wide range of algorithms for characterizing tissue composition, spatial expression patterns, and cellular interactions. Furthermore, single-cell RNAseq data can be integrated for spatial cell-type enrichment analysis. The visualization module allows users to interactively visualize analysis outputs and imaging features. To demonstrate its general applicability, we apply Giotto to a wide range of datasets encompassing diverse technologies and platforms.


Conflict of interest statement

The authors declare that they have no competing interests.

Figures

Fig. 1
Fig. 1
The Giotto framework to analyze and visualize spatial expression data. a Schematic representation of the Giotto workflow to analyze and visualize spatial expression data. Giotto Analyzer requires a count matrix and physical coordinates for the corresponding cells. It follows standard scRNAseq processing and analysis steps to identify differentially expressed genes and cell types. In the following step, a spatial grid and neighborhood network is created which is further used to incorporate the spatial information of the single-cell environment and which is used for spatial analysis. b Cell coordinates, annotations, and clustering information are utilized and incorporated in the Giotto Viewer. This interactive viewer allows users to explore the link between cells’ physical positions and their clustering pattern in the expression space (UMAP or tSNE). The addition of raw subcellular transcript coordinates, staining images, or cell segmentation information is also supported. c Overview of the selected broad range of different spatial technologies and datasets which were analyzed and visualized with Giotto. For each dataset the number of features (genes or proteins) and number of cells are shown before filtering. The technologies depicted are sequential fluorescence in situ hybridization plus (seqFISH+), Visium 10X (Visium), Slide-seq, cyclic-ouroboros single-molecule fluorescence in situ hybridization (osmFISH), multiplexed error-robust fluorescent in situ hybridization (merFISH), spatially resolved transcript amplicon readout mapping (STARmap), tissue-based cyclic immunofluorescence (t-CyCIF), Multiplex Ion Beam Imaging (MIBI), and CO-Detection by indexing (CODEX)
Fig. 2
Fig. 2
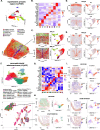
Analysis and visualization of large-scale spatial transcriptomic and proteomic datasets. a Visualization in both expression (top) and physical (bottom) space of the cell types identified by Giotto Analyzer in the pre-optic hypothalamic merFISH dataset, which consists of 12 slices from the same 3D sample (distance unit = 1 μm). b Heatmap showing the marker genes for the identified cell populations in a, c Visualization in both expression and physical space of two representative slices within the z-orientation (100 μm and 400 μm). d, e Overlay of gene expression in both expression and physical space for the selected slices in c, f. Visualization in both expression (top) and spatial (bottom) space of the clusters identified by Giotto Analyzer in the pancreatic ductal adenocarcinoma (PDAC) tissue-CyCIF dataset, which covers multiple tissues, including pancreas, small intestine, and cancer cells (distance unit = 1 μm). g Heatmap showing the marker proteins for the identified cell clusters in f, h. Visualization in both expression and physical space of two selected windows (red squares in f) in the normal pancreas and small-intestinal regions. i, j Overlay of gene expression in both expression and physical space for the selected windows in h
Fig. 3
Fig. 3
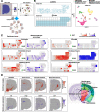
Cell-type enrichment analysis on spatial expression data. a Schematic of cell-type enrichment analysis pipeline. The inputs are spatial expression data and cell-type-specific gene signatures. These two sources of information are integrated to infer cell type enrichment scores. Giotto implements three methods for enrichment analysis: PAGE, RANK, and Hypergeometric. b Single-cell resolution seqFISH+ data are used to simulate coarse-resolution spatial transcriptomic data generated from spot-like squares by projecting onto a regular spatial grid (500 × 500 pixels). Colored squares indicate those that contain cells. External scRNAseq data are visualized by UMAP. c Comparison of cell-type enrichment scores (left, inferred by PAGE) and observed frequency of various cell types (right, based on seqFISH+ data). The agreement between the two is quantified by area under curve (AUC) scores (green circles). d Cell type enrichment analysis for the mouse Visium brain dataset (distance unit = 1 pixel, 1 pixel ≈ 1.46 μm). Enrichment scores for selected cell types are displayed (top left) and compared with the expression level of known marker genes (bottom left). For comparison, a snapshot of the anatomic structure image obtained from mouse Allen Brain Atlas is displayed. Known locations for the selected cell types are highlighted
Fig. 4
Fig. 4
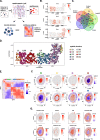
Layers of spatial gene expression variability. a Schematic representation of the subsequent steps needed to dissect the different layers of spatial gene expression variability. The original cell locations, a spatial grid, or a spatial network is required to identify individual genes with spatial coherent expression patterns. Those spatial genes can then be used as input to compute continuous spatial co-expression patterns or to find discrete spatial domains with HMRF. b–d Spatial gene expression analysis of the seqFISH+ somatosensory cortex dataset (distance unit = 1 pixel, 1 pixel ≈ 103 nm). b Examples of identified spatial genes within the somatosensory multi-layered cortex. The outer layers are on the left, while more inner layers are on the right. c Overlap between the top 1000 spatial genes identified from the 5 methods implemented in Giotto. d Visualization of spatial domains identified by the HMRF model. The layered anatomical structure (L1–6) of the somatosensory cortex is indicated on top. e, f Spatial gene expression analysis of the Visium kidney dataset (distance unit = 1 pixel, 1 pixel ≈ 1.46 μm). e Heatmap showing the spatial gene co-expression results. Identified spatial co-expression modules are indicated with different colors on top. f Metagene visualizations for all the identified spatial gene co-expression modules from e, g Selected gene visualizations for each identified spatial metagene in e and f
Fig. 5
Fig. 5
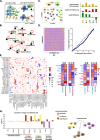
Cell neighborhood and cell-to-cell communication analyses. a Schematic of a multicellular tissue with an organized cellular structure (left) and environment specific gene expression (right). b A network representation of the pairwise interacting cell types identified by Giotto in the seqFISH+ somatosensory cortex dataset. Enriched or depleted interactions are depicted in red and green, respectively. Width of the edges indicates the strength of enrichment or depletion. c Visualization of the cell-to-cell communication analysis strategy. For each ligand-receptor pair from a known database a combined co-expression score was calculated for all cells of two interacting cell types (e.g., yellow and blue cells, left). This co-expression score was compared with a background distribution of co-expression scores based on spatial permutations (n = 1000). A cell-cell communication score based on adjusted p value and log2 fold change was used to rank a ligand-receptor pair across all identified cells of interacting cell types (right). d Heatmap (left) showing the ranking results for the ligand-receptor analysis as in c (y-axis) versus the same analysis but without spatial information (x-axis) for all the ligand-receptor pairs. AUC plot (right) indicating the percentage of expression ranks that need to be considered to recover all the first spatial ranks. e Dotplot for ligand-receptor pairs that exhibit differential cell-cell communication scores due to spatial cell-cell interactions. The size of the dot is correlated with the adjusted p value and the color indicates increased (red) or decreased (blue) activity. Dots highlighted with a green box are used as examples in f. f Heatmaps showing the increased expression of indicated ligand-receptor pairs between cells of two interacting cell types. g Barplot showing gene expression changes in subsets of endothelial cells (left) stratified based on their spatial interaction with other indicated cell types (right, schematic visualization)
Fig. 6
Fig. 6
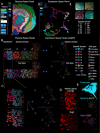
Giotto Viewer provides an interactive workspace to visualize and compare multiple cell annotations. a Visualization of the Visium brain dataset. Two interlinked panels are displayed, showing the data in the physical (left) and expression space (middle). A zoomed-in view shows underlying cell staining pattern at individual spots (right). b–e Visualization of the seqFISH+ mouse somatosensory cortex dataset. b Four interlinked panels are displayed, showing the spatial domain (top) and cell type (bottom) distribution in both physical (left) and expression space (right). c A zoomed-in view of b focusing on the L1–3 regions. Cells in domain D7 are selected (indicated by red outline in left panels and highlighted in the right panels) to enable comparison between spatial domain and cell type annotations. d Expression patterns of representative domain-specific genes. e Subcellular transcript localization patterns of all (top) or selected genes (middle and bottom) in a representative cell. Each dot represents an individual transcript

Similar articles

Cited by

References

    1. Han X, Wang R, Zhou Y, Fei L, Sun H, Lai S, et al. Mapping the mouse cell atlas by microwell-Seq. Cell. 2018;173:1307. doi: 10.1016/j.cell.2018.05.012. - DOI - PubMed
    1. Tabula Muris Consortium, overall coordination, logistical coordination, organ collection and processing, library preparation and sequencing, Computational data analysis, et al. Single-cell transcriptomics of 20 mouse organs creates a Tabula Muris. Nature. 2018;562:367–72. - PMC - PubMed
    1. Lubeck E, Coskun AF, Zhiyentayev T, Ahmad M, Cai L. Single-cell in situ RNA profiling by sequential hybridization. Nat. Methods. 2014. p. 360–361. - PMC - PubMed
    1. Chen KH, Boettiger AN, Moffitt JR, Wang S, Zhuang X. RNA imaging. Spatially resolved, highly multiplexed RNA profiling in single cells. Science. 2015;348:aaa6090. doi: 10.1126/science.aaa6090. - DOI - PMC - PubMed
    1. Ståhl PL, Salmén F, Vickovic S, Lundmark A, Navarro JF, Magnusson J, et al. Visualization and analysis of gene expression in tissue sections by spatial transcriptomics. Science. 2016;353:78–82. doi: 10.1126/science.aaf2403. - DOI - PubMed

Publication types