Integrated Multiomics Reveals Glucose Use Reprogramming and Identifies a Novel Hexokinase in Alcoholic Hepatitis
- PMID: 33309778
- PMCID: PMC8613537
- DOI: 10.1053/j.gastro.2020.12.008
Integrated Multiomics Reveals Glucose Use Reprogramming and Identifies a Novel Hexokinase in Alcoholic Hepatitis
Erratum in
-
Correction.Gastroenterology. 2021 Sep;161(3):1075. doi: 10.1053/j.gastro.2021.06.068. Epub 2021 Jul 1. Gastroenterology. 2021. PMID: 34332936 No abstract available.
Abstract
Background & aims: We recently showed that alcoholic hepatitis (AH) is characterized by dedifferentiation of hepatocytes and loss of mature functions. Glucose metabolism is tightly regulated in healthy hepatocytes. We hypothesize that AH may lead to metabolic reprogramming of the liver, including dysregulation of glucose metabolism.
Methods: We performed integrated metabolomic and transcriptomic analyses of liver tissue from patients with AH or alcoholic cirrhosis or normal liver tissue from hepatic resection. Focused analyses of chromatin immunoprecipitation coupled to DNA sequencing was performed. Functional in vitro studies were performed in primary rat and human hepatocytes and HepG2 cells.
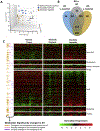
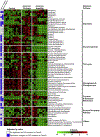
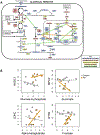
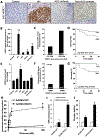
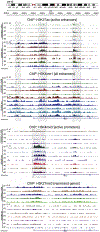
Results: Patients with AH exhibited specific changes in the levels of intermediates of glycolysis/gluconeogenesis, the tricarboxylic acid cycle, and monosaccharide and disaccharide metabolism. Integrated analysis of the transcriptome and metabolome showed the used of alternate energetic pathways, metabolite sinks and bottlenecks, and dysregulated glucose storage in patients with AH. Among genes involved in glucose metabolism, hexokinase domain containing 1 (HKDC1) was identified as the most up-regulated kinase in patients with AH. Histone active promoter and enhancer markers were increased in the HKDC1 genomic region. High HKDC1 levels were associated with the development of acute kidney injury and decreased survival. Increased HKDC1 activity contributed to the accumulation of glucose-6-P and glycogen in primary rat hepatocytes.
Conclusions: Altered metabolite levels and messenger RNA expression of metabolic enzymes suggest the existence of extensive reprogramming of glucose metabolism in AH. Increased HKDC1 expression may contribute to dysregulated glucose metabolism and represents a novel biomarker and therapeutic target for AH.
Keywords: Alcoholic Liver Disease; Metabolomics; Therapeutic Targets.
Copyright © 2021. Published by Elsevier Inc.
Conflict of interest statement
Conflicts of interest
The authors disclose no conflicts.
Figures

Similar articles
-
Hepatic HKDC1 Expression Contributes to Liver Metabolism.Endocrinology. 2019 Feb 1;160(2):313-330. doi: 10.1210/en.2018-00887. Endocrinology. 2019. PMID: 30517626 Free PMC article.
-
Liver-specific overexpression of HKDC1 increases hepatocyte size and proliferative capacity.Sci Rep. 2023 May 17;13(1):8034. doi: 10.1038/s41598-023-33924-3. Sci Rep. 2023. PMID: 37198225 Free PMC article.
-
The hexokinase "HKDC1" interaction with the mitochondria is essential for liver cancer progression.Cell Death Dis. 2022 Jul 28;13(7):660. doi: 10.1038/s41419-022-04999-z. Cell Death Dis. 2022. PMID: 35902556 Free PMC article.
-
The Role of Hexokinase Domain Containing Protein-1 in Glucose Regulation During Pregnancy.Curr Diab Rep. 2021 Jul 7;21(8):27. doi: 10.1007/s11892-021-01394-4. Curr Diab Rep. 2021. PMID: 34232412 Free PMC article. Review.
-
Hexokinase domain-containing protein-1 in metabolic diseases and beyond.Trends Endocrinol Metab. 2022 Jan;33(1):72-84. doi: 10.1016/j.tem.2021.10.006. Epub 2021 Nov 12. Trends Endocrinol Metab. 2022. PMID: 34782236 Free PMC article. Review.
Cited by
-
Drug Discovery in Liver Disease Using Kinome Profiling.Int J Mol Sci. 2021 Mar 5;22(5):2623. doi: 10.3390/ijms22052623. Int J Mol Sci. 2021. PMID: 33807722 Free PMC article. Review.
-
Advancing proteomics and machine learning in the clinic: an editorial on "Noninvasive proteomic biomarkers for alcohol-related liver disease".Hepatobiliary Surg Nutr. 2022 Oct;11(5):762-765. doi: 10.21037/hbsn-22-390. Hepatobiliary Surg Nutr. 2022. PMID: 36268253 Free PMC article. No abstract available.
-
Alcohol-associated liver disease.J Clin Invest. 2024 Feb 1;134(3):e176345. doi: 10.1172/JCI176345. J Clin Invest. 2024. PMID: 38299591 Free PMC article. Review.
-
Therapeutic Pipeline in Alcohol-Associated Liver Disease.Semin Liver Dis. 2023 Feb;43(1):60-76. doi: 10.1055/s-0042-1759614. Epub 2022 Dec 26. Semin Liver Dis. 2023. PMID: 36572032 Free PMC article. Review.
-
Hepatic CYP2B10 is highly induced by binge ethanol and contributes to acute-on-chronic alcohol-induced liver injury.Alcohol Clin Exp Res. 2022 Dec;46(12):2163-2176. doi: 10.1111/acer.14954. Epub 2022 Oct 25. Alcohol Clin Exp Res. 2022. PMID: 36224745 Free PMC article.
References
-
- Altamirano J, Fagundes C, Dominguez M, et al. Acute kidney injury is an early predictor of mortality for patients with alcoholic hepatitis. Clin Gastroenterol Hepatol 2012;10:65–71. - PubMed
-
- Mathurin P, Louvet A, Duhamel A, et al. Prednisolone with vs without pentoxifylline and survival of patients with severe alcoholic hepatitis: a randomized clinical trial. JAMA 2013;310:1033–1041. - PubMed
-
- Hanahan D, Weinberg RA. Hallmarks of cancer: the next generation. Cell 2011;144:646–674. - PubMed
Publication types
MeSH terms
Substances
Grants and funding
- U01 AA026264/AA/NIAAA NIH HHS/United States
- MR/R023026/1/MRC_/Medical Research Council/United Kingdom
- R01 AA018873/AA/NIAAA NIH HHS/United States
- P50 AA027054/AA/NIAAA NIH HHS/United States
- U01 AA026978/AA/NIAAA NIH HHS/United States
- F31 AA024969/AA/NIAAA NIH HHS/United States
- T32 AA007463/AA/NIAAA NIH HHS/United States
- R24 AA025017/AA/NIAAA NIH HHS/United States
- U01 AA021908/AA/NIAAA NIH HHS/United States
- P30 DK120531/DK/NIDDK NIH HHS/United States
- R01 DK110355/DK/NIDDK NIH HHS/United States
- U01 AA026972/AA/NIAAA NIH HHS/United States
LinkOut - more resources
Full Text Sources
Molecular Biology Databases

