

Recalibrating the epigenetic clock: implications for assessing biological age in the human cortex
- PMID: 33300551
- PMCID: PMC7805794
- DOI: 10.1093/brain/awaa334
Recalibrating the epigenetic clock: implications for assessing biological age in the human cortex
Abstract
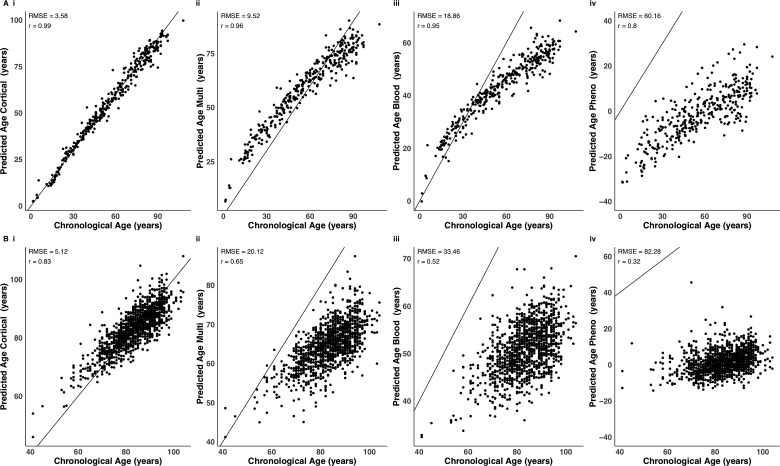
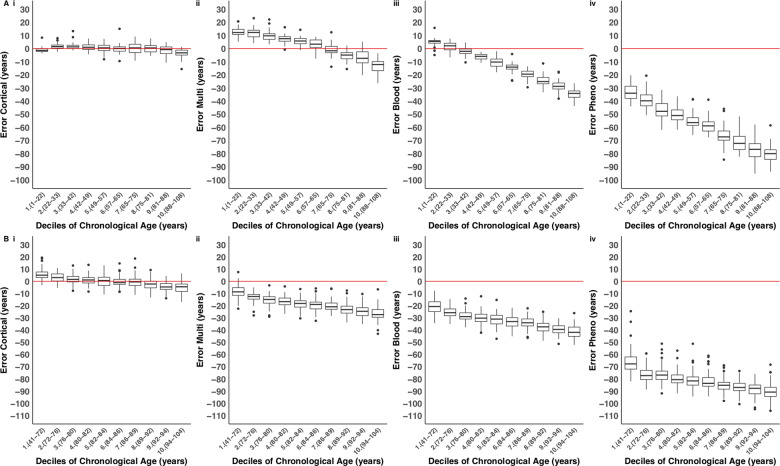
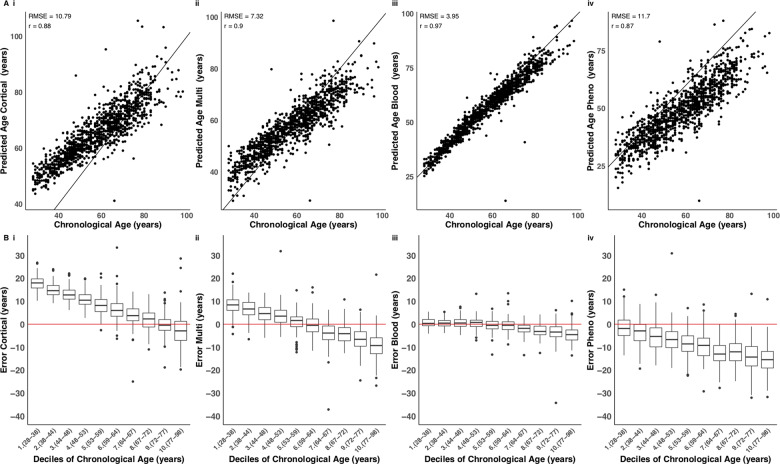
Human DNA methylation data have been used to develop biomarkers of ageing, referred to as 'epigenetic clocks', which have been widely used to identify differences between chronological age and biological age in health and disease including neurodegeneration, dementia and other brain phenotypes. Existing DNA methylation clocks have been shown to be highly accurate in blood but are less precise when used in older samples or in tissue types not included in training the model, including brain. We aimed to develop a novel epigenetic clock that performs optimally in human cortex tissue and has the potential to identify phenotypes associated with biological ageing in the brain. We generated an extensive dataset of human cortex DNA methylation data spanning the life course (n = 1397, ages = 1 to 108 years). This dataset was split into 'training' and 'testing' samples (training: n = 1047; testing: n = 350). DNA methylation age estimators were derived using a transformed version of chronological age on DNA methylation at specific sites using elastic net regression, a supervised machine learning method. The cortical clock was subsequently validated in a novel independent human cortex dataset (n = 1221, ages = 41 to 104 years) and tested for specificity in a large whole blood dataset (n = 1175, ages = 28 to 98 years). We identified a set of 347 DNA methylation sites that, in combination, optimally predict age in the human cortex. The sum of DNA methylation levels at these sites weighted by their regression coefficients provide the cortical DNA methylation clock age estimate. The novel clock dramatically outperformed previously reported clocks in additional cortical datasets. Our findings suggest that previous associations between predicted DNA methylation age and neurodegenerative phenotypes might represent false positives resulting from clocks not robustly calibrated to the tissue being tested and for phenotypes that become manifest in older ages. The age distribution and tissue type of samples included in training datasets need to be considered when building and applying epigenetic clock algorithms to human epidemiological or disease cohorts.
Keywords: DNA methylation; age; brain; clock; cortex.
© The Author(s) (2020). Published by Oxford University Press on behalf of the Guarantors of Brain.
Figures
Similar articles
-
The association of epigenetic clocks in brain tissue with brain pathologies and common aging phenotypes.Neurobiol Dis. 2021 Sep;157:105428. doi: 10.1016/j.nbd.2021.105428. Epub 2021 Jun 19. Neurobiol Dis. 2021. PMID: 34153464 Free PMC article.
-
A Statistical Framework to Identify Deviation from Time Linearity in Epigenetic Aging.PLoS Comput Biol. 2016 Nov 11;12(11):e1005183. doi: 10.1371/journal.pcbi.1005183. eCollection 2016 Nov. PLoS Comput Biol. 2016. PMID: 27835646 Free PMC article.
-
Associations of four biological age markers with child development: A multi-omic analysis in the European HELIX cohort.Elife. 2023 Jun 6;12:e85104. doi: 10.7554/eLife.85104. Elife. 2023. PMID: 37278618 Free PMC article.
-
Epigenetic clocks provide clues to the mystery of uterine ageing.Hum Reprod Update. 2023 May 2;29(3):259-271. doi: 10.1093/humupd/dmac042. Hum Reprod Update. 2023. PMID: 36515535 Review.
-
DNA methylation-based biomarkers and the epigenetic clock theory of ageing.Nat Rev Genet. 2018 Jun;19(6):371-384. doi: 10.1038/s41576-018-0004-3. Nat Rev Genet. 2018. PMID: 29643443 Review.
Cited by
-
Within subject cross-tissue analyzes of epigenetic clocks in substance use disorder postmortem brain and blood.Am J Med Genet B Neuropsychiatr Genet. 2023 Jan;192(1-2):13-27. doi: 10.1002/ajmg.b.32920. Epub 2022 Sep 3. Am J Med Genet B Neuropsychiatr Genet. 2023. PMID: 36056652 Free PMC article.
-
The Cutting Edge of Epigenetic Clocks: In Search of Mechanisms Linking Aging and Mental Health.Biol Psychiatry. 2023 Nov 1;94(9):694-705. doi: 10.1016/j.biopsych.2023.02.001. Epub 2023 Feb 9. Biol Psychiatry. 2023. PMID: 36764569 Free PMC article. Review.
-
Mitochondrial DNA methylation profiling of the human prefrontal cortex and nucleus accumbens: correlations with aging and drug use.Clin Epigenetics. 2022 Jun 25;14(1):79. doi: 10.1186/s13148-022-01300-z. Clin Epigenetics. 2022. PMID: 35752846 Free PMC article.
-
Epigenetic Age Acceleration in Frontotemporal Lobar Degeneration: A Comprehensive Analysis in the Blood and Brain.Cells. 2023 Jul 24;12(14):1922. doi: 10.3390/cells12141922. Cells. 2023. PMID: 37508584 Free PMC article.
-
The association of epigenetic clocks in brain tissue with brain pathologies and common aging phenotypes.Neurobiol Dis. 2021 Sep;157:105428. doi: 10.1016/j.nbd.2021.105428. Epub 2021 Jun 19. Neurobiol Dis. 2021. PMID: 34153464 Free PMC article.
References
-
- Bell JE, Alafuzoff I, Al-Sarraj S, Arzberger T, Bogdanovic N, Budka H, et al.Management of a twenty-first century brain bank: experience in the BrainNet Europe consortium. Acta Neuropathol 2008; 115: 497–507. - PubMed
-
- Bernstein BE, Meissner A, Lander ES.. The mammalian epigenome. Cell 2007; 128: 669–81. - PubMed
-
- Buck N, McFall S. Understanding Society: design overview. Longitudinal and Life Course Studies 2011; 3: 5–17.
Publication types
MeSH terms
Substances
Grants and funding
- G1100540/MRC_/Medical Research Council/United Kingdom
- MR/R005176/1/MRC_/Medical Research Council/United Kingdom
- G0502157/MRC_/Medical Research Council/United Kingdom
- MR/M024784/1/MRC_/Medical Research Council/United Kingdom
- MR/M008924/1/MRC_/Medical Research Council/United Kingdom
- G0400074/MRC_/Medical Research Council/United Kingdom
- T32 AI007172/AI/NIAID NIH HHS/United States
- MC_PC_18025/MRC_/Medical Research Council/United Kingdom
- M008924/MRC_/Medical Research Council/United Kingdom
- K013807/MRC_/Medical Research Council/United Kingdom
- MC_PC_14095/MRC_/Medical Research Council/United Kingdom
- G0900652/MRC_/Medical Research Council/United Kingdom
LinkOut - more resources
Full Text Sources
Other Literature Sources
Medical
