. 2021 Jan 19;131(2):e140214.
doi: 10.1172/JCI140214.

Bone marrow adipogenic lineage precursors promote osteoclastogenesis in bone remodeling and pathologic bone loss

Affiliations

Bone marrow adipogenic lineage precursors promote osteoclastogenesis in bone remodeling and pathologic bone loss

Wei Yu et al. J Clin Invest. .

Abstract

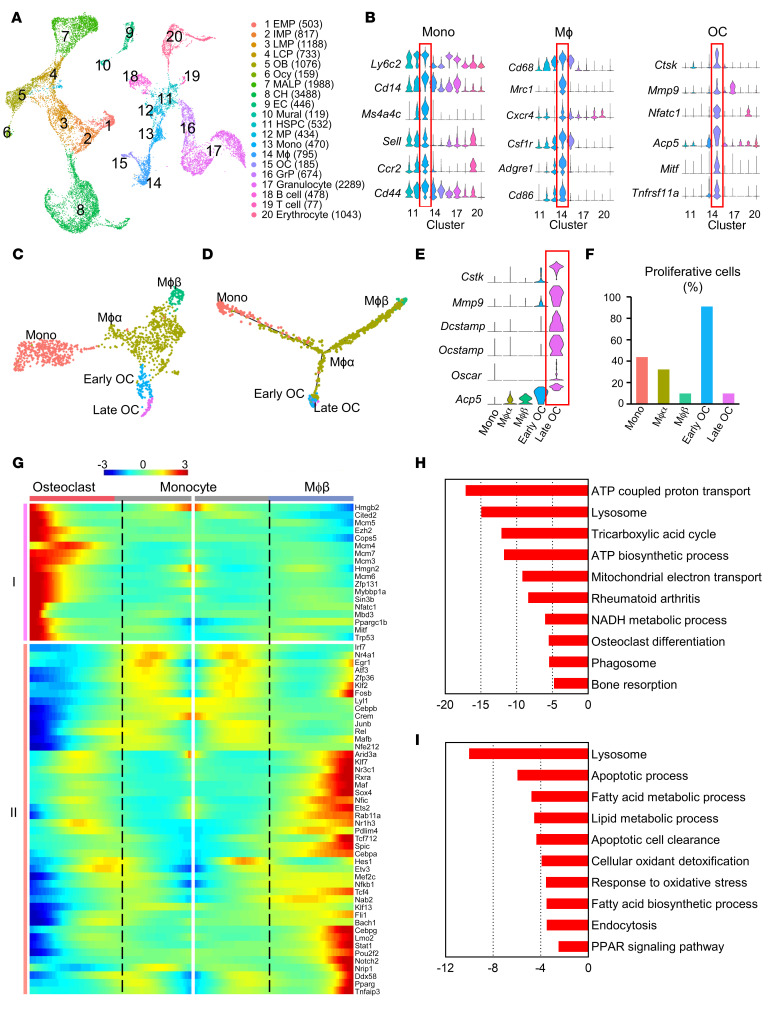
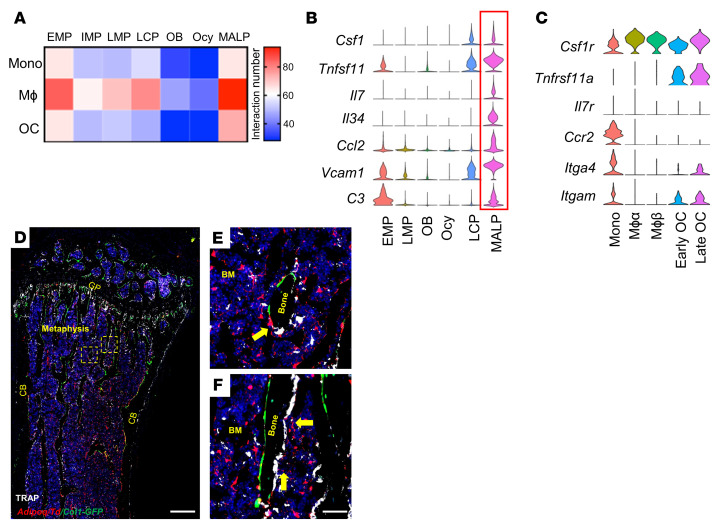
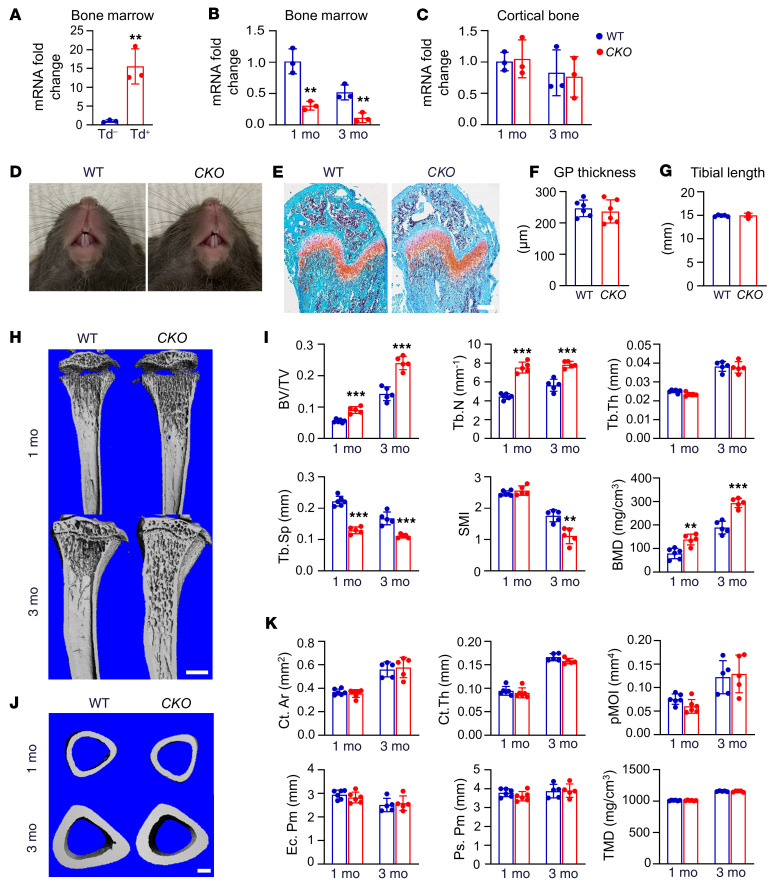
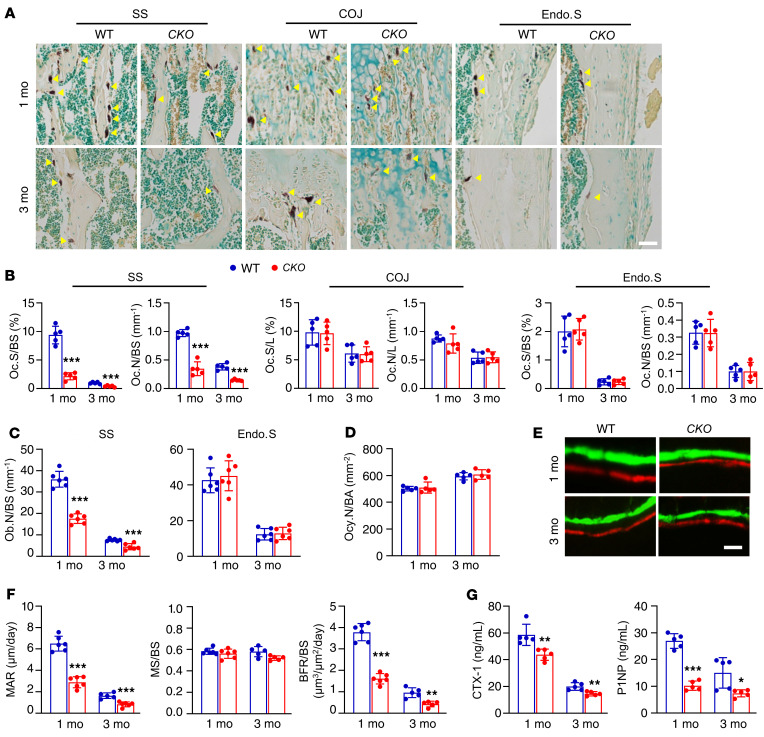
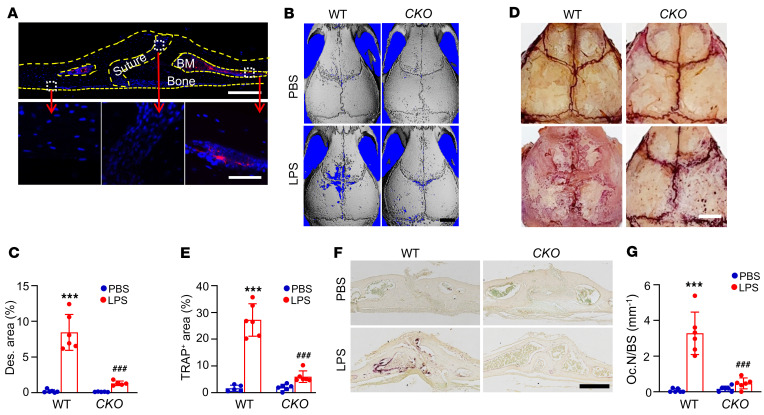
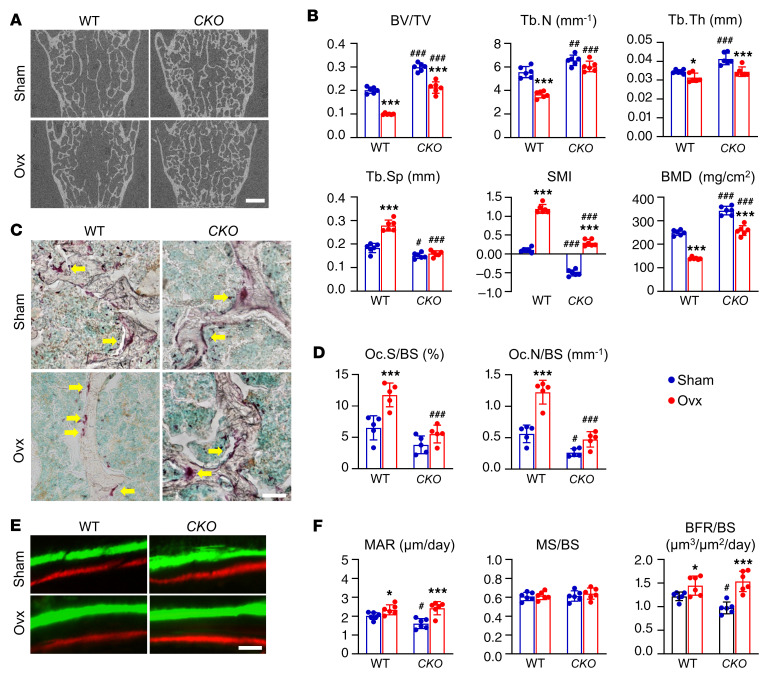
Bone is maintained by coupled activities of bone-forming osteoblasts/osteocytes and bone-resorbing osteoclasts. Alterations in this relationship can lead to pathologic bone loss such as osteoporosis. It is well known that osteogenic cells support osteoclastogenesis via production of RANKL. Interestingly, our recently identified bone marrow mesenchymal cell population-marrow adipogenic lineage precursors (MALPs) that form a multidimensional cell network in bone-was computationally demonstrated to be the most interactive with monocyte-macrophage lineage cells through high and specific expression of several osteoclast regulatory factors, including RANKL. Using an adipocyte-specific Adipoq-Cre to label MALPs, we demonstrated that mice with RANKL deficiency in MALPs have a drastic increase in trabecular bone mass in long bones and vertebrae starting from 1 month of age, while their cortical bone appears normal. This phenotype was accompanied by diminished osteoclast number and attenuated bone formation at the trabecular bone surface. Reduced RANKL signaling in calvarial MALPs abolished osteolytic lesions after LPS injections. Furthermore, in ovariectomized mice, elevated bone resorption was partially attenuated by RANKL deficiency in MALPs. In summary, our studies identified MALPs as a critical player in controlling bone remodeling during normal bone metabolism and pathological bone loss in a RANKL-dependent fashion.

Keywords: Bone Biology; Bone marrow differentiation.


Conflict of interest statement

Conflict of interest: The authors have declared that no conflict of interest exists.

Figures

Figure 1
Figure 1. Single-cell RNA sequencing identifies bone marrow monocyte-macrophage lineage cells and delineates in vivo osteoclastogenesis.
(A) The UMAP plot of cells isolated from bone marrow of 1- to 3-month-old Col2/Td mice (n = 8 mice). Ocy, osteocyte; CH, chondrocyte; EC, endothelial cells; MP, monocyte progenitor; Mϕ, macrophage; OC, osteoclast; GrP, granulocyte progenitor. (B) Violin plots of marker gene expression for monocyte, macrophage, and osteoclast clusters. (C) The UMAP plot of monocyte-macrophage lineage cells only. (D) Monocle trajectory plot of monocyte-macrophage lineage cells. (E) Violin plots of known late osteoclast markers. (F) The percentage of proliferative cells (S/G2/M phase) among each cluster was quantified. (G) Pseudotemporal depiction of differentially expressed TFs starting from the branch point (dashed lines) toward osteoclast (left) and macrophage (right) differentiation. Groups I and II contain TFs that are highly upregulated during osteoclast and macrophage differentiation routes, respectively. Color bar indicates the gene expression level. (H) GO term and KEGG pathway analyses of genes upregulated in late osteoclasts compared with early osteoclasts. (I) GO term and KEGG pathway analyses of genes upregulated in Mϕβ cells compared with Mϕα cells.
Figure 2
Figure 2. Adipoq-Cre labels MALPs in adult mouse bone marrow.
(A) Representative low magnification fluorescence image of 3-month-old Adipoq/Td/Col1-GFP mouse distal femur reveals many bone marrow Td+ cells. Scale bar: 200 μm. (BF) At a high magnification, Td does not label chondrocytes in articular cartilage (AC) (B) and growth plate (GP) (C), osteoblasts, nor osteocytes (D, E, F). White and yellow arrows point to Td+GFP cells and Td+GFP+ cells at the bone surface, respectively. BM, bone marrow; CB, cortical bone. Scale bars: 200 μm (B, C) and 50 μm (DF). (G) Quantification of Td+ cells in trabecular osteoblasts (OB) and osteocytes (Ocy) within trabecular (Trab.) and cortical (Cort.) bone (n = 3 mice/group). More than 1000 cells were counted per mouse. (H) Td labels pericytes (arrowheads) in bone marrow. Emcn, endomucin for vessel staining. (I) In Adipoq/Td mice, Td does not label CD45+ hematopoietic cells. (J) In vivo EdU injection reveals that bone marrow Td+ cells do not proliferate. (K) All Perilipin+ adipocytes (arrowheads) are Td+ as well. Scale bar: 20 μm (HK). (L) CFU-F assay of bone marrow cells from Adipoq/Td mice shows that all CFU-F colonies are made of Td cells (left image). Some Td+ cells did attach to the dish and form a small cluster within a Td CFU-F colony (right image). Scale bar: 100 μm. (M) In vitro adipogenic differentiation of Td mesenchymal progenitors reveals that Td signal is turned on first followed by lipid accumulation. The same area was imaged daily by inverted fluorescence microcopy. Scale bar: 100 μm. (N) In vitro osteogenic differentiation of Td mesenchymal progenitors reveals that Td signal remains off when a bony nodule forms. The same area was imaged daily by inverted fluorescence microcopy. Arrowheads point to a boney nodule. Scale bar: 100 μm.
Figure 3
Figure 3. MALPs are the major producer of osteoclast regulatory factors in bone.
(A) Ligand-receptor pair analysis of mesenchymal subpopulations with monocytes, macrophages, and osteoclasts. (B) Violin plots of osteoclast regulatory factors in mesenchymal subpopulations. (C) Violin plots of receptors for osteoclast regulatory factors in monocyte-macrophage lineage cells. (D) Representative fluorescence image of TRAP staining in 3-month-old Adipoq/Td/Col1-GFP mouse femur. Scale bar: 500 μm. (E, F) Enlarged images of boxed area in D. Yellow arrows point to Td+ cell processes touching nearby bone surface osteoclasts (white). Note that osteoblasts (green) and osteoclasts are often located at the opposite sides of bone (F). GP, growth plate; CB, cortical bone; BM, bone marrow. Scale bar: 50 μm.
Figure 4
Figure 4. RANKL-CKOAdipoq mice have high trabecular bone mass.
(A) qRT-PCR analysis of Tnfsf11 mRNA in Td+ and Td cells sorted from bone marrow of Adipoq/Td mice (n = 3 mice/group). (B) qRT-PCR analysis of Tnfsf11 mRNA in bone marrow of WT and RANKL-CKOAdipoq mice at 1 and 3 months of age (n = 3 mice/group). (C) qRT-PCR analysis of Tnfsf11 mRNA in cortical bone of WT and RANKL-CKOAdipoq mice at 1 and 3 months of age (n = 3 mice/group). (D) Tooth eruption is not affected in RANKL-CKOAdipoq mice. (E) Representative Safranin O/fast green staining of long bone sections from 1-month-old WT and RANKL-CKOAdipoq mice. Scale bar: 200 μm. (F) Quantification of femoral growth plate thickness (n = 6 mice/group). (G) Quantification of tibial length (n = 6 mice/group). (H) 3D microCT reconstruction of WT and RANKL-CKOAdipoq mouse tibiae reveals a drastic increase of trabecular bone at 1 and 3 months of age. Scale bar: 1 mm. (I) MicroCT measurement of trabecular bone structural parameters from the secondary spongiosa region (n = 5–6 mice/group). (J) 3D microCT reconstructions of the tibial midshaft region. Scale bar: 0.2 mm. (K) MicroCT measurement of cortical bone structural parameters from the midshaft region (n = 5–6 mice/group). **P < 0.01; ***P < 0.001 Td+ vs. Td or CKO vs. WT, 2-tailed unpaired Student’s t test.
Figure 5
Figure 5. Bone resorption as well as bone formation are reduced in RANKL-CKOAdipoq mice.
(A) Representative TRAP staining images show TRAP+ osteoclasts (arrowheads) at different skeletal sites: secondary spongiosa (ss), COJ, and endosteal surface (Endo.S). Scale bar: 50 μm. (B) Quantification of osteoclast surface (Oc.S) and osteoclast number (Oc.N) at 3 skeletal sites (n = 5–6 mice/group). BS, bone surface; L, COJ length. (C) Quantification of osteoblast number (Ob.N) in the secondary spongiosa and at the endosteal surface (n = 5–6 mice/group). (D) Quantification of osteocyte density (osteocyte number per bone area, Ocy.N/BA) in the secondary spongiosa (n = 5–6 mice/group). (E) Representative double labeling in distal femurs of WT and CKO mice. Scale bar: 10 μm. (F) Bone formation activity is quantified (n = 5–6/group). (G) Serum ELISA analysis of bone resorption marker (CTX-1) and formation marker (PINP) in WT and CKO mice (n = 5 mice/group). *P < 0.05; **P < 0.01; ***P < 0.001 CKO vs. WT, 2-tailed unpaired Student’s t test.
Figure 6
Figure 6. RANKL-CKOAdipoq mice are protected from LPS-induced calvarial bone lesions.
(A) Representative coronal section of 1.5-month-old Adipoq/Td mouse calvaria. Bone surfaces are outlined by dashed lines. Boxed areas in the low magnification image (top) are enlarged to show periosteum (bottom left), suture (bottom middle), and bone marrow (BM, bottom right) regions. Scale bars: 200 μm (top) and 20 μm (bottom). (B) Representative 3D microCT reconstruction of mouse calvaria at 1 week after vehicle (PBS) or LPS injection. Scale bar: 2 mm. (C) Quantification of percentages of bone destruction area (Des. area) in calvaria (n = 6 mice/group). (D) Representative images of TRAP staining of whole calvaria. Scale bar: 2 mm. (E) Quantification of percentages of TRAP+ area in calvaria (n = 6 mice/group). (F) Representative images of calvaria coronal section stained by TRAP. Scale bar: 2 mm. (G) Quantification of osteoclast number (Oc.N) in calvaria (n = 6 mice/group). ***P < 0.001, LPS vs. PBS; ###P < 0.001, CKO vs. WT, 2-way ANOVA with Tukey’s post hoc analysis.
Figure 7
Figure 7. Ovx-induced bone resorption is partially attenuated in RANKL-CKOAdipoq mice.
(A) A 2D microCT reconstruction of WT and RANKL-CKOAdipoq mouse vertebrates at 1.5 months after sham or ovx surgery. Scale bar: 500 μm. (B) MicroCT measurement of trabecular bone structural parameters in vertebrates (n = 5–6 mice/group). (C) Representative image of TRAP staining in vertebrate after sham or ovx surgery. Arrows point to TRAP+ osteoclasts. Scale bar: 100 μm. (D) Quantification of osteoclast surface (Oc.S/BS) and number (Oc.N) in vertebrates after surgery (n = 5–6 mice/group). (E) Representative double labeling in WT and CKO vertebrates after surgery. Scale bar: 10 μm. (F) Bone formation activity is quantified (n = 5–6 mice/group). *P < 0.05, ***P < 0.001, Ovx vs. Sham; #P < 0.05, ##P < 0.01, ###P < 0.001, CKO vs. WT, 2-way ANOVA with Tukey’s post hoc analysis.

Comment in

Similar articles

Cited by

References

    1. Kains, JA on behalf of the World Health Organisation Scientific Group. Assessment of osteoporosis at the primary health care level. WHO Collaborating Centre for Metabolic Bone Diseases, University of Sheffield 2007. https://www.sheffield.ac.uk/FRAX/pdfs/WHO_Technical_Report.pdf.
    1. Ono T, Nakashima T. Recent advances in osteoclast biology. Histochem Cell Biol. 2018;149(4):325–341. doi: 10.1007/s00418-018-1636-2. - DOI - PubMed
    1. Boyle WJ, Simonet WS, Lacey DL. Osteoclast differentiation and activation. Nature. 2003;423(6937):337–342. doi: 10.1038/nature01658. - DOI - PubMed
    1. Kim N, Odgren PR, Kim DK, Marks SC, Choi Y. Diverse roles of the tumor necrosis factor family member TRANCE in skeletal physiology revealed by TRANCE deficiency and partial rescue by a lymphocyte-expressed TRANCE transgene. Proc Natl Acad Sci U S A. 2000;97(20):10905–10910. doi: 10.1073/pnas.200294797. - DOI - PMC - PubMed
    1. Kong YY, et al. OPGL is a key regulator of osteoclastogenesis, lymphocyte development and lymph-node organogenesis. Nature. 1999;397(6717):315–323. doi: 10.1038/16852. - DOI - PubMed

Publication types