

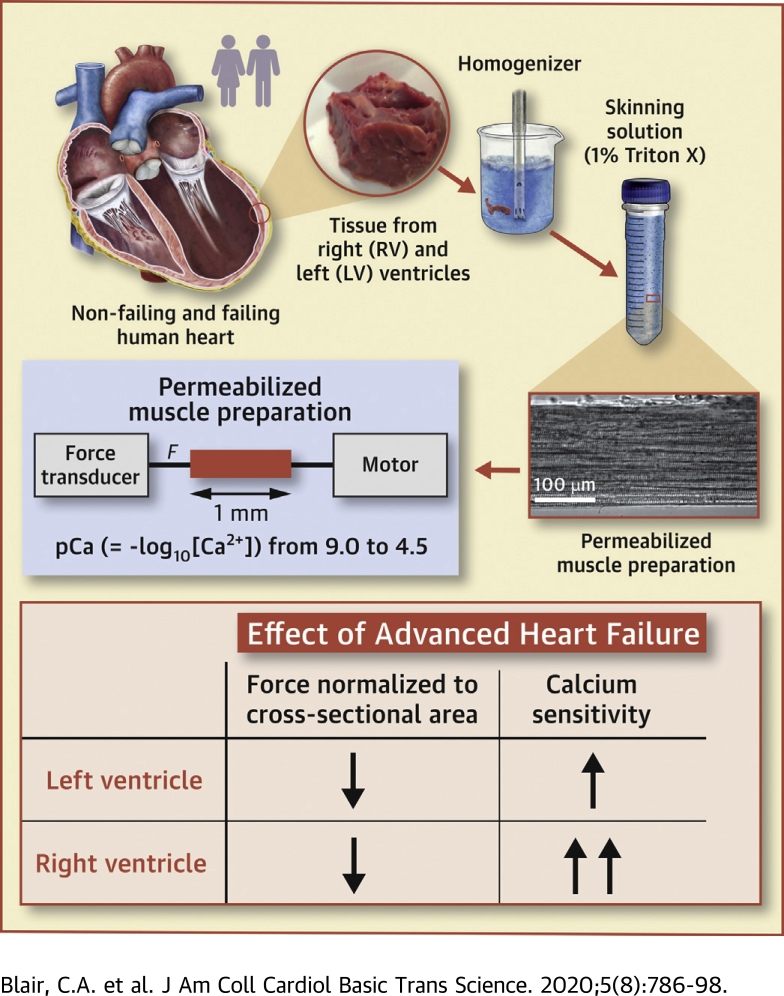
Heart Failure in Humans Reduces Contractile Force in Myocardium From Both Ventricles
- PMID: 32875169
- PMCID: PMC7452203
- DOI: 10.1016/j.jacbts.2020.05.014
Heart Failure in Humans Reduces Contractile Force in Myocardium From Both Ventricles
Abstract
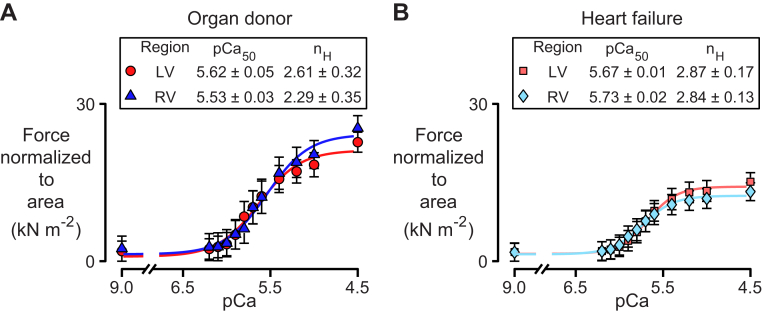
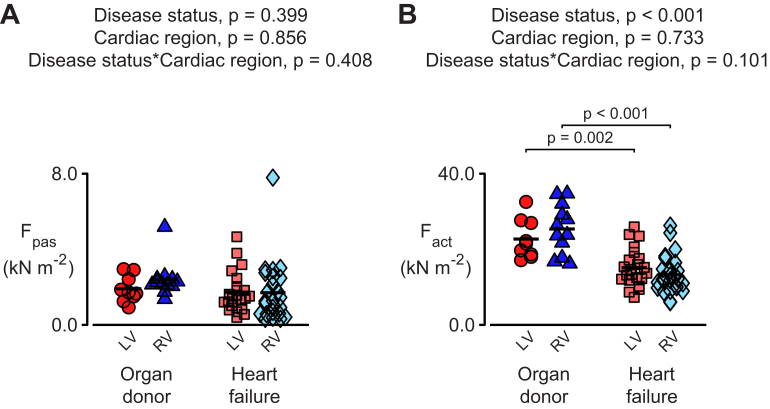
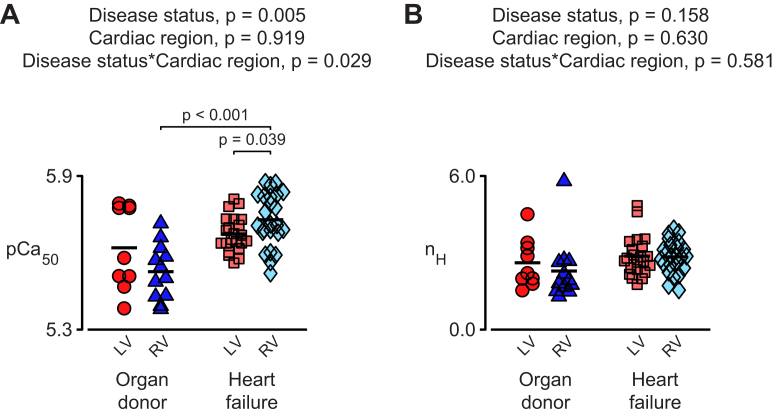
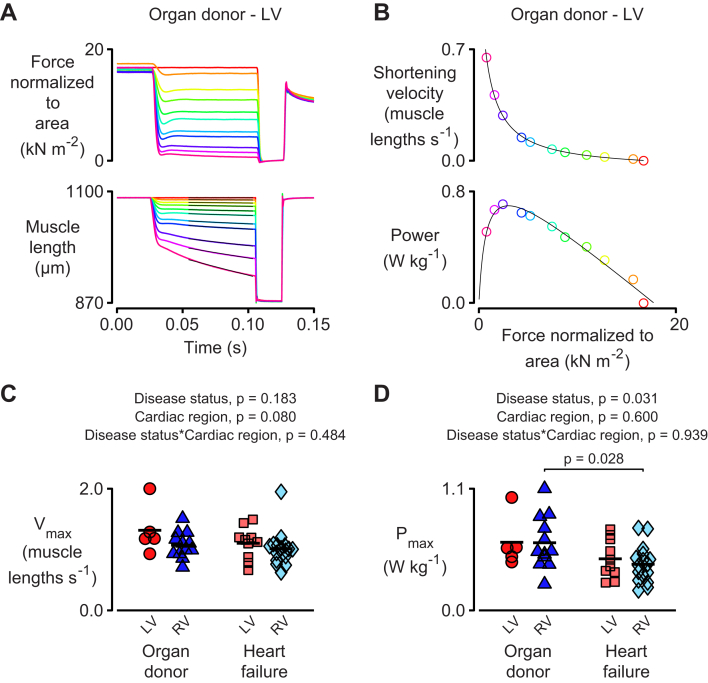
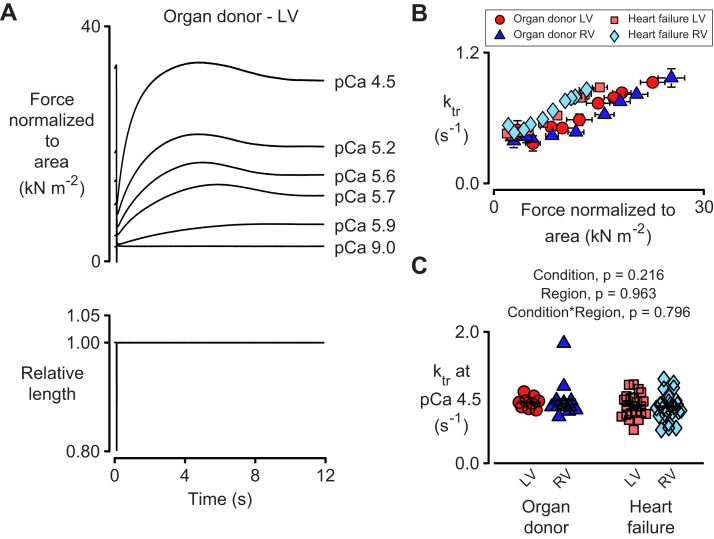
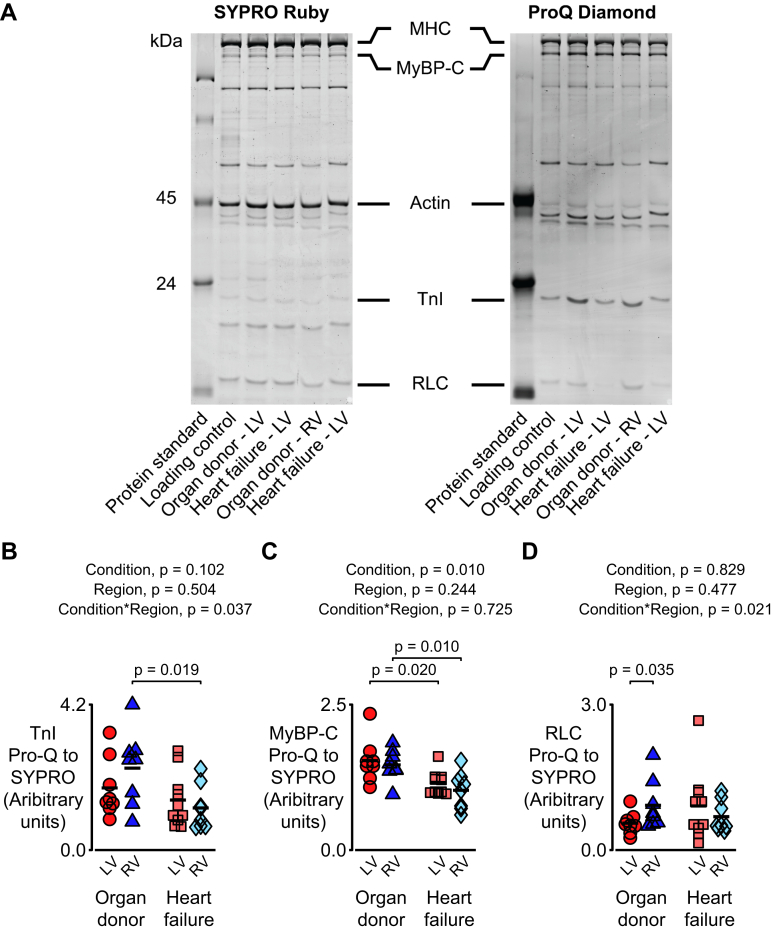
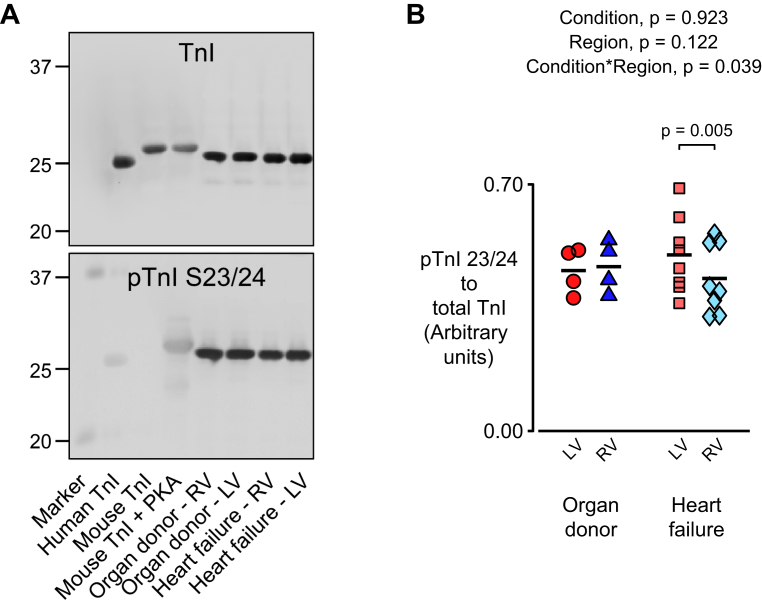
This study measured how heart failure affects the contractile properties of the human myocardium from the left and right ventricles. The data showed that maximum force and maximum power were reduced by approximately 30% in multicellular preparations from both ventricles, possibly because of ventricular remodeling (e.g., cellular disarray and/or excess fibrosis). Heart failure increased the calcium (Ca2+) sensitivity of contraction in both ventricles, but the effect was bigger in right ventricular samples. The changes in Ca2+ sensitivity were associated with ventricle-specific changes in the phosphorylation of troponin I, which indicated that adrenergic stimulation might induce different effects in the left and right ventricles.
Keywords: Ca2+ sensitivity; Ca2+, calcium; Fact, maximum Ca2+-activated force; Fpas, passive force; LV, left ventricle; MyBP-C, myosin binding protein-C; PKA, protein kinase A; Pmax, maximum power output; RLC, regulatory light chain; RV, right ventricle; TnI, troponin I; Vmax, maximum shortening velocity; heart failure; human myocardium; ktr, rate of force recovery; myofilament proteins; nH, Hill coefficient; ventricular function.
© 2020 The Authors.
Figures
Similar articles
-
The contributions of cardiac myosin binding protein C and troponin I phosphorylation to β-adrenergic enhancement of in vivo cardiac function.J Physiol. 2016 Feb 1;594(3):669-86. doi: 10.1113/JP270959. J Physiol. 2016. PMID: 26635197 Free PMC article.
-
Molecule specific effects of PKA-mediated phosphorylation on rat isolated heart and cardiac myofibrillar function.Arch Biochem Biophys. 2016 Jul 1;601:22-31. doi: 10.1016/j.abb.2016.01.019. Epub 2016 Feb 15. Arch Biochem Biophys. 2016. PMID: 26854722 Free PMC article.
-
The R21C Mutation in Cardiac Troponin I Imposes Differences in Contractile Force Generation between the Left and Right Ventricles of Knock-In Mice.Biomed Res Int. 2015;2015:742536. doi: 10.1155/2015/742536. Epub 2015 Apr 16. Biomed Res Int. 2015. PMID: 25961037 Free PMC article.
-
The role of regenerative therapy in the treatment of right ventricular failure: a literature review.Stem Cell Res Ther. 2020 Nov 25;11(1):502. doi: 10.1186/s13287-020-02022-w. Stem Cell Res Ther. 2020. PMID: 33239066 Free PMC article. Review.
-
Thick filament proteins and performance in human heart failure.Heart Fail Rev. 2005 Sep;10(3):187-97. doi: 10.1007/s10741-005-5249-1. Heart Fail Rev. 2005. PMID: 16416042 Review.
Cited by
-
Profiling the Biomechanical Responses to Workload on the Human Myocyte to Explore the Concept of Myocardial Fatigue and Reversibility: Rationale and Design of the POWER Heart Failure Study.J Cardiovasc Transl Res. 2024 Apr;17(2):275-286. doi: 10.1007/s12265-023-10391-9. Epub 2023 May 1. J Cardiovasc Transl Res. 2024. PMID: 37126208 Free PMC article.
-
EMD-57033 Augments the Contractility in Porcine Myocardium by Promoting the Activation of Myosin in Thick Filaments.Int J Mol Sci. 2022 Nov 22;23(23):14517. doi: 10.3390/ijms232314517. Int J Mol Sci. 2022. PMID: 36498844 Free PMC article.
-
Myocardial Fatigue: a Mechano-energetic Concept in Heart Failure.Curr Cardiol Rep. 2022 Jun;24(6):711-730. doi: 10.1007/s11886-022-01689-2. Epub 2022 Mar 30. Curr Cardiol Rep. 2022. PMID: 35353328 Review.
-
Therapeutic targeting of BAG3: considering its complexity in cancer and heart disease.J Clin Invest. 2021 Aug 16;131(16):e149415. doi: 10.1172/JCI149415. J Clin Invest. 2021. PMID: 34396980 Free PMC article. Review.
-
Inducible apelin receptor knockdown reduces differentiation efficiency and contractility of hESC-derived cardiomyocytes.Cardiovasc Res. 2023 Mar 31;119(2):587-598. doi: 10.1093/cvr/cvac065. Cardiovasc Res. 2023. PMID: 36239923 Free PMC article.
References
-
- Wang L., Yu P., Zhou B. Single-cell reconstruction of the adult human heart during heart failure and recovery reveals the cellular landscape underlying cardiac function. Nat Cell Biol. 2020;22:108–119. - PubMed
-
- Friedberg M.K., Redington A.N. Right versus left ventricular failure: differences, similarities, and interactions. Circulation. 2014;129:1033–1044. - PubMed
-
- van der Velden J., de Jong J.W., Owen V.J., Burton P.B., Stienen G.J. Effect of protein kinase A on calcium sensitivity of force and its sarcomere length dependence in human cardiomyocytes. Cardiovasc Res. 2000;46:487–495. - PubMed
Grants and funding
LinkOut - more resources
Full Text Sources
Miscellaneous
