. 2020 Sep 25;48(17):9840-9858.
doi: 10.1093/nar/gkaa715.

Some ASOs that bind in the coding region of mRNAs and induce RNase H1 cleavage can cause increases in the pre-mRNAs that may blunt total activity

Affiliations

Some ASOs that bind in the coding region of mRNAs and induce RNase H1 cleavage can cause increases in the pre-mRNAs that may blunt total activity

Xue-Hai Liang et al. Nucleic Acids Res. .

Abstract

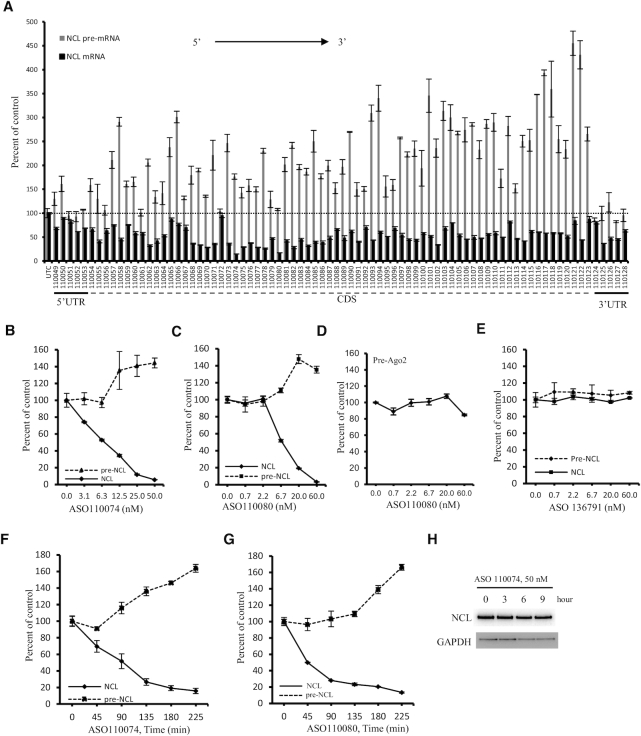
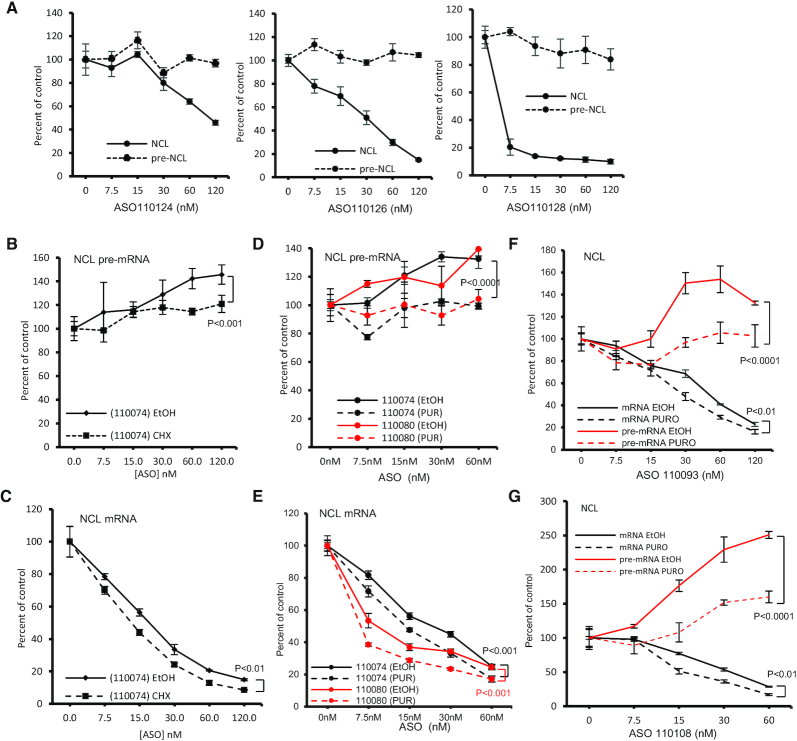
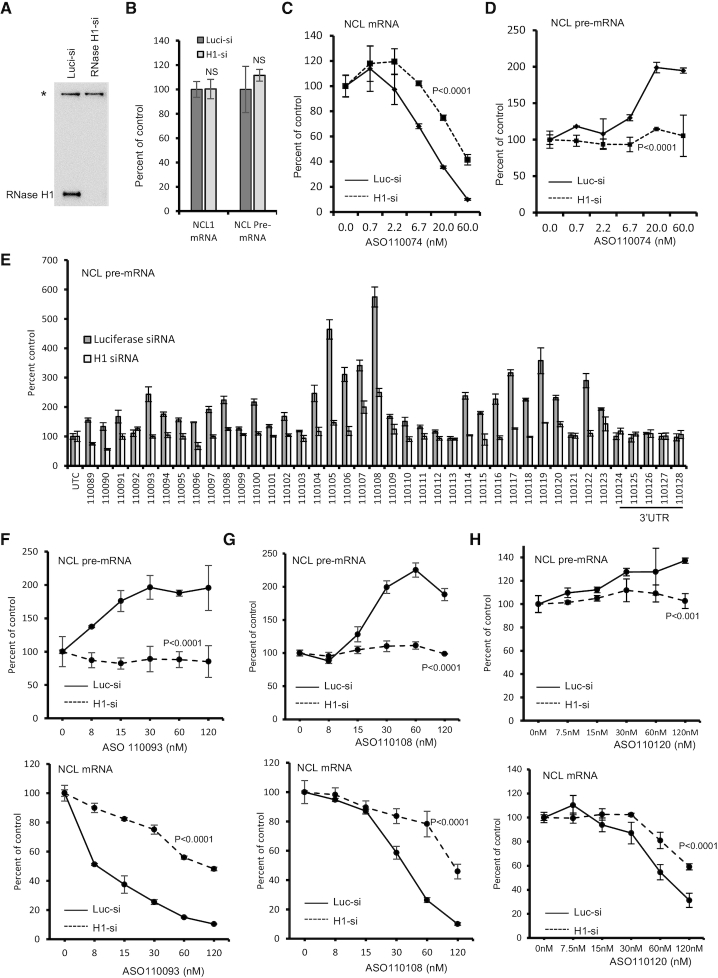
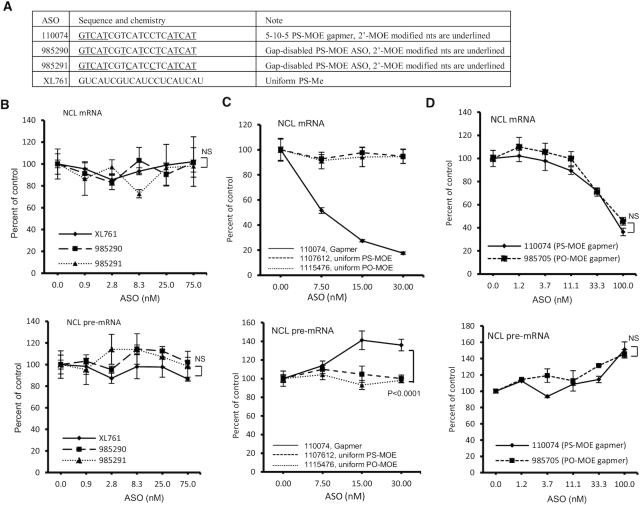
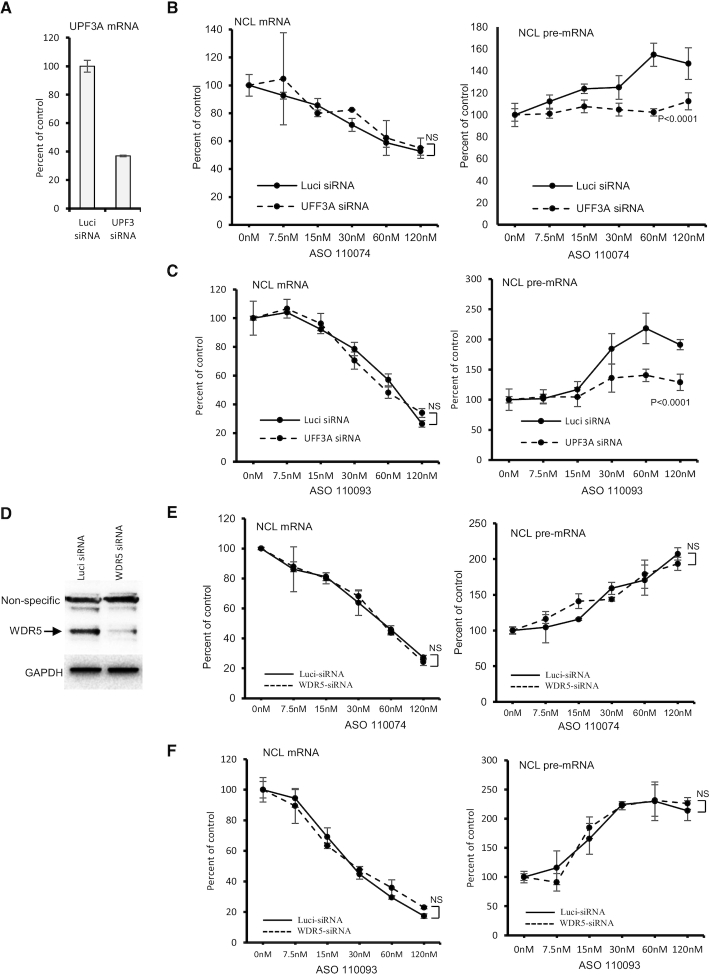
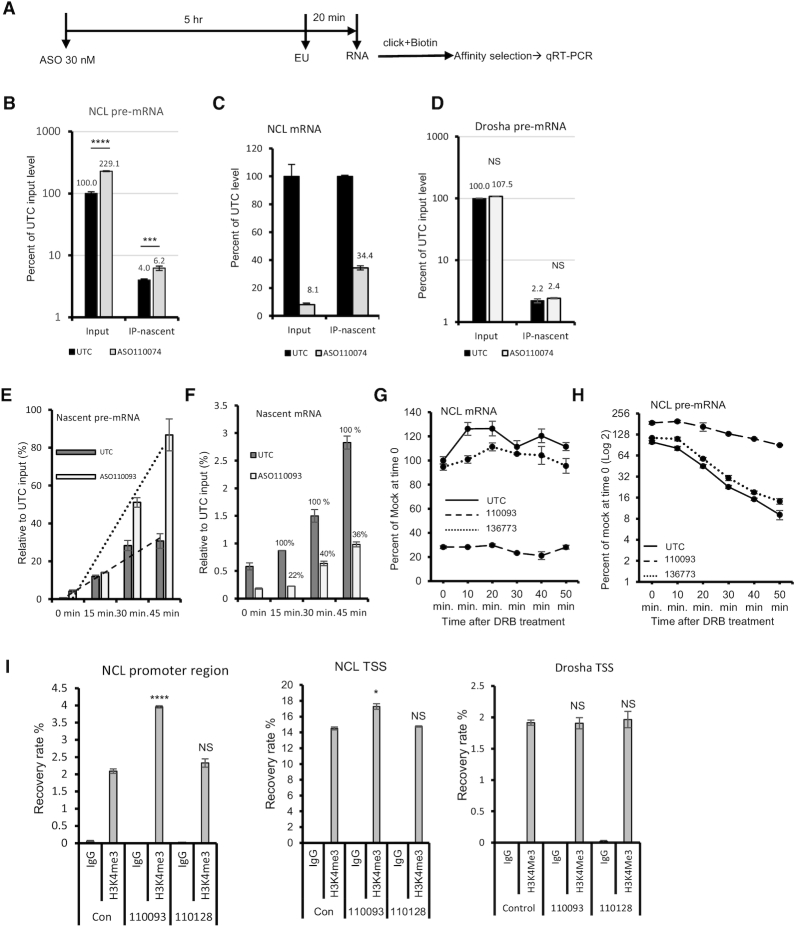
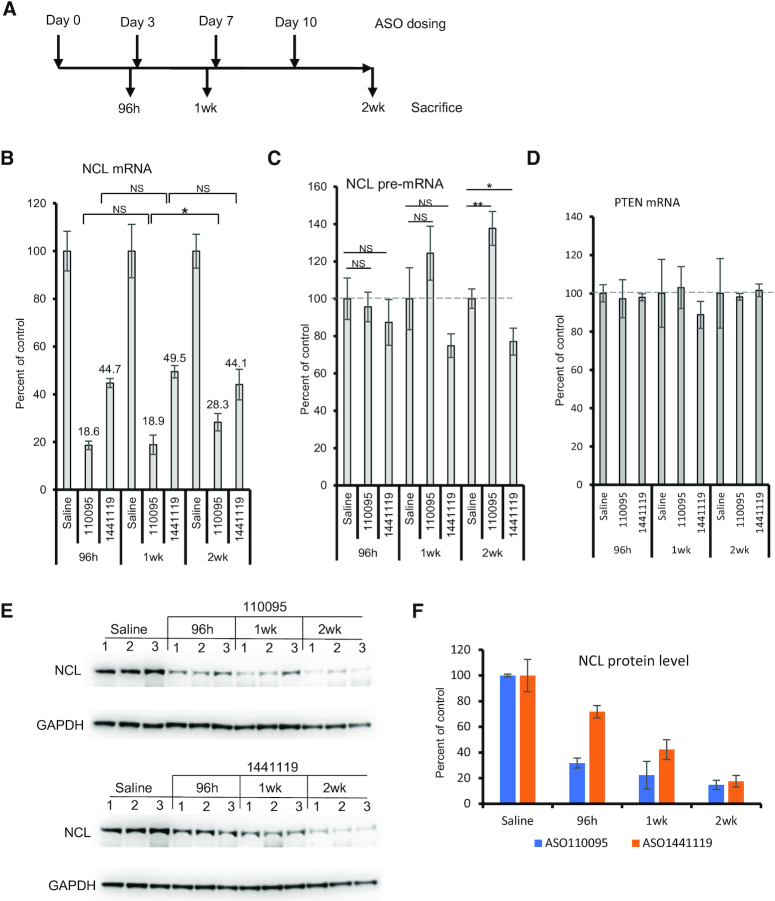
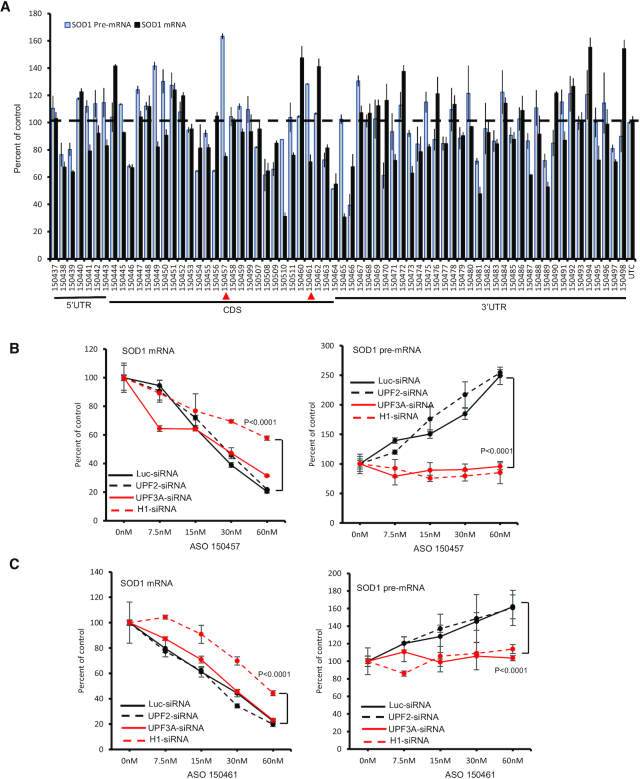
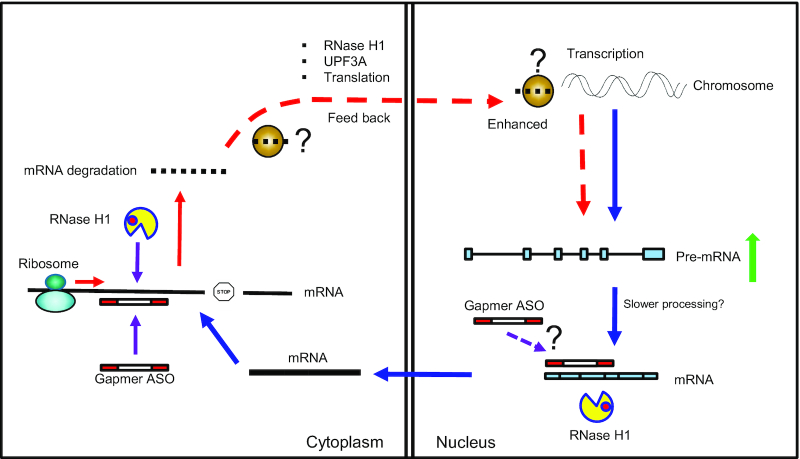
Antisense oligonucleotide (ASO) drugs that trigger RNase H1 cleavage of target RNAs have been developed to treat various diseases. Basic pharmacological principles suggest that the development of tolerance is a common response to pharmacological interventions. In this manuscript, for the first time we report a molecular mechanism of tolerance that occurs with some ASOs. Two observations stimulated our interest: some RNA targets are difficult to reduce with RNase H1 activating ASOs and some ASOs display a shorter duration of activity than the prolonged target reduction typically observed. We found that certain ASOs targeting the coding region of some mRNAs that initially reduce target mRNAs can surprisingly increase the levels of the corresponding pre-mRNAs. The increase in pre-mRNA is delayed and due to enhanced transcription and likely also slower processing. This process requires that the ASOs bind in the coding region and reduce the target mRNA by RNase H1 while the mRNA resides in the ribosomes. The pre-mRNA increase is dependent on UPF3A and independent of the NMD pathway or the XRN1-CNOT pathway. The response is consistent in multiple cell lines and independent of the methods used to introduce ASOs into cells.


Figures

Figure 1.
Figure 1.
Some gapmer ASOs that reduce mRNA levels can increase the levels of pre-mRNA. (A) qRT-PCR quantification of the levels of NCL mRNA and pre-mRNA in HeLa cells transfected with ASOs at 15 nM for 4 h. ASOs targeting 5′ UTR, CDS, and 3′ UTR are indicated. (B, C) qRT-PCR quantification of NCL mRNA and pre-mRNA levels in HeLa cells transfected with ASO110074 (Panel B) or ASO110080 (Panel C) for 4 h at different concentrations. (D) qRT-PCR quantification of Ago2 pre-mRNA levels in HeLa cells transfected with ASO110080 as in panel C. (E) qRT-PCR quantification of NCL mRNA and pre-mRNA levels in HeLa cells transfected with a control ASO 136791 for 4 h. (F, G) qRT-PCR quantification of NCL mRNA and pre-mRNA levels in HeLa cells transfected with ASO110074 (Panel F) or ASO110080 (Panel G) at 25 nM for different times. (H) Western analysis for the levels of NCL protein in HeLa cells transfected with 25 nM ASO110074 for different times. GAPDH was probed and served as a control for loading. The error bars in each panel are standard deviations from three independent experiments.
Figure 2.
Figure 2.
Pre-mRNA increase induced by gapmer ASOs is translation dependent. (A) qRT-PCR quantification of NCL mRNA and pre-mRNA levels in HeLa cells transfected for 4 h with three different ASOs targeting 3′ UTR of NCL mRNA. (B, C) qRT-PCR quantification of NCL pre-mRNA (panel B) and mRNA (Panel C) levels in HeLa cells transfected with 25 nM ASO110074 for 3 h, followed by treatment with either ethanol (EtOH) or 100 μg/ml CHX for an additional 2 h. (D, E) qRT-PCR quantification of NCL pre-mRNA (Panel D) or mRNA (panel E) levels in HeLa cells transfected with 25 nM ASO110074 or ASO110080 for 3 h, followed by treatment with either ethanol (EtOH) or 40 μg/ml puromycin (PUR) for 2 h. (F) qRT-PCR quantification of NCL mRNA and pre-mRNA levels in HeLa cells transfected for 3 h with 25 nM ASO110093, followed by treatment with ethanol or 40 μg/ml puromycin for 2 h. (G) qRT-PCR quantification of NCL mRNA and pre-mRNA levels in HeLa cells transfected for 3 h with 25 nM ASO110108, followed by treatment with either ethanol or 40 μg/ml puromycin for 2 h. The error bars in each panel are standard deviations from three independent experiments. P values were calculated based on F-test using Prism.
Figure 3.
Figure 3.
Gapmer ASO-induced pre-mRNA increase is RNase H1 dependent. (A) Western analysis of RNase H1 protein level in HeLa cells transfected with 3 nM corresponding siRNAs for 48 h. *, a non-specific band detected by the antibody serves as a control for loading. (B) qRT-PCR quantification of NCL mRNA and pre-mRNA levels in HeLa cells transfected with indicated siRNAs for 48 h, as in panel A. P values were calculated based on t test using prism. NS, not significant. (C, D) qRT-PCR quantification of NCL mRNA (panel C) and pre-mRNA (Panel D) levels in Luciferase siRNA (Luc-si) or RNase H1 siRNA (H1-si) treated HeLa cells that were subsequently transfected with 25 nM ASO110074 for 4 h. (E) qRT-PCR quantification of NCL pre-mRNA levels in Luciferase siRNA or RNase H1 siRNA treated HeLa cells that were subsequently transfected with 25 nM of ASOs for 4 h. (F–H) qRT-PCR quantification of NCL pre-mRNA (upper panels) and mRNA (lower panels) levels in Luciferase siRNA (Luc-si) or RNase H1 siRNA (H1-si) treated HeLa cells that were transfected for 4 h with 25 nM ASO 110093 (Panel F), ASO1110108 (Panel G), or ASO110120 (Panel H). The error bars in each panel are standard deviations from three independent experiments. P values were calculated based on F-test using Prism.
Figure 4.
Figure 4.
Pre-mRNA level was not increased by ASOs that do not support RNase H1 cleavage. (A) ASOs that contain different modifications in the gap region that inactivate RNase H1 cleavage. The sequence and modifications of the ASOs are shown. e, 2′MOE; s, phosphorothioate; mC, 5-mC. The ‘m’ in XL761 represents 2′-OMe. (B) qRT-PCR quantification of NCL mRNA (upper panel) and pre-mRNA (lower panel) levels in HeLa cells transfected with different ASOs for 4 h. (C) qRT-PCR quantification of NCL mRNA (upper panel) and pre-mRNA (lower panel) levels in HeLa cells transfected for 4 h with either the parental gapmer ASO or two ASOs that are uniformly modified with 2′MOE. (D) qRT-PCR quantification of NCL mRNA (upper panel) and pre-mRNA (lower panel) levels in HeLa cells transfected with PS-MOE or PO-MOE gapmer ASOs for 4 h. The error bars in each panel are standard deviations from three independent experiments. P values were calculated based on F-test using Prism. NS, not significant.
Figure 5.
Figure 5.
Reduction of UPF3A attenuated pre-mRNA increase induced by gapmer ASOs. (A) qRT-PCR quantification of UPF3A mRNA in HeLa cells transfected for 48 h with 5 nM control luciferase siRNA or UPF3A specific siRNA (ID10476). (B, C) qRT-PCR quantification of NCL mRNA (left panels) and pre-mRNA (right panels) levels in control cells (Luci) or UPF3A-reduced HeLa cells (UPF3A-siRNA) that were subsequently transfected with ASO110074 (Panel B) or ASO110093 (Panel C) for 4 h. (D) Western analysis for WDR5 protein in control luci-siRNA or WDR5 siRNA treated HeLa cells. GAPDH was probed and served as a control for loading. (E, F) qRT-PCR quantification of NCL mRNA (left panels) and pre-mRNA (right panels) levels in control cells (Luci) or WDR5-reduced HeLa cells (WDR5 siRNA) that were subsequently transfected with ASO110074 (Panel E) or ASO110093 (Panel F) for 4 h. The error bars in each panel are standard deviations from three independent experiments. P values were calculated based on F-test using Prism. NS, not significant.
Figure 6.
Figure 6.
ASO treatment enhanced transcription of NCL gene. (A) Schematic representation of the experimental procedure of EU labeling. (B) qRT-PCR quantification of total and isolated nascent NCL pre-mRNA in control mock treated (UTC) or ASO treated HeLa cells. The relative levels were calculated based on the level of total NCL pre-mRNA in control cells. (C) qRT-PCR quantification of total and isolated nascent NCL mRNA in input total RNAs and in isolated nascent RNA samples. The mRNA levels were relative to that of control (UTC) samples. (D) qRT-PCR quantification of total and isolated nascent Drosha pre-mRNA in control (UTC) or ASO110074 treated HeLa cells. The relative levels were calculated based on the level of total Drosha pre-mRNA in control cells. (E) qRT-PCR quantification of isolated nascent NCL pre-mRNA from control cells (UTC) or ASO treated cells that were incubated with EU for different times. The relative levels were calculated based on the level of total NCL pre-mRNA in control cells at time point 0. The trend lines were generated using Excel based on linear regression. (F) qRT-PCR quantification of isolated nascent NCL mRNA from control (UTC) or ASO treated cells that were incubated with EU for different times, as in panel E. The relative levels were calculated based on the level of total NCL mRNA in control cells at time point 0. The percentages of nascent mRNA levels in ASO treated samples relative to the nascent NCL mRNA levels in control cells at the same time points are shown. (G, H) qRT-PCR quantification of NCL mRNA (Panel G) or pre-mRNA (Panel H) from control cells (UTC) or cells transfected with 30 nM ASOs for 4 h followed by treatment with DRB at 200 μM for different times. The relative NCL mRNA and pre-mRNA levels at each time point were calculated based on the level of NCL mRNA and pre-mRNA, respectively, in control cells at time point 0. (I) qRT-PCR quantification of DNA levels co-isolated by ChIP using H3K4me3 antibody or IgG control from cells treated with CDS-targeting ASO 110093 or 3′UTR-targeting ASO 110128. Primer probe sets specific to the promoter and transcription start site (TSS) regions of NCL, or specific to TSS of Drosha, were used. The error bars in each panel are standard deviations from three independent experiments. P values were calculated based on t-test using Prism. NS, not significant.
Figure 7.
Figure 7.
An ASO that caused pre-mRNA increase showed reduced activity after repeated dosing in mice. (A) Timelines of ASO dosing. 100 mg/kg ASO 110093 and 33 mg/kg ASO 1441119 were dosed either once, or twice a week for one or two weeks. In each group, three animals were used. (B–D) qRT-PCR quantification of the levels of NCL mRNA (Panel B), pre-mRNA (Panel C), and PTEN mRNA (panel D) in mouse liver samples. The levels of these RNAs in ASO treated samples were calculated based on the levels in saline treated control mice, and average levels are plotted. The error bars are standard deviations from 3 animals. (E) Western analysis for NCL protein levels in the liver of individual mice (three per group) treated with ASOs at different times. GAPDH was probed and served as a control. (F) quantification of NCL protein levels from panel E. Average levels and standard deviations from 3 animals per group are plotted. P values were calculated based on t test using prism. *P< 0.05; **P< 0.01; NS, not significant.
Figure 8.
Figure 8.
Certain gapmer ASOs targeting SOD1 mRNA can increase SOD1 pre-mRNA levels. (A) qRT-PCR quantification of the levels of SOD1 mRNA and pre-mRNA in HeLa cells transfected with different ASOs at 25 nM for 4 h. ASOs targeting 5′ UTR, CDS, and 3′ UTR are indicated. Two ASOs showing mRNA reduction and pre-mRNA increase are marked with red arrowheads. (B, C) qRT-PCR quantification of SOD1 mRNA (left panels) and pre-mRNA (right panels) levels in cells transfected for 48 h with siRNAs specific to luciferase (luci), UPF2, UPR3A and RNase H1 that were subsequently transfected with ASO150457 (Panel B) or ASO150461 (Panel C) for an additional 4 h. The error bars in each panel are standard deviations from three independent experiments. P values were calculated based on F-test using Prism.
Figure 9.
Figure 9.
Proposed model of gapmer ASO-induced pre-mRNA increase. After transcription, pre-mRNA is processed in the nucleus to mature mRNAs, which are exported to the cytoplasm and are translated by the ribosome. Gapmer ASOs can trigger RNase H1 cleavage of target mRNA in the cytoplasm, though ASO may also degrade nuclear mRNAs. ASO-mediated RNase H1 cleavage of cytoplasmic mRNA by RNase H1 may be recognized by the ribosome when targeting coding region, signaling back to the nucleus to enhance transcription of the corresponding gene, in a UPF3A dependent manner, through unknown factors that provide specificity to the target gene.

Similar articles

Cited by

References

    1. Lima W., Wu H., Crooke S.T.. Crooke S.T. Antisense Drug Technology - Principles, Strategies, and Applications. 2008; 2nd ednBoca Raton: CRC Press; 47–74.
    1. Crooke S.T., Vickers T.A., Lima W.F., Wu H.-J.. Crooke S.T. Antisense Drug Technology - Principles, Strategies, and Applications. 2008; 2nd ednBoca Raton: CRC Press; 3–46.
    1. Crooke S.T., Witztum J.L., Bennett C.F., Baker B.F.. RNA-targeted therapeutics. Cell Metab. 2018; 27:714–739. - PubMed
    1. Pietrzykowski A.Z., Treistman S.N.. The molecular basis of tolerance. Alcohol Res. Health. 2008; 31:298–309. - PMC - PubMed
    1. Liang X.H., Sun H., Nichols J.G., Crooke S.T.. RNase H1-dependent antisense oligonucleotides are robustly active in directing RNA cleavage in both the cytoplasm and the nucleus. Mol. Ther. 2017; 25:2075–2092. - PMC - PubMed

Publication types