Transcriptomic Profiling Identifies Novel Hepatic and Intestinal Genes Following Chronic Plus Binge Ethanol Feeding in Mice
- PMID: 32671585
- PMCID: PMC7669632
- DOI: 10.1007/s10620-020-06461-6
Transcriptomic Profiling Identifies Novel Hepatic and Intestinal Genes Following Chronic Plus Binge Ethanol Feeding in Mice
Abstract
Background: Alcohol-associated liver disease accounts for half of cirrhosis-related deaths worldwide. The spectrum of disease varies from simple steatosis to fibrosis, cirrhosis and ultimately hepatocellular carcinoma. Understanding the disease on a molecular level helps us to develop therapeutic targets.
Aim: We performed transcriptomic analysis in liver and ileum from chronic plus binge ethanol-fed mice, and we assessed the role of selected differentially expressed genes and their association with serum bile acids and gut microbiota.
Methods: Wild-type mice were subjected to a chronic Lieber-DeCarli diet model for 8 weeks followed by one binge of ethanol. RNA-seq analysis was performed on liver and ileum samples. Associations between selected differentially regulated genes and serum bile acid profile or fecal bacterial profiling (16S rDNA sequencing) were investigated.
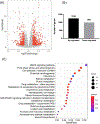
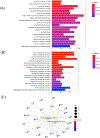
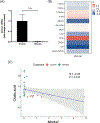
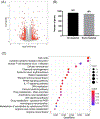
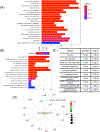
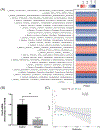
Results: We provide a comprehensive transcriptomic analysis to identify differentially expressed genes, KEGG pathways, and gene ontology functions in liver and ileum from chronic plus binge ethanol-fed mice. In liver, we identified solute carrier organic anion transporter family, member 1a1 (Slco1a1; encoding for organic anion transporting polypeptides (OATP) 1A1), as the most down-regulated mRNA, and it is negatively correlated with serum cholic acid level. Prokineticin 2 (Prok2) mRNA, a cytokine-like molecule associated with gastrointestinal tract inflammation, was significantly down-regulated in ethanol-fed mice. Prok2 mRNA expression was negatively correlated with abundance of Allobaculum (genus), Coprococcus (genus), Lachnospiraceae (family), Lactococcus (genus), and Cobriobacteriaceae (family), while it positively correlated with Bacteroides (genus).
Conclusions: RNA-seq analysis revealed unique transcriptomic signatures in the liver and intestine following chronic plus binge ethanol feeding.
Keywords: 16S rDNA sequencing; Bile acids; Gene expression; Metabolome; Microbiome.
Figures
Similar articles
-
Fat-Specific Protein 27/CIDEC Promotes Development of Alcoholic Steatohepatitis in Mice and Humans.Gastroenterology. 2015 Oct;149(4):1030-41.e6. doi: 10.1053/j.gastro.2015.06.009. Epub 2015 Jun 20. Gastroenterology. 2015. PMID: 26099526 Free PMC article.
-
Fibroblast Growth Factor 19 Alters Bile Acids to Induce Dysbiosis in Mice With Alcohol-Induced Liver Disease.Cell Mol Gastroenterol Hepatol. 2024;18(1):71-87. doi: 10.1016/j.jcmgh.2024.02.015. Epub 2024 Feb 28. Cell Mol Gastroenterol Hepatol. 2024. PMID: 38417701 Free PMC article.
-
Alcohol-related changes in the intestinal microbiome influence neutrophil infiltration, inflammation and steatosis in early alcoholic hepatitis in mice.PLoS One. 2017 Mar 28;12(3):e0174544. doi: 10.1371/journal.pone.0174544. eCollection 2017. PLoS One. 2017. PMID: 28350851 Free PMC article.
-
Alcohol or Gut Microbiota: Who Is the Guilty?Int J Mol Sci. 2019 Sep 14;20(18):4568. doi: 10.3390/ijms20184568. Int J Mol Sci. 2019. PMID: 31540133 Free PMC article. Review.
-
Circadian rhythms, alcohol and gut interactions.Alcohol. 2015 Jun;49(4):389-98. doi: 10.1016/j.alcohol.2014.07.021. Epub 2014 Nov 14. Alcohol. 2015. PMID: 25499101 Free PMC article. Review.
Cited by
-
Multidrug Resistance-Associated Protein 2 Deficiency Aggravates Estrogen-Induced Impairment of Bile Acid Metabolomics in Rats.Front Physiol. 2022 Mar 21;13:859294. doi: 10.3389/fphys.2022.859294. eCollection 2022. Front Physiol. 2022. PMID: 35388287 Free PMC article.
-
Peripheral blood transcriptomic profiling of molecular mechanisms commonly regulated by binge drinking and placebo effects.Sci Rep. 2024 May 10;14(1):10733. doi: 10.1038/s41598-024-56900-x. Sci Rep. 2024. PMID: 38730024 Free PMC article.
-
Elevated Systemic and Intestinal Inflammatory Response Are Associated With Gut Microbiome Disorder After Cardiovascular Surgery.Front Microbiol. 2021 Aug 25;12:686648. doi: 10.3389/fmicb.2021.686648. eCollection 2021. Front Microbiol. 2021. PMID: 34512565 Free PMC article.
-
Chronic binge drinking-induced susceptibility to colonic inflammation is microbiome-dependent.Gut Microbes. 2024 Jan-Dec;16(1):2392874. doi: 10.1080/19490976.2024.2392874. Epub 2024 Aug 20. Gut Microbes. 2024. PMID: 39163515 Free PMC article.
-
Probiotics attenuate alcohol-induced muscle mechanical hyperalgesia: Preliminary observations.Mol Pain. 2022 Jan-Dec;18:17448069221075345. doi: 10.1177/17448069221075345. Mol Pain. 2022. PMID: 35189754 Free PMC article.
References
Publication types
MeSH terms
Substances
Grants and funding
LinkOut - more resources
Full Text Sources

