. 2020 Aug;22(8):934-946.
doi: 10.1038/s41556-020-0542-8. Epub 2020 Jul 13.

Persistence of a regeneration-associated, transitional alveolar epithelial cell state in pulmonary fibrosis

Affiliations

Persistence of a regeneration-associated, transitional alveolar epithelial cell state in pulmonary fibrosis

Yoshihiko Kobayashi et al. Nat Cell Biol. 2020 Aug.

Abstract

Stem cells undergo dynamic changes in response to injury to regenerate lost cells. However, the identity of transitional states and the mechanisms that drive their trajectories remain understudied. Using lung organoids, multiple in vivo repair models, single-cell transcriptomics and lineage tracing, we find that alveolar type-2 epithelial cells undergoing differentiation into type-1 cells acquire pre-alveolar type-1 transitional cell state (PATS) en route to terminal maturation. Transitional cells undergo extensive stretching during differentiation, making them vulnerable to DNA damage. Cells in the PATS show an enrichment of TP53, TGFβ, DNA-damage-response signalling and cellular senescence. Gain and loss of function as well as genomic binding assays revealed a direct transcriptional control of PATS by TP53 signalling. Notably, accumulation of PATS-like cells in human fibrotic lungs was observed, suggesting persistence of the transitional state in fibrosis. Our study thus implicates a transient state associated with senescence in normal epithelial tissue repair and its abnormal persistence in disease conditions.


Conflict of interest statement

Competing interests

The authors declare the following competing interests: A provisional patent application related to this work has been filed. Y.K., A.T., A.K., and P.R.T. are listed as co-inventors on this application; P.R.T. serves as a consultant for Cellarity Inc. not related to this work.

Figures
Extended Data 1.
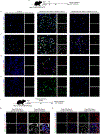
Extended Data 1.. scRNA-seq identifies distinct alveolar cell populations in organoid cultures and LPS treated lungs in vivo.
a, Representative gating for FACS sorting of Sftpc-tdTomato+ AEC2s and PDGFRα+ fibroblasts utilized for organoid cultures. Singlet cells were used for further gating based on antibody staining (CD31, CD45 and PDGFRα) or tdTomato expression. Unstained control is shown in left bottom. b, Pearson correlation plot visualizes the number of genes per cell (nGene) and unique molecular identifier (nUMI) in total cells derived from alveolar organoids (left panel, 10,948 cells). UMAP shows major cell populations including epithelial cells (green, 5,163 cells), fibroblasts (red, 5,686 cells), and some minor populations such as endothelial cells (blue, 66 cells) and macrophages (purple, 33 cells) in alveolar organoids (right panel). c, Integrated UMAP showing cells derived from alveolar organoids (orange, 4,787 cells), in vivo homeostatic mouse lung (blue, 1,878 cells) and LPS-treated mouse lung (magenta, 14,323 cells) (left). Expression of indicated genes in the integrated UMAP (right). d and e, UMAP plots show the expression of indicated genes in AEC2, AEC2-proliferating, AEC1, and transitional alveolar epithelial cell state in alveolar organoid scRNA-seq dataset (d, 4,573 cells) and LPS treated or control lungs (13,204 cells). In panel e, UMAP shows homeostatic (red) and LPS-treated (blue) lung.
Extended Data 2.
Extended Data 2.. Expression pattern of transitional alveolar epithelial cell state enriched genes in organoids and LPS or bleomycin treated lungs in vivo.
a, Schematic of bleomycin-induced lung injury in Ctgf-GFP mice. b, Immunostaining for Ctgf-GFP (green), KRT8 (red) and SFTPC (grey) in control lung (left) and bleomycin treated lungs on day-12 (right). n=3 mice. Magnified single channel images are shown on the right. White line box indicates magnified region. c, Proximity ligation in situ hybridization analysis for Ctgf (grey) and Sftpc (green) on sections derived from Sftpc-tdTomato mice administered with bleomycin. Red arrows indicate Ctgf+tdTomato+Sftpc- cells. Green arrows indicate Ctgf+tdTomato+Sftpc+ cells. d, Violin plots show the expression of Krt8 and Sfn in epithelial cell populations derived from alveolar organoid (left, 4,573 cells) and LPS -injured lung scRNA-seq datasets (right, 13,204 cells). Violin plots indicate distribution of the cells. Scale bars: 30 μm.
Extended Data 3.
Extended Data 3.. Expression of markers specific to the transitional alveolar population in AEC1-specific ablation mouse model and pneumonectomy-induced alveolar regeneration.
a, Experimental design to ablate AEC1 cells using Ager-CreER;R26R-DTR mouse model. b-e, Immunostaining for b) SFN (green) and LGALS3 (grey) or c) SFTPC (green) and LGALS3 (grey) or d) SFN (green) and KRT19 (red) or e) LGALS3 (green) and Ki67 (red) in control (left panel) and AEC1-ablated lungs on day 6 (middle panel) and day 28 (right panel). f, Schematic of AEC2 lineage tracing using Sftpc-CreER;R26R-tdTomato mice follow by pneumonectomy (PNX) and tissue collection on day 9. g, Immunostaining for SFN (green), Sftpc-tdt (red) and LGALS3 (grey) in center (left panel) and edge (right panel) of the lungs after pneumonectomy. h, immunostaining for CLDN4 (green), Sftpc-tdt (red) and LGALS3 (grey) (right panel) in center (left panel) and edge (right panel) of the lungs after pneumonectomy. DAPI stains nuclei (blue). Scale bars indicate 20 μm. Images in b-e, g and h are representative from three mice repeated independently with similar results.
Extended Data 4.
Extended Data 4.. Expression pattern of PATS and AEC1 markers in Krt19-lineage traced lungs during alveolar regeneration.
a, Immunostaining for KRT8 (green), Krt19-tdt (red) and SFTPC (grey) (left panel) or AQP5 (grey) (right panel) in control (upper panel) and bleomycin-treated lungs (lower panel). Scale bars indicate 30 μm. n=3 mice. b. Quantification of KRT8+Krt19-tdt+ cells in total Krt19-tdt+ cells. p=0.0318, (one-tailed, Mann-Whitney). n=3 mice. c, Dotted lines indicates the methodology used for quantification of AGER+ cells. n=3 mice. d. Quantification of AGER+Krt19-tdt+ cells in total Krt19-tdt+ cells p=0.0318 (one-tailed, Mann-Whitney). n=3 mice. Data are from three independent experiments and are presented as mean ± s.e.m. White boxed inset indicates individual color channels shown on the right. DAPI stains nuclei (blue).
Extended Data 5.
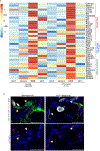
Extended Data 5.. Signalling pathways enriched in murine PATS.
a, Heatmap shows expression of known target genes of indicated signalling pathways in AEC2, proliferating AEC2 (AEC2pro), PATS and AEC1 in alveolar organoids (4,573 cells) and LPS-treated murine lung (13,204 cells). Scale indicates z-score where red is high, and blue is low. b, Immunostaining for YAP (red), Ctgf-GFP (green) and LGALS3 (grey) in bleomycin-treated mouse lung (left) and AEC1-ablated lung (right). Arrowheads indicate YAP expression in Ctgf-GFP+ cells. DAPI stains nuclei (blue). Scale bars indicate 25μm. n=3 mice.
Extended Data 6.
Extended Data 6.. Genetic and pharmacological modulation of TP53 signalling in organoid cultures and during alveolar regeneration in vivo.
a, Schematic of alveolar organoid culture treated with Nutlin-3a. b, Immunostaining for Ki67 (green) and AGER (grey) in control or Nutlin-3a treated alveolar organoids. Scale bar: 30 μm. c, Schematic representation of experimental design to delete Trp53 in AEC2s followed by bleomycin-induced lung injury in Sftpc-tdt;Trp53+/+ and Sftpc-tdt;Trp53fl/fl. d, Immunostaining for SFTPC (green), Sftpc-tdt (red) and AGER (grey) in lungs that show normal appearing regions in bleomycin treated TP53 deleted (Sftpc-tdt;Trp53fl/f) mice. e, Immunostaining for active Caspase 3 (green), Sftpc-tdt (red) and AGER (grey) in control (Sftpc-tdt;Trp53+/+) and TP53 deleted (Sftpc-tdt;Trp53fl/fl) mice. Scale bars: 100 μm. DAPI stains nuclei (blue). Images from b, d and e are representative from three mice repeated independently with similar results.
Extended Data 7.
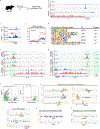
Extended Data 7.. Transcriptional control of PATS by TP53 signalling.
a, Schematic of bleomycin-induced lung injury in Ctgf-GFP mice. b,c, IGV tracks show presence or absence of H3K4me3 and H3K36me3 marks in Fn1 (b) and Sftpc gene loci (c) in AEC2 and PATS. d, Distribution of H3K4me3 peaks in PATS marker gene loci in PATS (red line) and homeostatic AEC2s (blue line). e, Enriched TF motifs in H3K4me3 called peaks in PATS specific gene loci (n=2, enrichment was detected using HOMER’s findMotifsGenome.pl). f,g, Enrichment for H3K4me3, H3K27ac and H3K36me3 in known TP53 target gene loci (Fas and Mdm2) in PATS compared to AEC2s. Arrowhead indicates location of predicted TP53 binding motifs. Green-shade regions are promoter or enhancer. h, Representative gating for FACS sorting of PATS utilized for ChIP-seq. Ctgf-GFP+/Sftpc-tdTomato+ cells are sorted from Bleomycin-treated mouse lung as PATS. i-l, IGV tracks show significant enrichment for TP53 binding in genomic loci corresponding to known targets of TP53 (i), PATS enriched genes (j) but not on AEC1 (k) and AEC2 (l) gene loci.
Extended Data 8.
Extended Data 8.. Markers specific to PATS-like cells are highly enriched in human fibrotic lungs compared to healthy lungs.
a, Heatmap shows expression of marker genes of each cell population in human lungs (scale shows z-score, 11,725 cells). b, UMAP plots show the expression of indicated genes in alveolar epithelial populations in heathy controls and fibrotic human lungs (11,725 cells). c, Hematoxylin and Eosin staining on IPF lung tissue sections. Representative image depicting fibrotic (red square box) and non-fibrotic (blue square box) regions in IPF lung. Scale bar indicates 200 μm. d-g, Immunostaining for PATS-like markers in non-fibrotic regions of IPF lungs. d, Immunostaining for SFN (green), CLDN4 (red) and AGER (grey). e, Immunostaining for SFN (green), KRT17 (red) and TP63 (grey). f, Immunostaining for SFN (green), TP63 (blue), HTII-280 (grey) and ACTA2 (red) in healthy (left panel) and IPF lungs (right panel). g, Immunostaining for SFN (green), HTII-280 (red) and AGER (grey) in healthy (left panel) and IPF (right panel) lung. h, Immunostaining for ACTA2 (green), SFN (red) and COL1A1 (grey) in IPF lung. White line box in merged images indicate region of single channel images shown on right. DAPI (blue) stains nuclei. Scale bars in d-h indicate 100 μm. Images from c, d, e, f, g and h are representative from four humans repeated independently with similar results.
Extended Data 9.
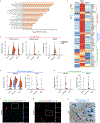
Extended Data 9.. scRNA-seq analysis revealed enrichment of signalling pathways associated with PATS-like cells in human fibrotic lungs.
a, KEGG pathway enrichment analysis shows signalling pathways highly represented in PATS-like cells in human fibrotic lungs. Scale shows log2 (combined score) obtained from Enrichr (see methods section for details). b, Heatmap shows expression of known target genes of indicated signalling pathways in AEC1, AEC2, and PATS-like state (11,725 cells). Scale indicates z-score where red is high, and blue is low. c-e Violin plots show the relative gene expression levels of indicated pathways/cellular processes: p53 signalling (c), DNA damage checkpoint (d), and cellular senescence (e) in different cell types in control and IPF lungs (11,725 cells). Violin bodies indicate distribution of the cells in Healthy (blue) and IPF (red) lungs. f, Immunostaining for p21 (green), ACTA2 (red), SFN (blue) and KRT17 (grey). n=3 repeated independently with similar results. g, Immunostaining for γH2AX (green), SFN (blue), ACTA2 (red) and HTII-280 (grey) in healthy human lung. n=3 repeated independently with similar results. h, β-galactosidase staining on IPF lung section. Black arrows indicate X-gal staining in epithelial cells. n=4 repeated independently with similar results. White line box in merged images indicate region of single channel images shown on right. DAPI (blue) stains nuclei. Scale bars in b-i indicate 100 μm.
Extended Data 10.
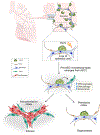
Extended Data 10.. Schematic describing emergence of a transitional cell state in alveolar stem cell-mediated epithelial regeneration and its persistence in disease pathogenesis.
Alveolar stem cells replicate in response to damage and generate a transitional cell state which normally matures into functional alveolar type-1 epithelial cells. The newly identified transitional state is directly regulated by TP53 signalling, vulnerable to DNA damage and undergoes a transient senescent state. This transitional state is enriched in human fibrotic lungs.
Figure 1.
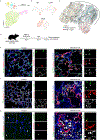
Figure 1.. scRNA-seq reveals previously unknown alveolar epithelial cell states in ex vivo organoids.
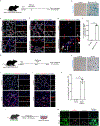
a, Schematic of alveolar organoid culture utilized for single-cell RNA-seq. b, Uniform manifold approximation and projection (UMAP) visualization of epithelial populations in cultured alveolar organoids (4,573 cells). AEC2 (green, 3,303 cells) – alveolar epithelial type-2 cells, AEC2-proliferating (purple, 696 cells) – proliferating alveolar epithelial type-2 cells, AEC1 (yellow, 262 cells) – alveolar epithelial type-1 cells, new cell states : Lgals3+ cells (blue, 184 cells) and Ctgf+ cells (red, 128 cells) c, UMAP plots show the expression of indicated genes in epithelial populations in cultured alveolar organoids. Dotted circles in b and c indicate the transitional cell states. d, Volcano plot shows specific genes enriched in Ctgf+ (n=128 cells) and Lgals3+ (n=184 cells) transitional cell states. Wilcoxon rank sum test was used for the statistical analysis. e, Schematic of alveolar organoid culture using fibroblasts and AEC2 cells. f, Immunostaining for PATS markers in alveolar organoids. Left panel - LGALS3 (green), SFTPC (red) and AGER (grey); middle panel - CLDN4 (green), Sftpc-tdt (red) and AGER (grey); right panel - SOX4 (green), SFTPC (red) and AGER (grey). Image is representative of 30 organoids from three mice. DAPI stains nuclei (blue). Scale bars indicate 20 μm.
Figure 2.
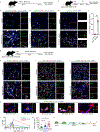
Figure 2.. PATS emerge transiently and originate from alveolar stem cells after lung injury in vivo.
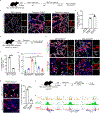
a, Schematic of bleomycin-induced lung injury in Ctgf-GFP mice. b-c, Immunostaining for PATS markers. b, Ctgf-GFP (green), CLDN4 (red) and LGALS3 (grey), c, Ctgf-GFP (green), SFN (red) and LGALS3 (grey) in control lung (upper panel) and bleomycin-treated lungs collected on day 12 after injury (lower panel). Scale bars indicate 30 μm. d, Experimental design to ablate AEC1s in Ager-CreER;R26R-DTR mouse model. Mice were administered tamoxifen (Tmx) followed by diphtheria toxin (DT) and tissues collected on day 6. e, Immunostaining for CLDN4 (green) and LGALS3 (grey) in control (upper panel) and AEC1-ablated lungs (lower panel). Scale bars indicate 20 μm. f, Quantification of elongated LGALS3+ cells in control and AEC1-ablated lungs. ***p<0.0008 (two-tailed, un-paired student’s t-test). n=3 mice. g, Experimental workflow for sequential administration of tamoxifen followed by bleomycin injury and tissue collection for analysis using Sftpc-CreER;R26R-tdTomato mice. h-j, Immunostaining for PATS markers in Sftpc-lineage labeled cell in control (upper panel) and bleomycin injured lungs (lower panel). h, SFTPC (green), Sftpc-tdt (red) and LGALS3 (grey), i, SFN (green), Sftpc-tdt (red) and AGER (grey), and j, CLDN4 (green), Sftpc-tdt (red) and AGER (grey). DAPI stains nuclei (blue). Scale bars indicate 30 μm. White box in merged image indicates region of single channel images. k, Time course of immunostaining for CLDN4 (green), Sftpc-tdt (red) and LGALS3 after bleomycin injury. Scale bars indicate 10 μm. l, Quantification of CLDN4+ cells (green), CLDN4+/LGALS3+ cells (blue) and LGALS3+ cells (red) at different times after injury. n=3 mice. m, Quantification of cell length of CLDN4+ cells (green), CLDN4+/LGALS3+ cells (blue) and LGALS3+ cells (red). *p =0.049 for green vs blue; *p =0.0235 for green vs red (two-tailed un-paired student’s t-test). n=30 cells from three mice. n, Schematic showing transition from AEC2 to AEC1 through different PATS subtypes. Data are from three independent experiments. In f, l, m, data are presented as mean ± s.e.m. Images from b, c, e, h, i, j, k are representative from three mice. h-k experiment was repeated three times independently with similar results.
Figure 3.
Figure 3.. Lineage tracing revealed that PATS generate AEC1.
a, UMAP of epithelial populations in cultured alveolar organoids (4,573 cells). Arrow indicates selected cell populations in the oval-shaped circle are shown in panel b. b, UMAP plots show the expression of indicated genes in the selected populations (oval-shaped circle in panel a, 574 cells). c, RNA velocity analysis for PATS and AEC1. Arrows indicate predicted lineage trajectories. d, Schematic representation of experimental design to sequentially administer bleomycin (injury) or PBS (control) followed by tamoxifen (to label Krt19-expressing cells) in Krt19-CreER;R26R-tdTomato mice. e. Immunostaining for SFTPC (green), Krt19-tdt (red) and AGER (grey). White arrows indicate AGER+Krt19-tdt+ cells. (Scale bar: 30 μm). f, Co-staining for SFN (green), Krt19-tdt (red) and AGER (grey). White arrows indicate SFN+Krt19-tdt+ cells. (Scale bar: 50 μm). g. Immunostaining for CLDN4 (green), Krt19-tdt (red) and LGALS3 (grey). White arrows indicate CLDN4+Krt19-tdt+ cells. Yellow arrowhead indicates LGALS3+Krt19-tdt+ cell. (Scale bar: 30 μm). e-g Control lungs are shown in left panels and bleomycin day 12 injured lungs are shown in right panels. DAPI stains nuclei (blue). White box in merged image indicates region of single channel images shown in left side. Images from e-g are representative from three mice repeated independently with similar results.
Figure 4.
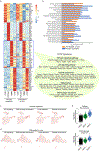
Figure 4.. Gene expression signatures and signalling pathways enriched in PATS
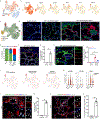
a, Heatmap shows marker gene expression of each cell population in alveolar organoids (left, n=4,573 cells) and in LPS-treated murine lungs (right, n=13,204 cells) (scale shows z-score). Table on the right indicates genes enriched in the indicated pathways and cellular processes specifically in PATS. b, KEGG analysis reveals pathways enriched in PATS. Scale shows log2 (combined score) obtained from web-based tool - Enrichr. c and d, UMAP rendering of PATS enriched signalling pathways and cellular processes in alveolar organoids (c, 4,573 cells) and LPS-treated murine lungs (d, 13,204 cells). e, Violin plots for senescence (upper) panel and DNA damage response pathways (lower panel) in indicated cell populations from LPS-injury model in vivo (n=13,039 cells). Black dots represent cells. Violin bodies indicate distribution of the cells.
Figure 5.
Figure 5.. PATS undergo stretch-induced DNA damage and senescence in vivo and ex vivo
a, Schematic of bleomycin-induced lung injury in Sftpc-CreER;R26RtdTomato mice. b, β-galactosidase staining in bleomycin injured and control lungs. c, Immunostaining for CDKN1A (p21) (green), Sftpc-tdt (red) and AGER (grey). d, Immunostaining for γH2AX (green), Sftpc-tdt (red) and AGER (grey) in control and bleomycin injured lungs. Yellow arrowheads indicate γH2AX+ cells. White dotted lines indicate AEC1 cells and red dotted lines outline tdt+ cells. e, Immunostaining for γH2AX (green), Sftpc-tdt (red) and LGALS3 (grey) in control (upper) and bleomycin-treated lung (lower). f, Quantification of LGALS3+ γH2AX+Sftpc-tdt+ in total γH2AX+Sftpc-tdt+ cells in control and bleomycin injured mice on day-10. Asterisks indicate *p<0.0318 (one-tailed, Mann-Whitney). n=3 mice. g, Schematic of AEC1 ablation using diphtheria toxin (DT). h, β-galactosidase staining in DT-treated and control lungs. i, Immunostaining for CDKN1A (p21) (green), LGALS3 (red) and AGER (grey). j, Immunostaining for γH2AX (green), LGALS3 (red) and AGER (white) in control (upper panel) and DT-treated lungs collected on day-6 after injury (lower panel). k, Quantification of LGALS3+γH2AX+ cells in total γH2AX+ cells in control and DT-treated lung. *p=0.0318. (one-tailed, Mann-Whitney). n=3 mice. l, Schematic of 2D culture of AEC2. m, Immunostaining for SFTPC-GFP (green), γH2AX (red) and AGER (grey) in 2D culture of AEC2. White arrows indicate cells with DNA damage marker. Insets on the right side in all panels show individual fluorescence channels of region indicated by dotted line boxes. DAPI stains nuclei (blue). Data are from three independent experiments and are presented as mean ± s.e.m. Images from b, c, d, e, h, i, j, m are representative from three mice repeated independently with similar results. Scale bar: 100μm in b and h; 50μm in c and d; 30μm in e and m; 20μm in i and j.
Figure 6.
Figure 6.. Genetic and pharmacological modulation and genomic binding assays reveal transcriptional control of PATS by TP53 signalling
a. Experimental workflow for sequential administration of tamoxifen followed by PBS or bleomycin (d0) administration and Nutlin-3a or DMSO treatment (d8–18) and tissue collection (d20) for analysis using Sftpc-CreER;R26R-tdTomato mice. b, Immunostaining for SFTPC (green), Sftpc-tdt (red) and AGER (grey) in PBS+Nutlin-3a (left panel), bleomycin+DMSO (middle panel) and bleomycin+Nutlin-3a (right panel) treated mice. Scale bar: 100 μm. c, Quantification of AGER+Sftpc-tdt+ cells in total Sftpc-tdt+ Cells. *p = 0.0201; (two-tailed, unpaired t-test). n=3 mice. d. Experimental workflow for sequential administration of tamoxifen to delete TP53 in AEC2 cells followed by bleomycin injury (d0) in Sftpc-CreER;R26R-tdTomato;Trp53fl/fl or control mice (Sftpc-CreER;R26R-tdTomato;Trp53+/+). e, Immunostaining for SFTPC (green), Sftpc-tdt (red) and AGER (grey) (upper panel) and CLDN4 (green), Sftpc-tdt (red) and LGALS3 (grey) (lower panel) in control (left panel) and Trp53 knockout (right panel) mice. Scale bar: 30 μm. f, Quantification of AGER+Sftpc-tdt+ cells in total Sftpc-tdt+. ****p<0.0001 (two-tailed, un-paired student’s t-test). n=3 mice. g, Quantification of CLDN4+ cells (green), CLDN4+/LGALS3+ cells (blue) and LGALS3+ cells (red) in bleomycin-treated lungs. **p=0.048 (green bars) and **p=0.0013 (red bars) (two-tailed, un-paired student’s t-test). n=3 mice. h, Immunostaining for CDKN1A (p21) (green), Sftpc-tdt (red) and SFN (grey) in control (upper panel) and Trp53 knockout mice treated with bleomycin (lower panel). White arrowheads indicate p21+Sftpc-tdt+ cells. Scale bar: 30 μm. i, Quantification of p21+Sftpc-tdt+ cells in total Sftpc-tdt+ cells. ***p<0.0001 (two-tailed, un-paired student’s t-test). n=3 mice. j, Schematic of bleomycin-induced lung injury in Sftpc-CreER;R26R-tdTomato;Ctgf-GFP mice followed by PATS sorting and ChIP analysis. k, ChIP enrichment for TRP53 (orange), H3K4me3 (active promoter; green) and H3K27ac (active enhancer; red) shown in IGV tracks in Ctgf, (left) Cdkn1a (middle) and Krt19 (right). Blue-shaded regions indicate promoter/enhancer. DAPI stains nuclei (blue). Insets on the right side in all panels show individual fluorescence channels of region indicated by dotted line boxes. Data are from three independent experiments and are presented as mean ± s.e.m. Images from b, e, h are representative from three mice repeated independently with similar results.
Figure 7.
Figure 7.. Enrichment of PATS-like states in IPF suggests persistence of this state in pathological milieu
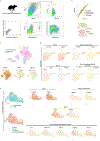
a, UMAP shows scRNA-seq data from AECs in healthy (blue) and IPF (red) lungs (11,725 cells). b, UMAP plots indicate the expression of genes in healthy and IPF lung scRNA-seq data. c, RNA velocity analysis predicts lineage trajectories in AEC populations. Arrows indicates strong RNA velocities. d, Immunostaining for ACTA2 (green), SFN (red) and SFTPC (grey) in healthy, non-fibrotic and severe-fibrotic regions of IPF lungs. e, Quantification of SFTPC+ (green), SFTPC+SFN+ (blue) and SFN+(red) cells in healthy, and non-fibrotic/fibrotic regions in IPF lungs. n=3 human samples. f, Immunostaining for SFN (green), CLDN4 (red) and AGER (grey) in IPF lung. g, Quantification of CLDN4+ cells in SFN+ cells in non-fibrotic and severe fibrotic regions in IPF lungs. *p=0.0218 (one-tailed, Mann-Whitney). n=3 human samples. h, Immunostaining for SFN (green), KRT17 (red) and TP63 (grey) in IPF lung. i, Quantification of KRT17+ cells (red) and KRT17+TP63+ cells (blue) in total SFN+ cells in non-fibrotic regions compared to severe fibrotic regions in IPF lungs. *p=0.0318 (one-tailed, Mann-Whitney). n=3 human samples. j, UMAP plots from scRNA-seq data show enrichment of candidate signalling pathways in healthy and IPF lungs (11,725 cells). k, Violin plots show IPF-relevant gene expression in indicated cell types/states in control and IPF lungs (11,725 cells). Violin plots indicate cells distribution in healthy (blue) and IPF (red) lungs. l, Immunostaining for CDKN1A (p21) (green), ACTA2 (red), SFN (blue) and KRT17 (grey) in IPF lung. Arrows indicate SFN+KRT17+CDKN1A+ cells. m, Quantification of p21+SFN+ in total SFN+ cells. *p=0.0318 (one-tailed, Mann-Whitney). n=3 human samples. n, Immunostaining for γH2AX (green), SFN (blue), HTII-280 (grey) and ACTA2 (red) in IPF lungs. o, Quantification of γH2AX+SFN+ in total SFN+ cells. *p=0.0218 (one-tailed, Mann-Whitney one). healthy human samples n=3, IPF n=4. Inset indicates single channel images shown in right. Data are from at least three lungs and presented as mean±s.e.m. All scale bars indicate 100μm. Images from d,f,h,l,n are representative of three human samples repeated independently with similar results.

Comment in

Similar articles

Cited by

References

    1. Hogan BLM et al. Repair and regeneration of the respiratory system: complexity, plasticity, and mechanisms of lung stem cell function. Cell Stem Cell 15, 123–138 (2014). - PMC - PubMed
    1. Basil MC et al. The Cellular and Physiological Basis for Lung Repair and Regeneration: Past, Present, and Future. Cell Stem Cell 26, 482–502 (2020). - PMC - PubMed
    1. Nabhan A, Brownfield DG, Harbury PB, Krasnow MA & Desai TJ Single-cell Wnt signaling niches maintain stemness of alveolar type 2 cells. Science (2018) doi:10.1126/science.aam6603. - DOI - PMC - PubMed
    1. Barkauskas CE et al. Type 2 alveolar cells are stem cells in adult lung. J. Clin. Invest 123, 3025–3036 (2013). - PMC - PubMed
    1. Desai TJ, Brownfield DG & Krasnow MA Alveolar progenitor and stem cells in lung development, renewal and cancer. Nature 507, 190–194 (2014). - PMC - PubMed

Publication types

Substances