

The brains of aged mice are characterized by altered tissue diffusion properties and cerebral microbleeds
- PMID: 32641073
- PMCID: PMC7346388
- DOI: 10.1186/s12967-020-02441-6
The brains of aged mice are characterized by altered tissue diffusion properties and cerebral microbleeds
Abstract
Background: Brain aging is a major risk factor in the progression of cognitive diseases including Alzheimer's disease (AD) and vascular dementia. We investigated a mouse model of brain aging up to 24 months old (mo).
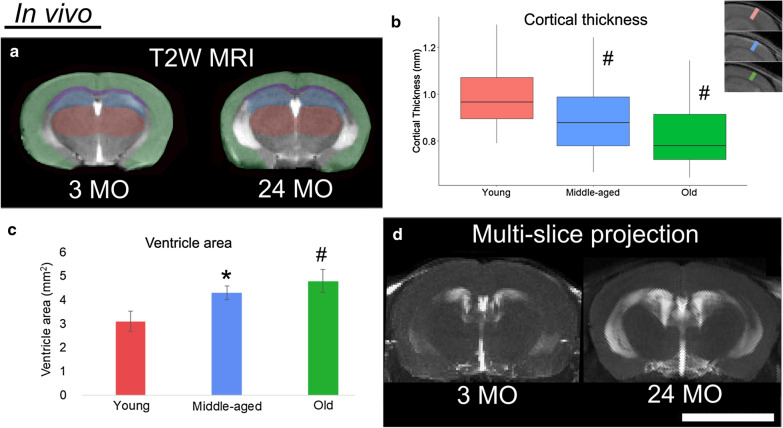
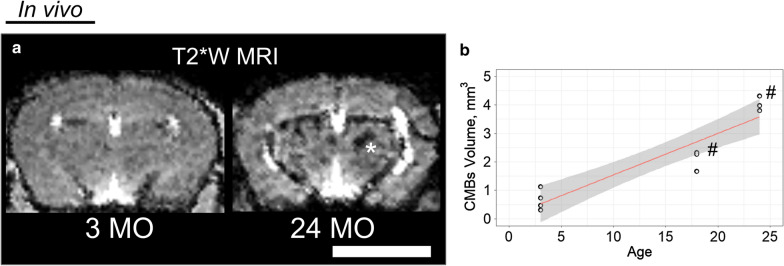
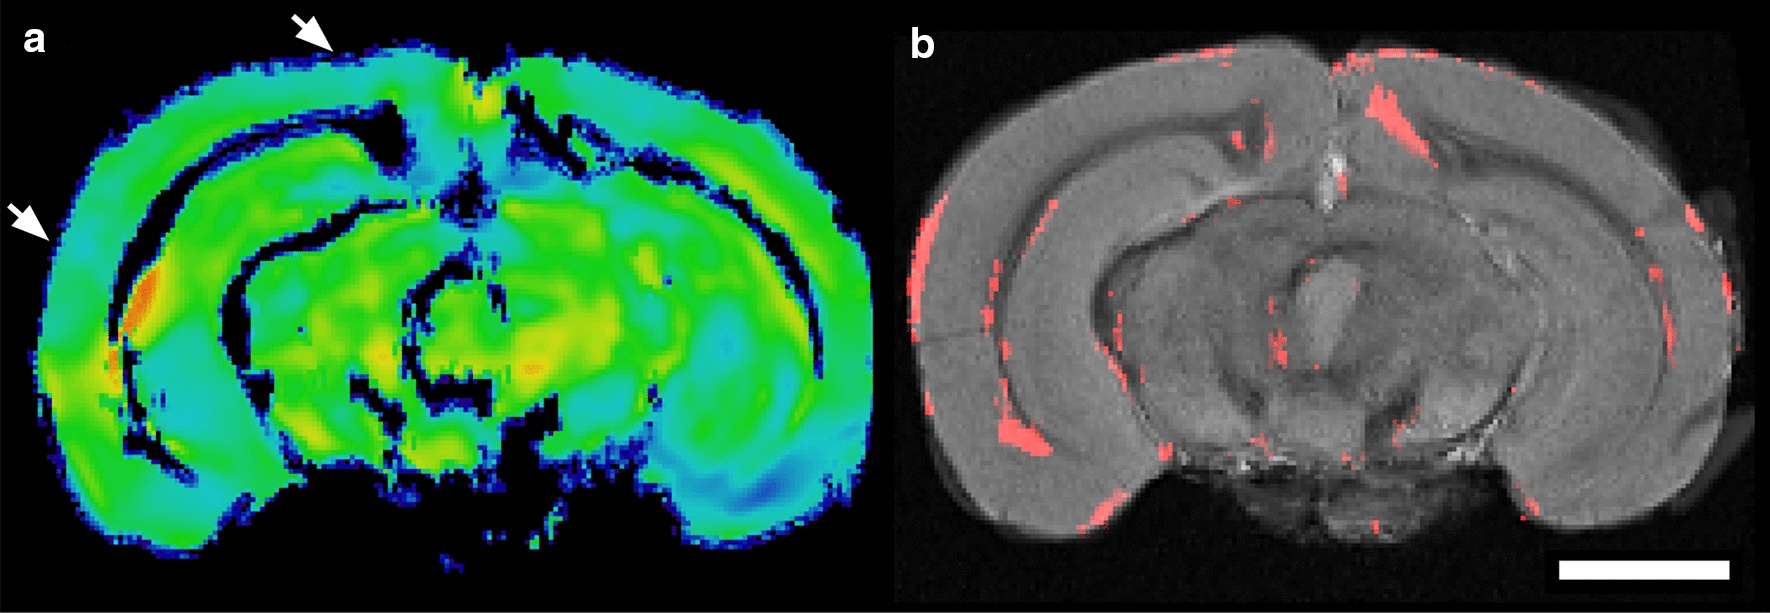
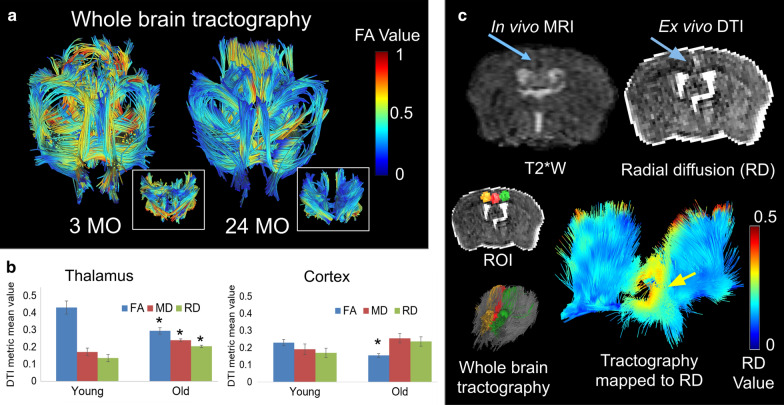
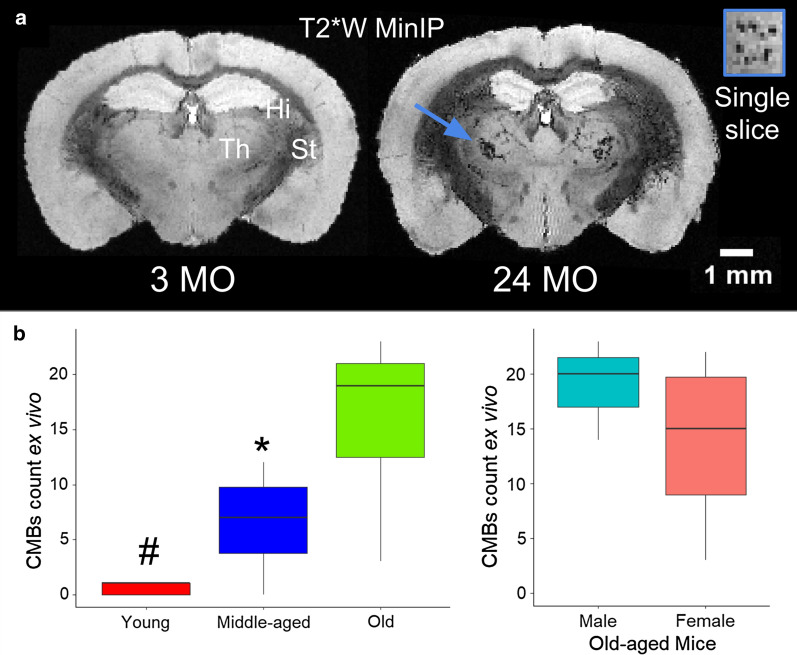
Methods: A high field (11.7T) MRI protocol was developed to characterize specific features of brain aging including the presence of cerebral microbleeds (CMBs), morphology of grey and white matter, and tissue diffusion properties. Mice were selected from age categories of either young (3 mo), middle-aged (18 mo), or old (24 mo) and fed normal chow over the duration of the study. Mice were imaged in vivo with multimodal MRI, including conventional T2-weighted (T2W) and T2*-weighted (T2*W) imaging, followed by ex vivo diffusion-weighted imaging (DWI) and T2*W MR-microscopy to enhance the detection of microstructural features.
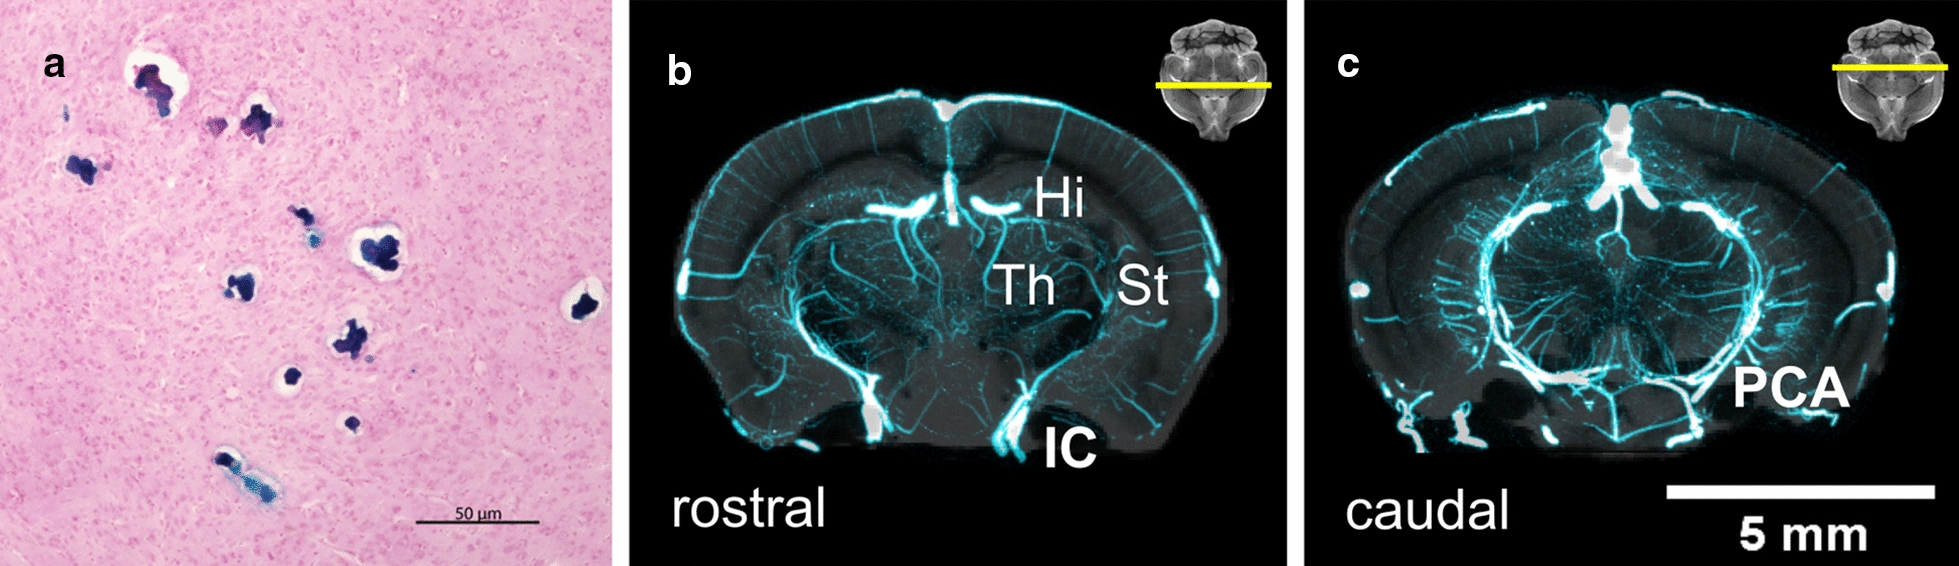
Results: Structural changes observed in the mouse brain with aging included reduced cortical grey matter volume and enlargement of the brain ventricles. A remarkable age-related change in the brains was the development of CMBs found starting at 18 mo and increasing in total volume at 24 mo, primarily in the thalamus. CMBs presence was confirmed with high resolution ex vivo MRI and histology. DWI detected further brain tissue changes in the aged mice including reduced fractional anisotropy, increased radial diffusion, increased mean diffusion, and changes in the white matter fibers visualized by color-coded tractography, including around a large cortical CMB.
Conclusions: The mouse is a valuable model of age-related vascular contributions to cognitive impairment and dementia (VCID). In composite, these methods and results reveal brain aging in older mice as a multifactorial process including CMBs and tissue diffusion alterations that can be well characterized by high field MRI.
Keywords: Aging; Brain imaging; Cerebral microbleeds (CMBs); Gradient-recalled echo MRI, diffusion tensor imaging; Vascular contributions to cognitive impairment and dementia (VCID).
Conflict of interest statement
The authors declare that they have no competing interests.
Figures
Similar articles
-
Risk factors of radiotherapy-induced cerebral microbleeds and serial analysis of their size compared with white matter changes: A 7T MRI study in 113 adult patients with brain tumors.J Magn Reson Imaging. 2019 Sep;50(3):868-877. doi: 10.1002/jmri.26651. Epub 2019 Jan 20. J Magn Reson Imaging. 2019. PMID: 30663150 Free PMC article.
-
Strictly Lobar Cerebral Microbleeds Are Associated with Increased White Matter Volume.Transl Stroke Res. 2020 Feb;11(1):29-38. doi: 10.1007/s12975-019-00704-z. Epub 2019 Apr 29. Transl Stroke Res. 2020. PMID: 31037565
-
Susceptibility-weighted imaging is more reliable than T2*-weighted gradient-recalled echo MRI for detecting microbleeds.Stroke. 2013 Oct;44(10):2782-6. doi: 10.1161/STROKEAHA.113.002267. Epub 2013 Aug 6. Stroke. 2013. PMID: 23920014 Clinical Trial.
-
Cerebral microbleeds, cognitive impairment, and MRI in patients with diabetes mellitus.Clin Chim Acta. 2017 Jul;470:14-19. doi: 10.1016/j.cca.2017.04.019. Epub 2017 Apr 24. Clin Chim Acta. 2017. PMID: 28450131 Review.
-
Cerebral Microbleeds: Imaging and Clinical Significance.Radiology. 2018 Apr;287(1):11-28. doi: 10.1148/radiol.2018170803. Radiology. 2018. PMID: 29558307 Review.
Cited by
-
Membrane remodeling by FAM92A1 during brain development regulates neuronal morphology, synaptic function, and cognition.Nat Commun. 2024 Jul 23;15(1):6209. doi: 10.1038/s41467-024-50565-w. Nat Commun. 2024. PMID: 39043703 Free PMC article.
-
Longitudinal manganese-enhanced magnetic resonance imaging of neural projections and activity.NMR Biomed. 2022 Jun;35(6):e4675. doi: 10.1002/nbm.4675. Epub 2022 Mar 6. NMR Biomed. 2022. PMID: 35253280 Free PMC article. Review.
-
Age and sex differences in primary microglia culture: A comparative study.J Neurosci Methods. 2021 Dec 1;364:109359. doi: 10.1016/j.jneumeth.2021.109359. Epub 2021 Sep 17. J Neurosci Methods. 2021. PMID: 34537225 Free PMC article.
-
Aging disrupts blood-brain and blood-spinal cord barrier homeostasis, but does not increase paracellular permeability.Geroscience. 2024 Oct 30. doi: 10.1007/s11357-024-01404-9. Online ahead of print. Geroscience. 2024. PMID: 39476323
-
Role of the central nervous system in cell non-autonomous signaling mechanisms of aging and longevity in mammals.J Physiol Sci. 2024 Aug 31;74(1):40. doi: 10.1186/s12576-024-00934-3. J Physiol Sci. 2024. PMID: 39217308 Free PMC article. Review.
References
-
- Roberts AW, Ogunwole SU, Blakeslee L, Rabe MA. The population 65 years and older in the United States: 2016. New York: US Department of Commerce, Economics and Statistics Administration; 2018.
-
- Niccoli T, Partridge L. Ageing as a risk factor for disease. Curr Biol. 2012;22:R741–R752. - PubMed
Publication types
MeSH terms
Grants and funding
LinkOut - more resources
Full Text Sources
