. 2020 Aug 6;182(3):770-785.e16.
doi: 10.1016/j.cell.2020.06.020. Epub 2020 Jul 6.

Revealing the Activity of Trimeric G-proteins in Live Cells with a Versatile Biosensor Design

Affiliations

Revealing the Activity of Trimeric G-proteins in Live Cells with a Versatile Biosensor Design

Marcin Maziarz et al. Cell. .

Abstract

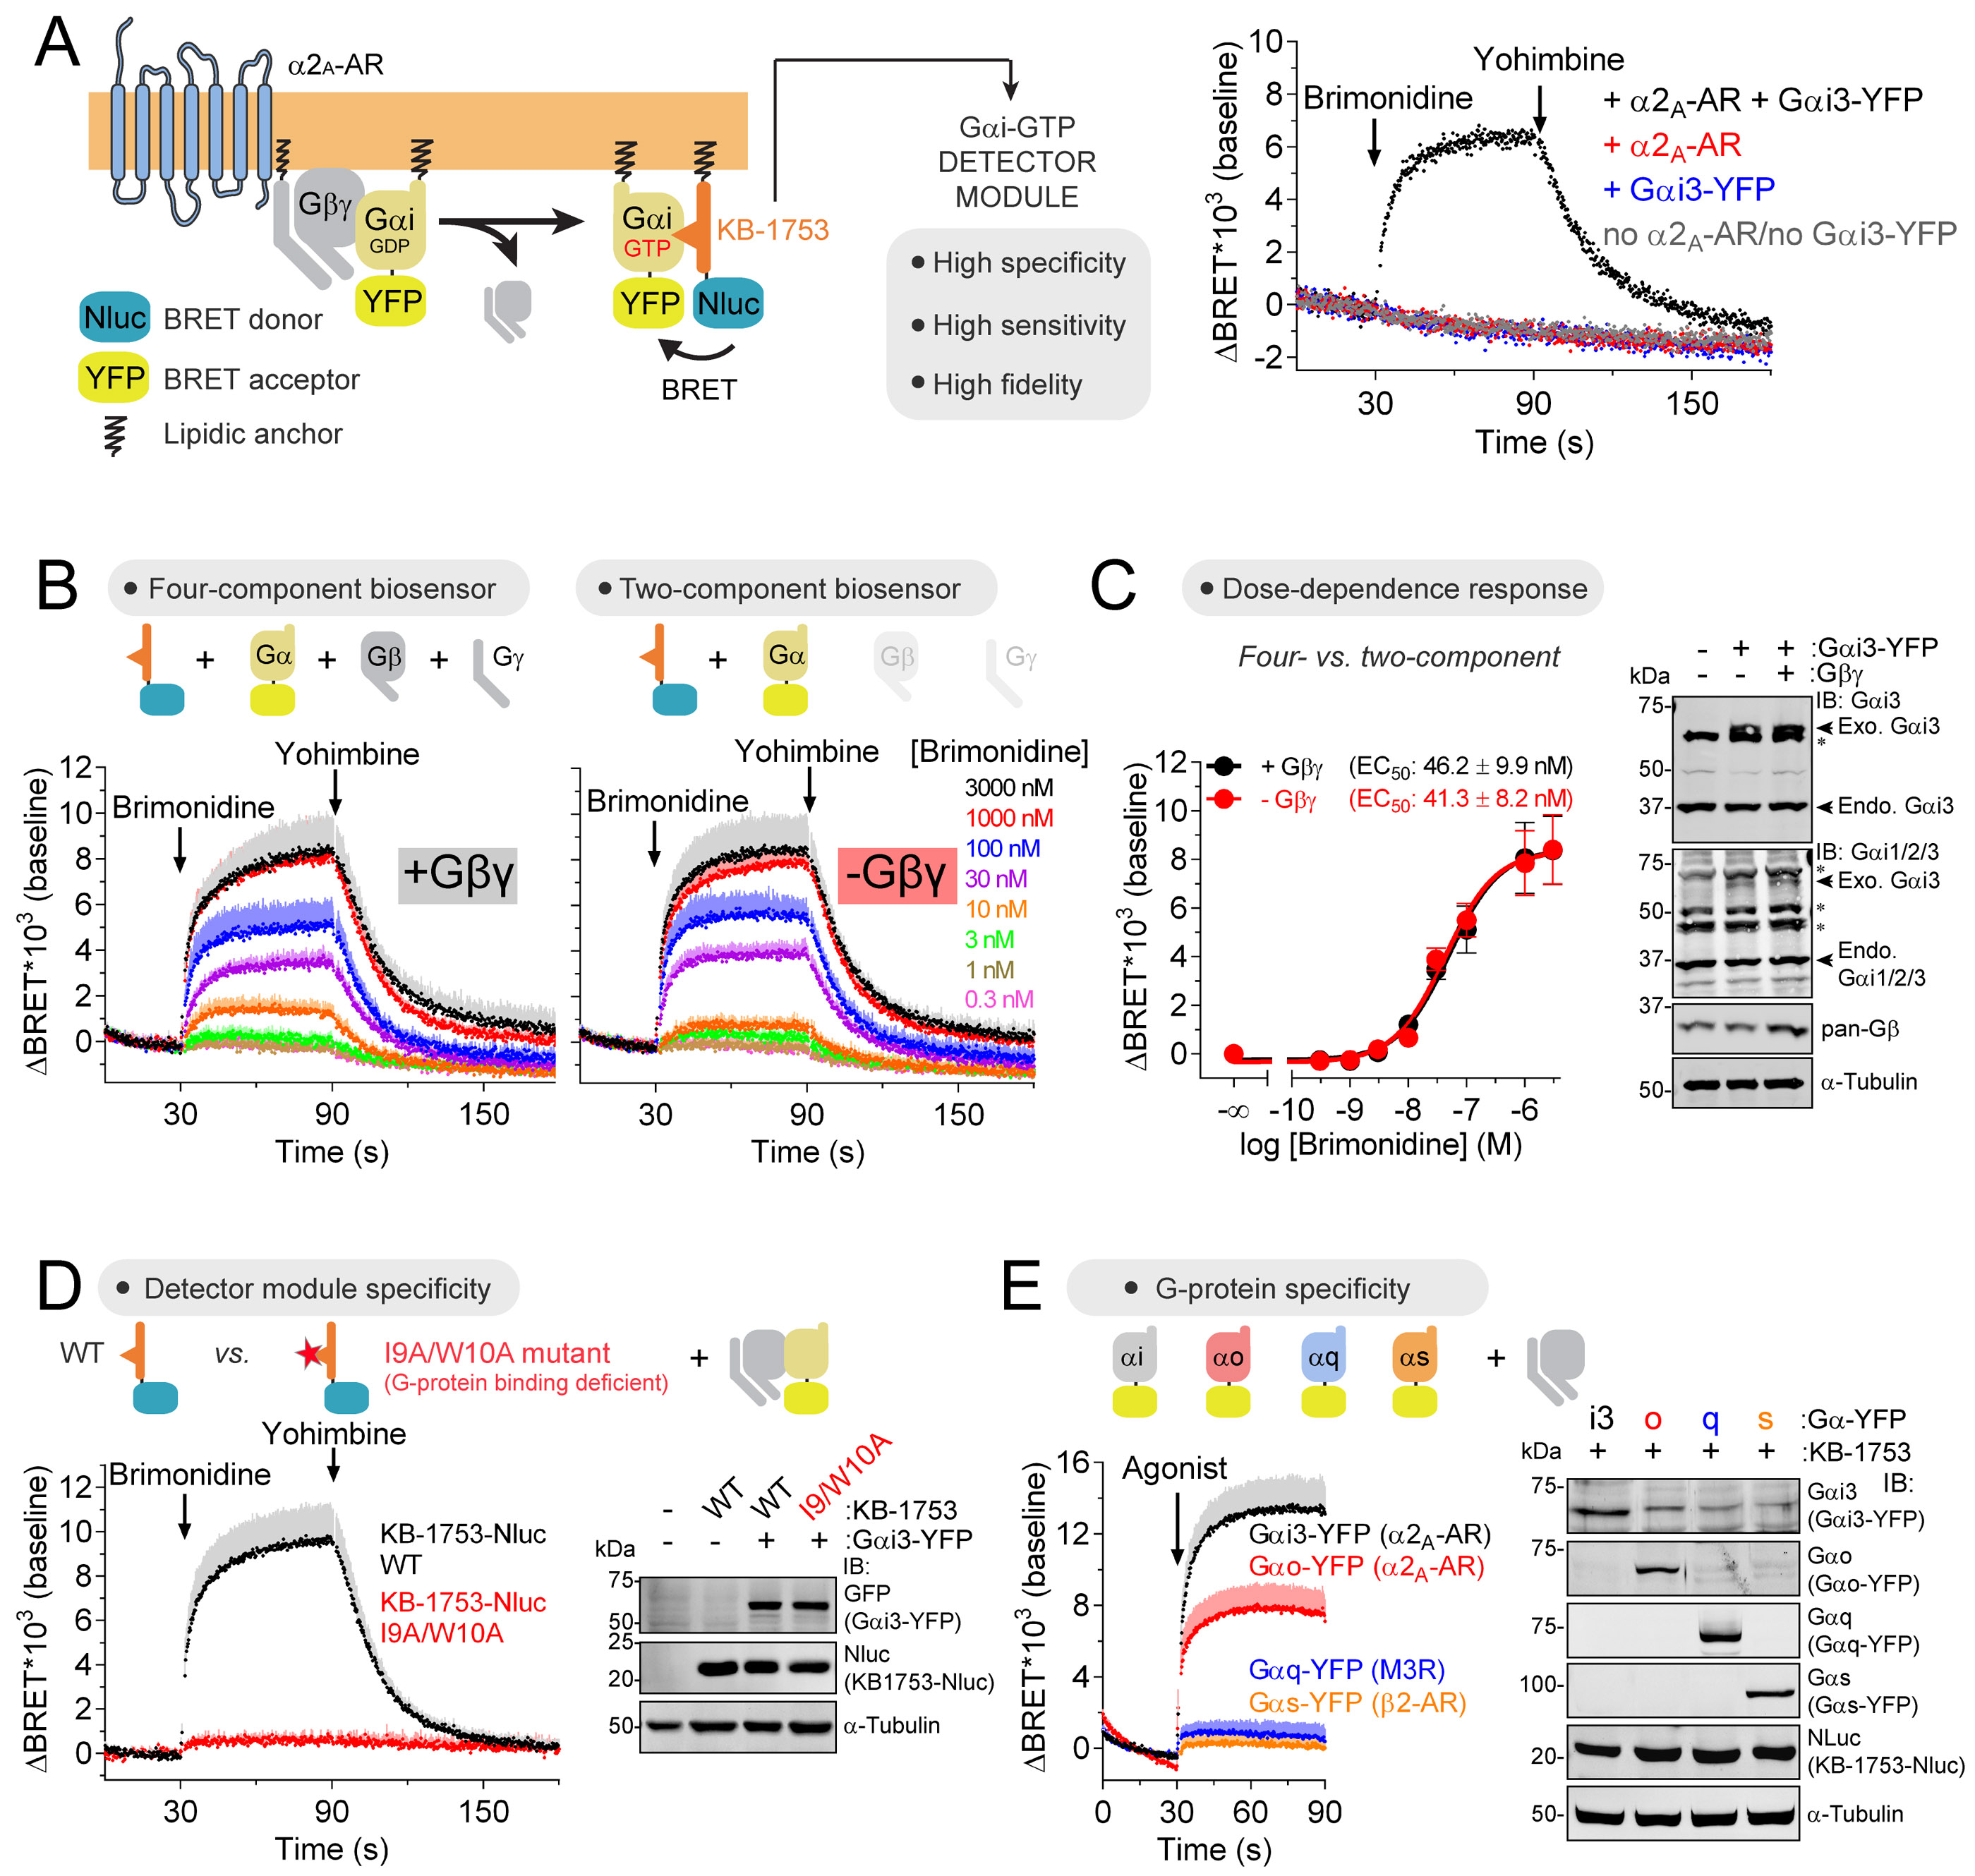
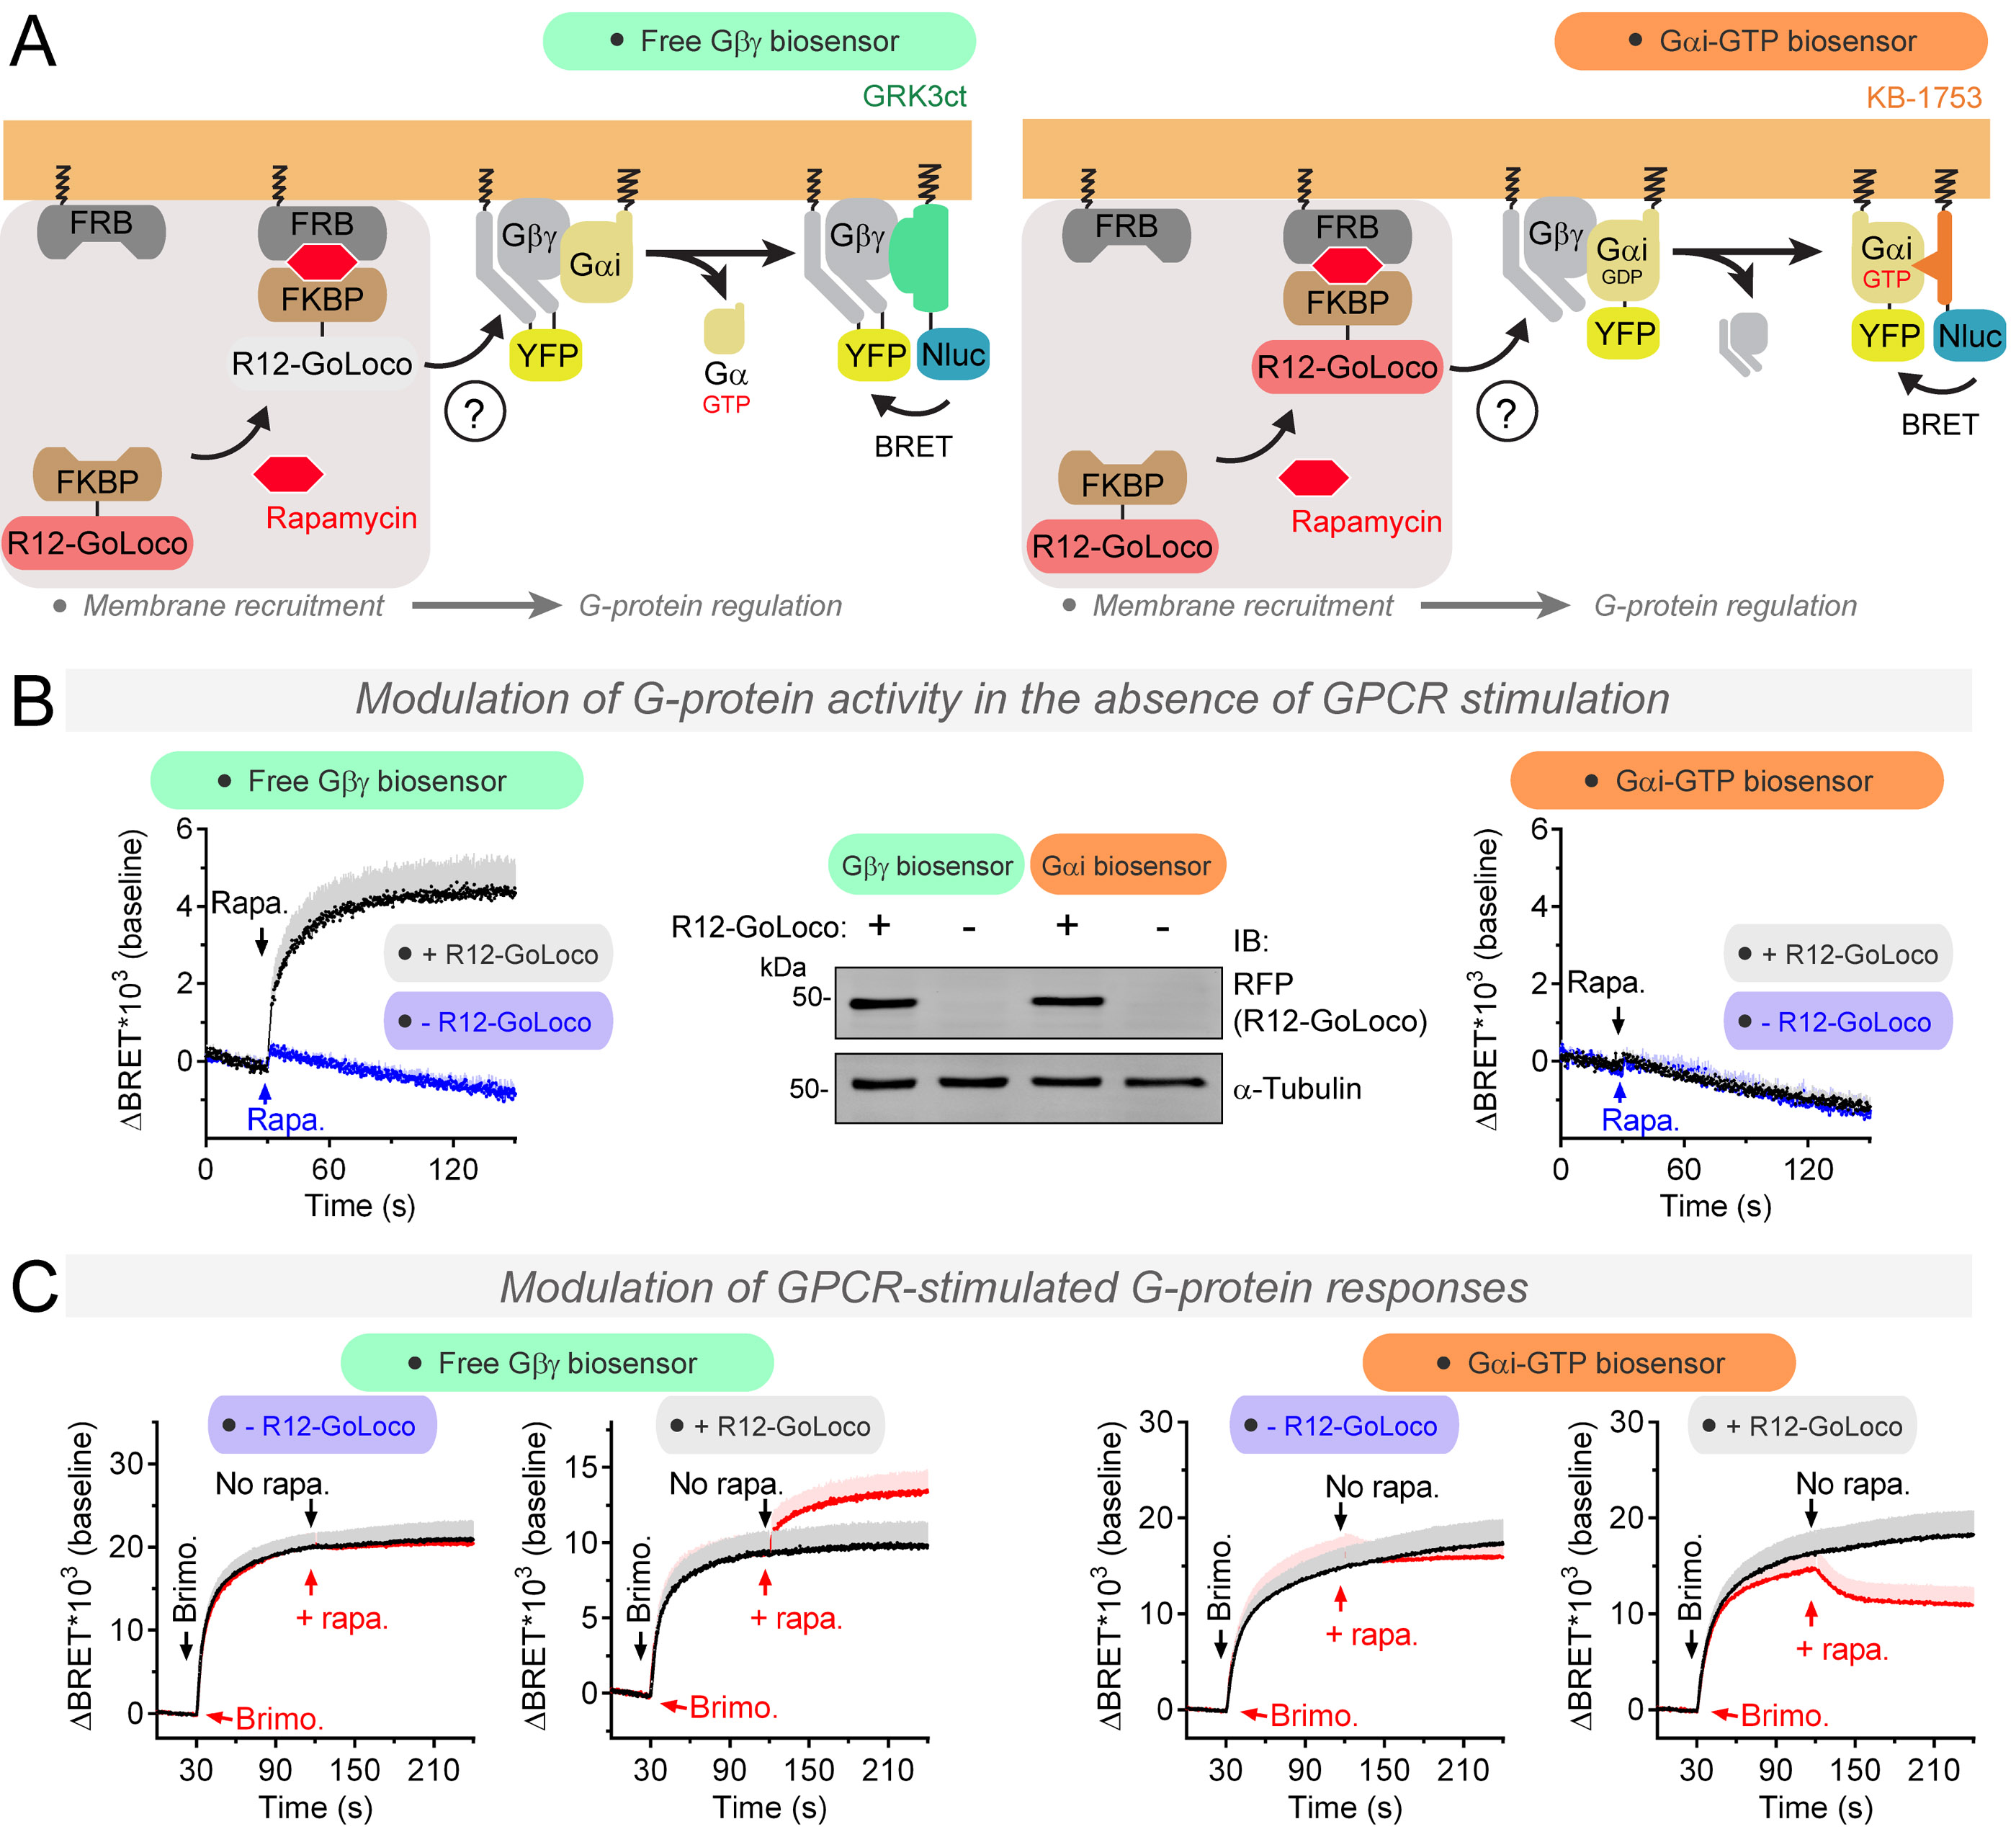
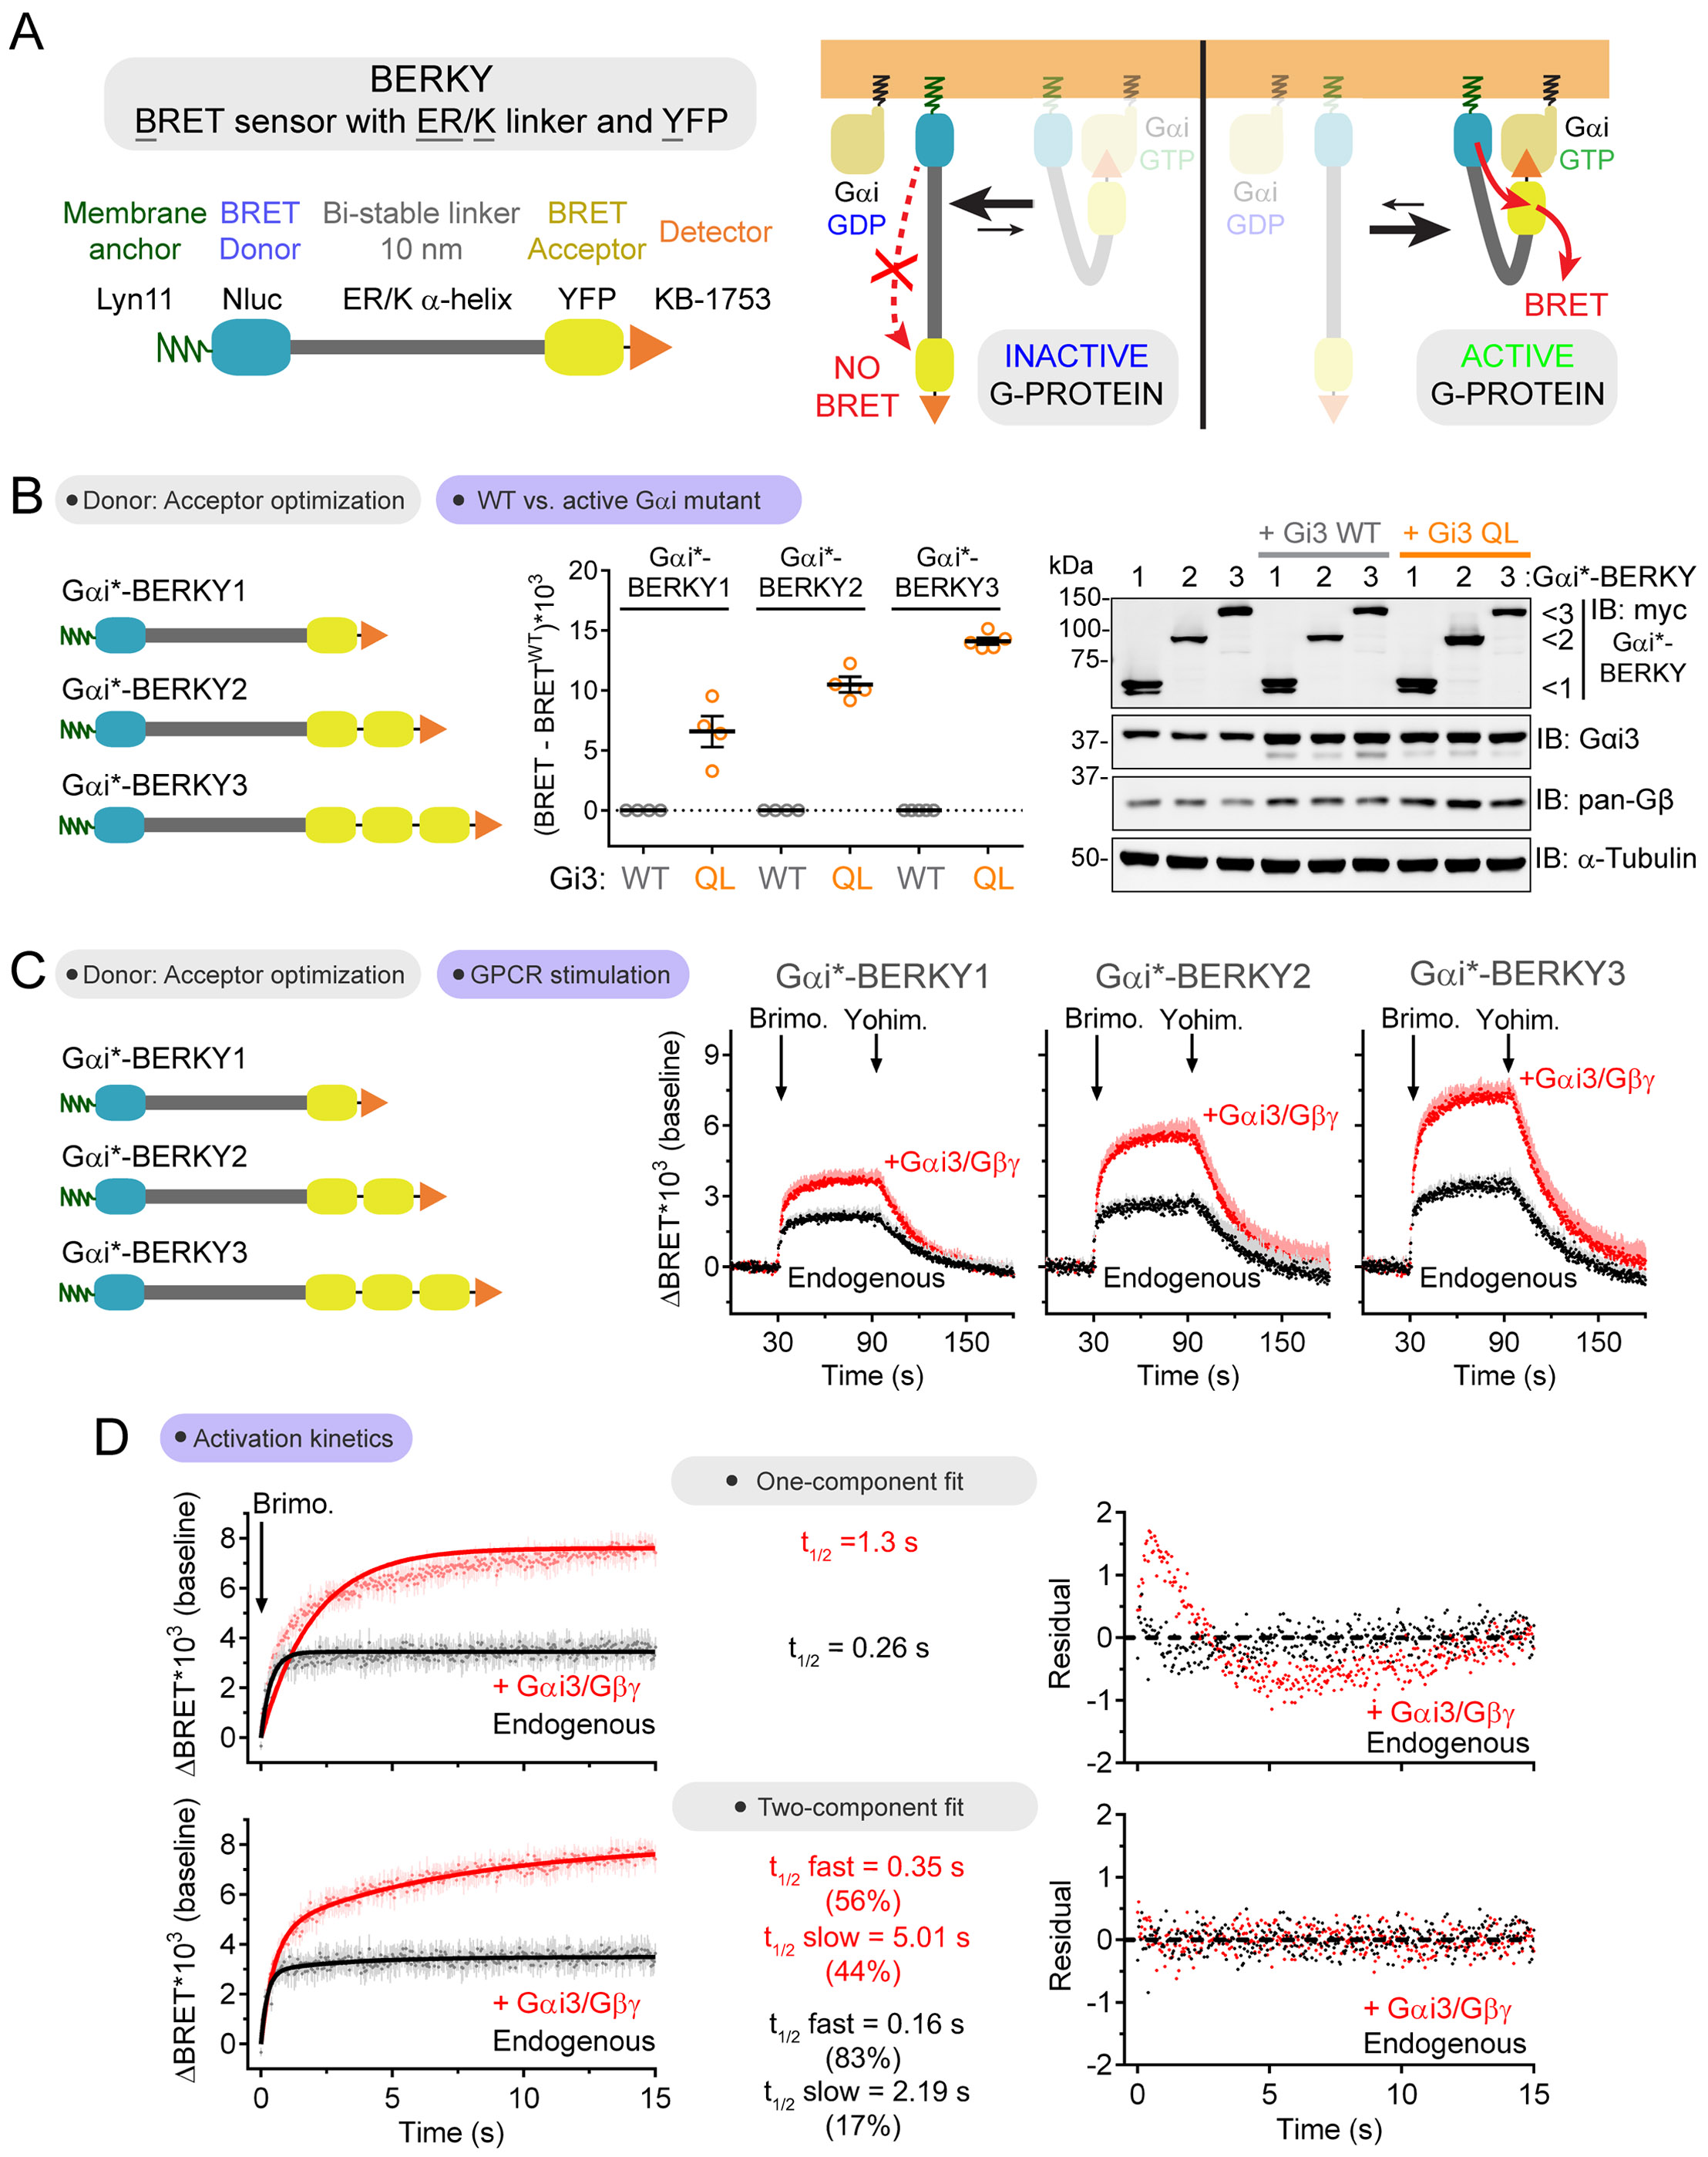
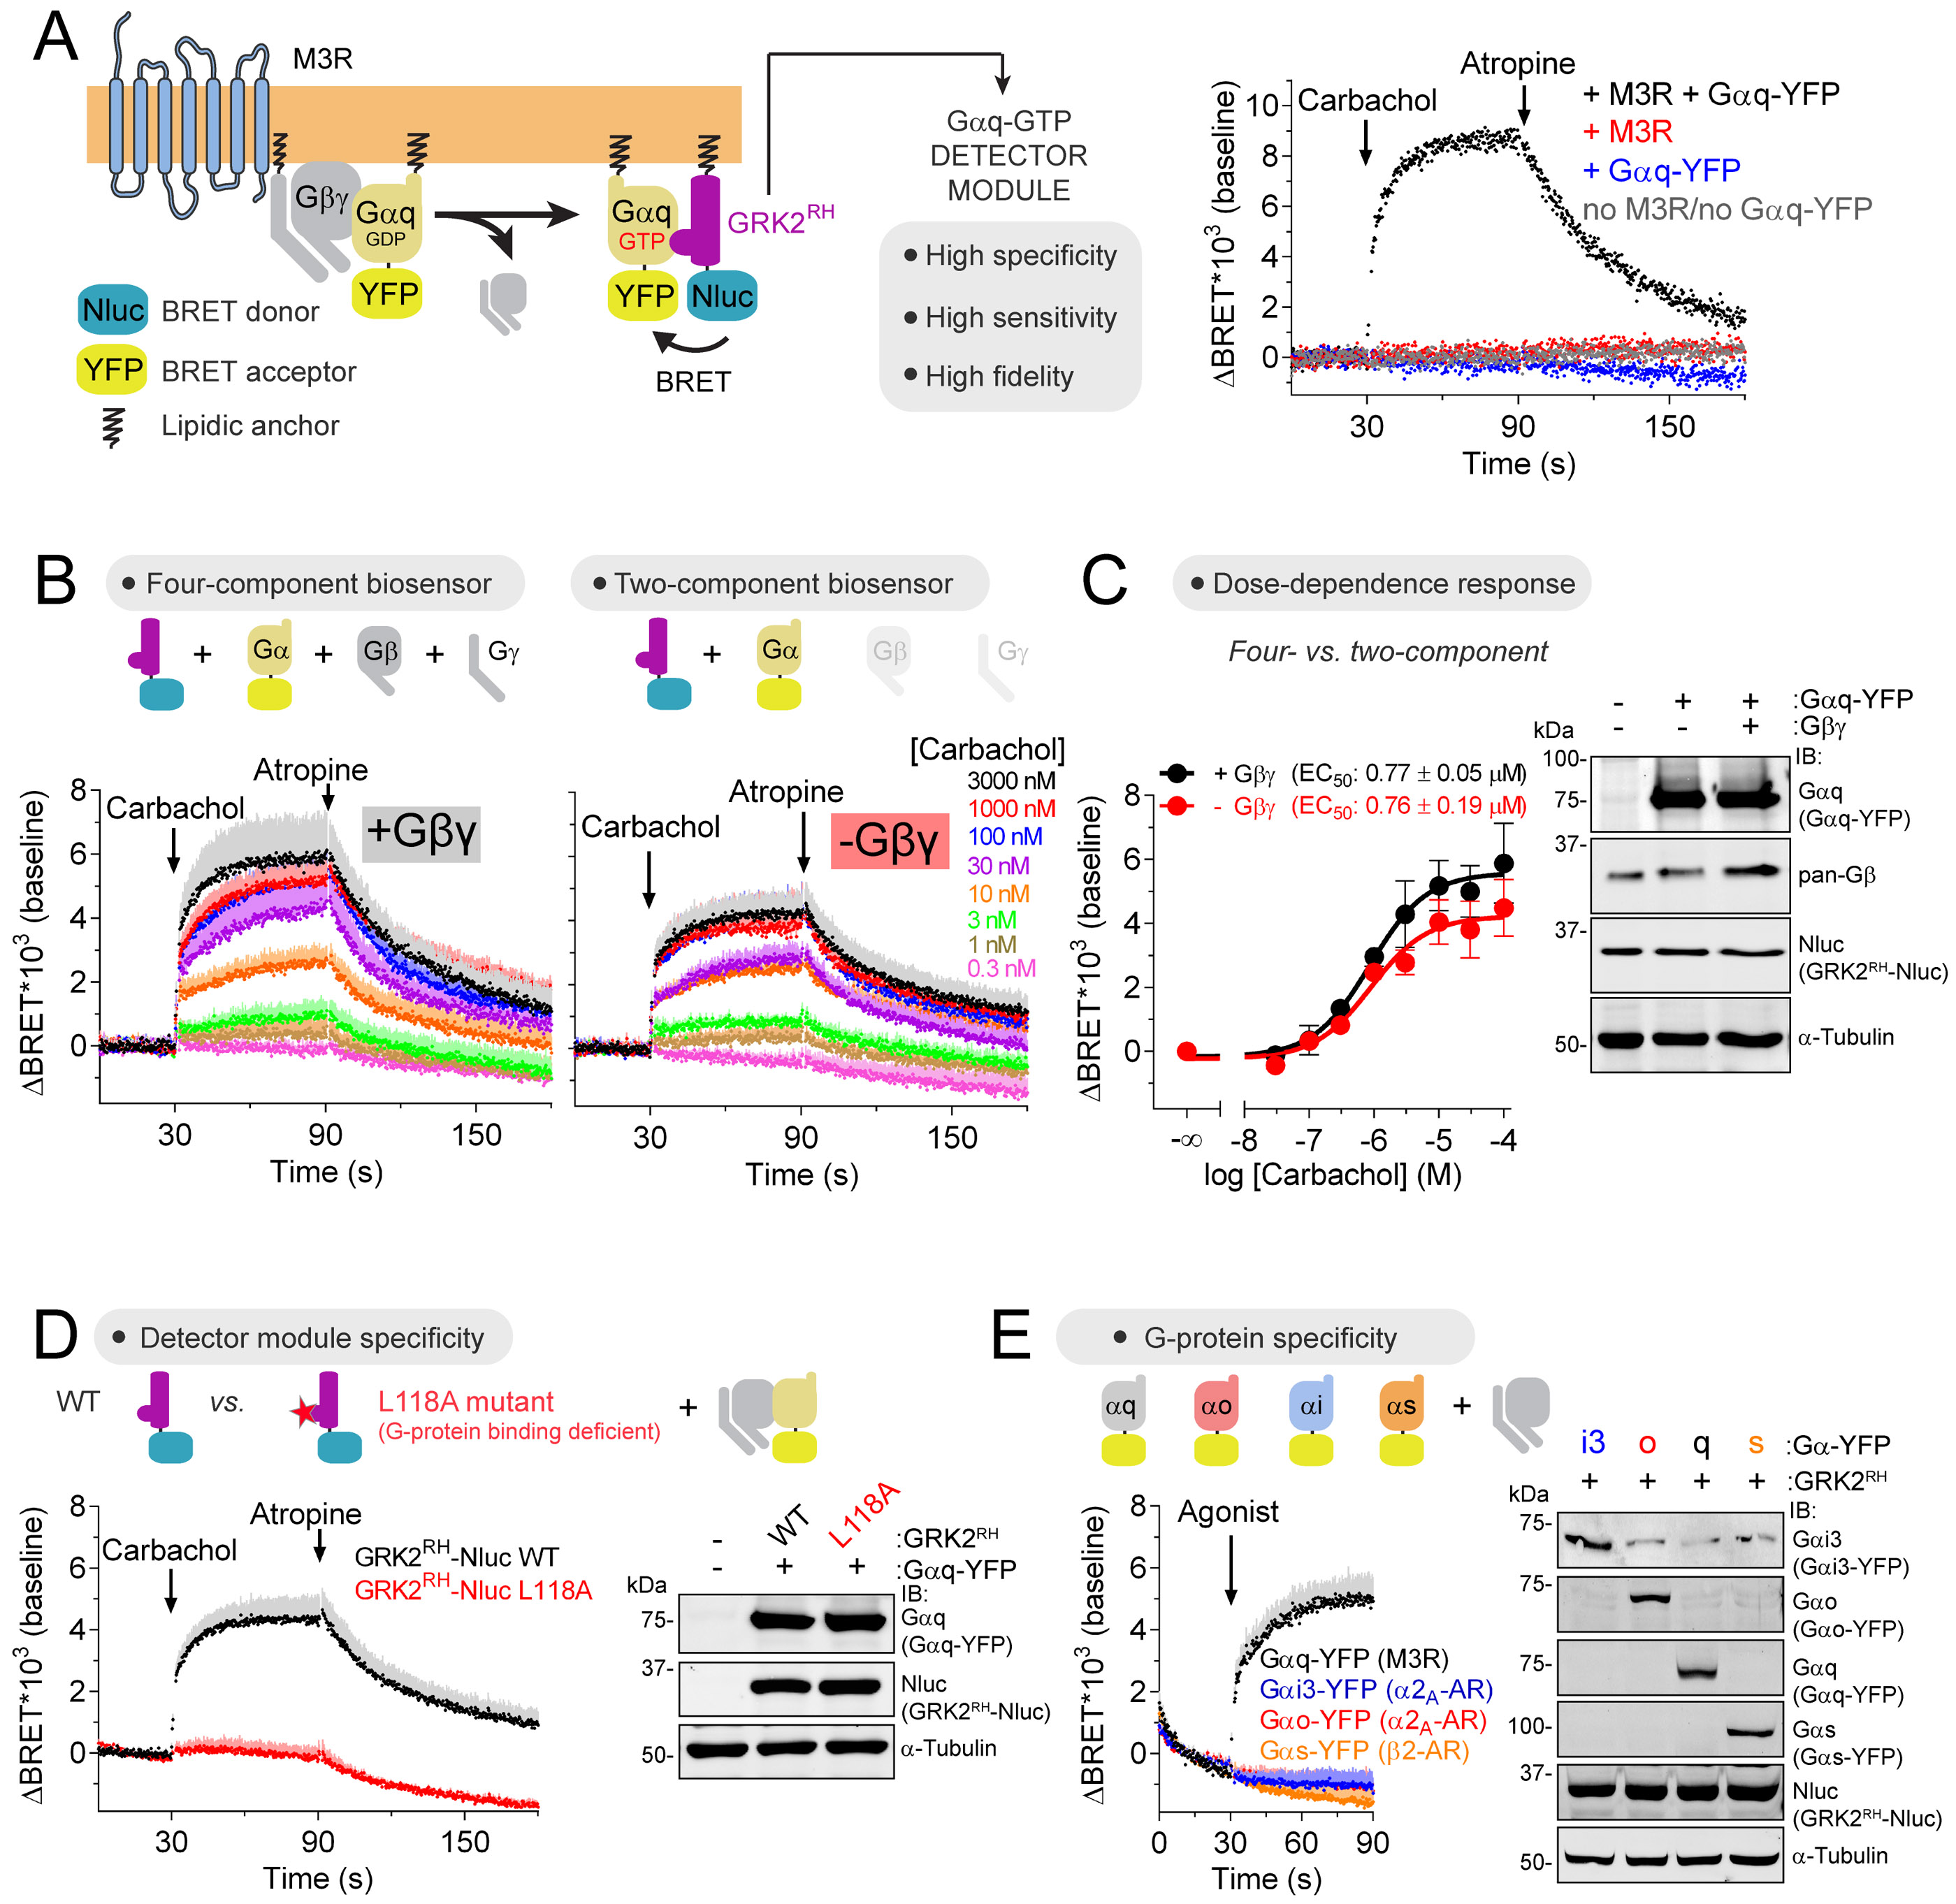
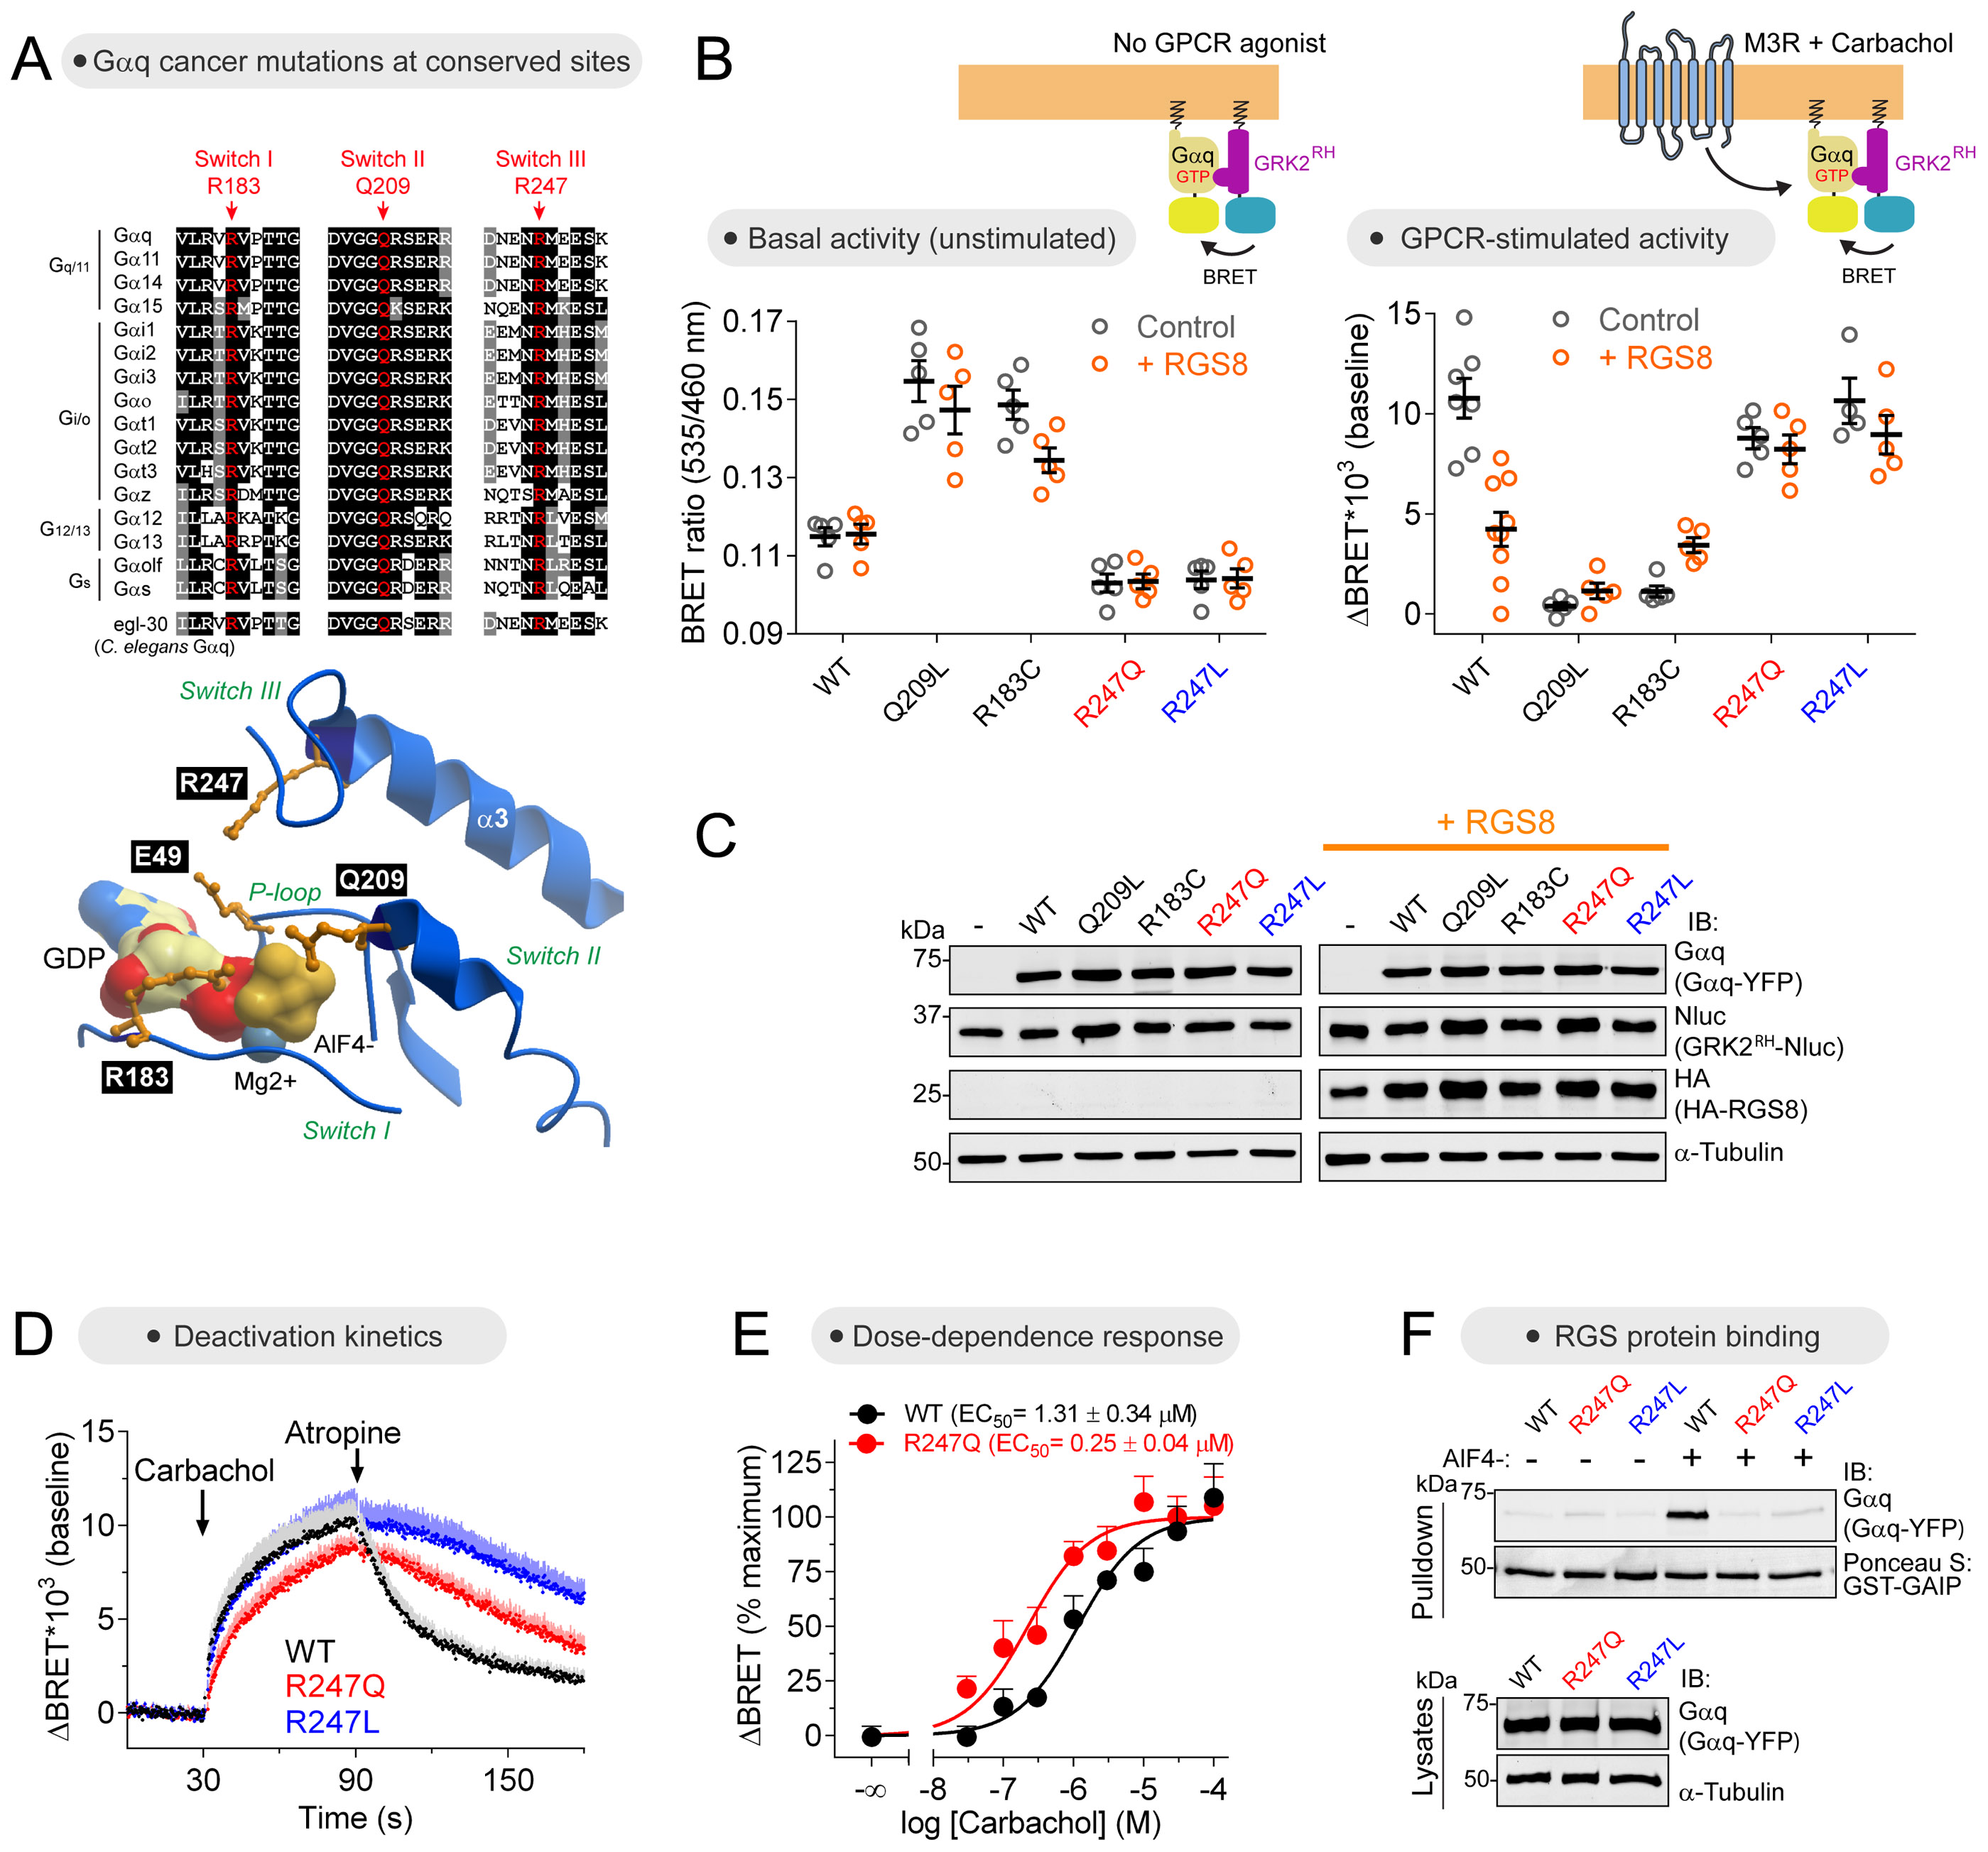
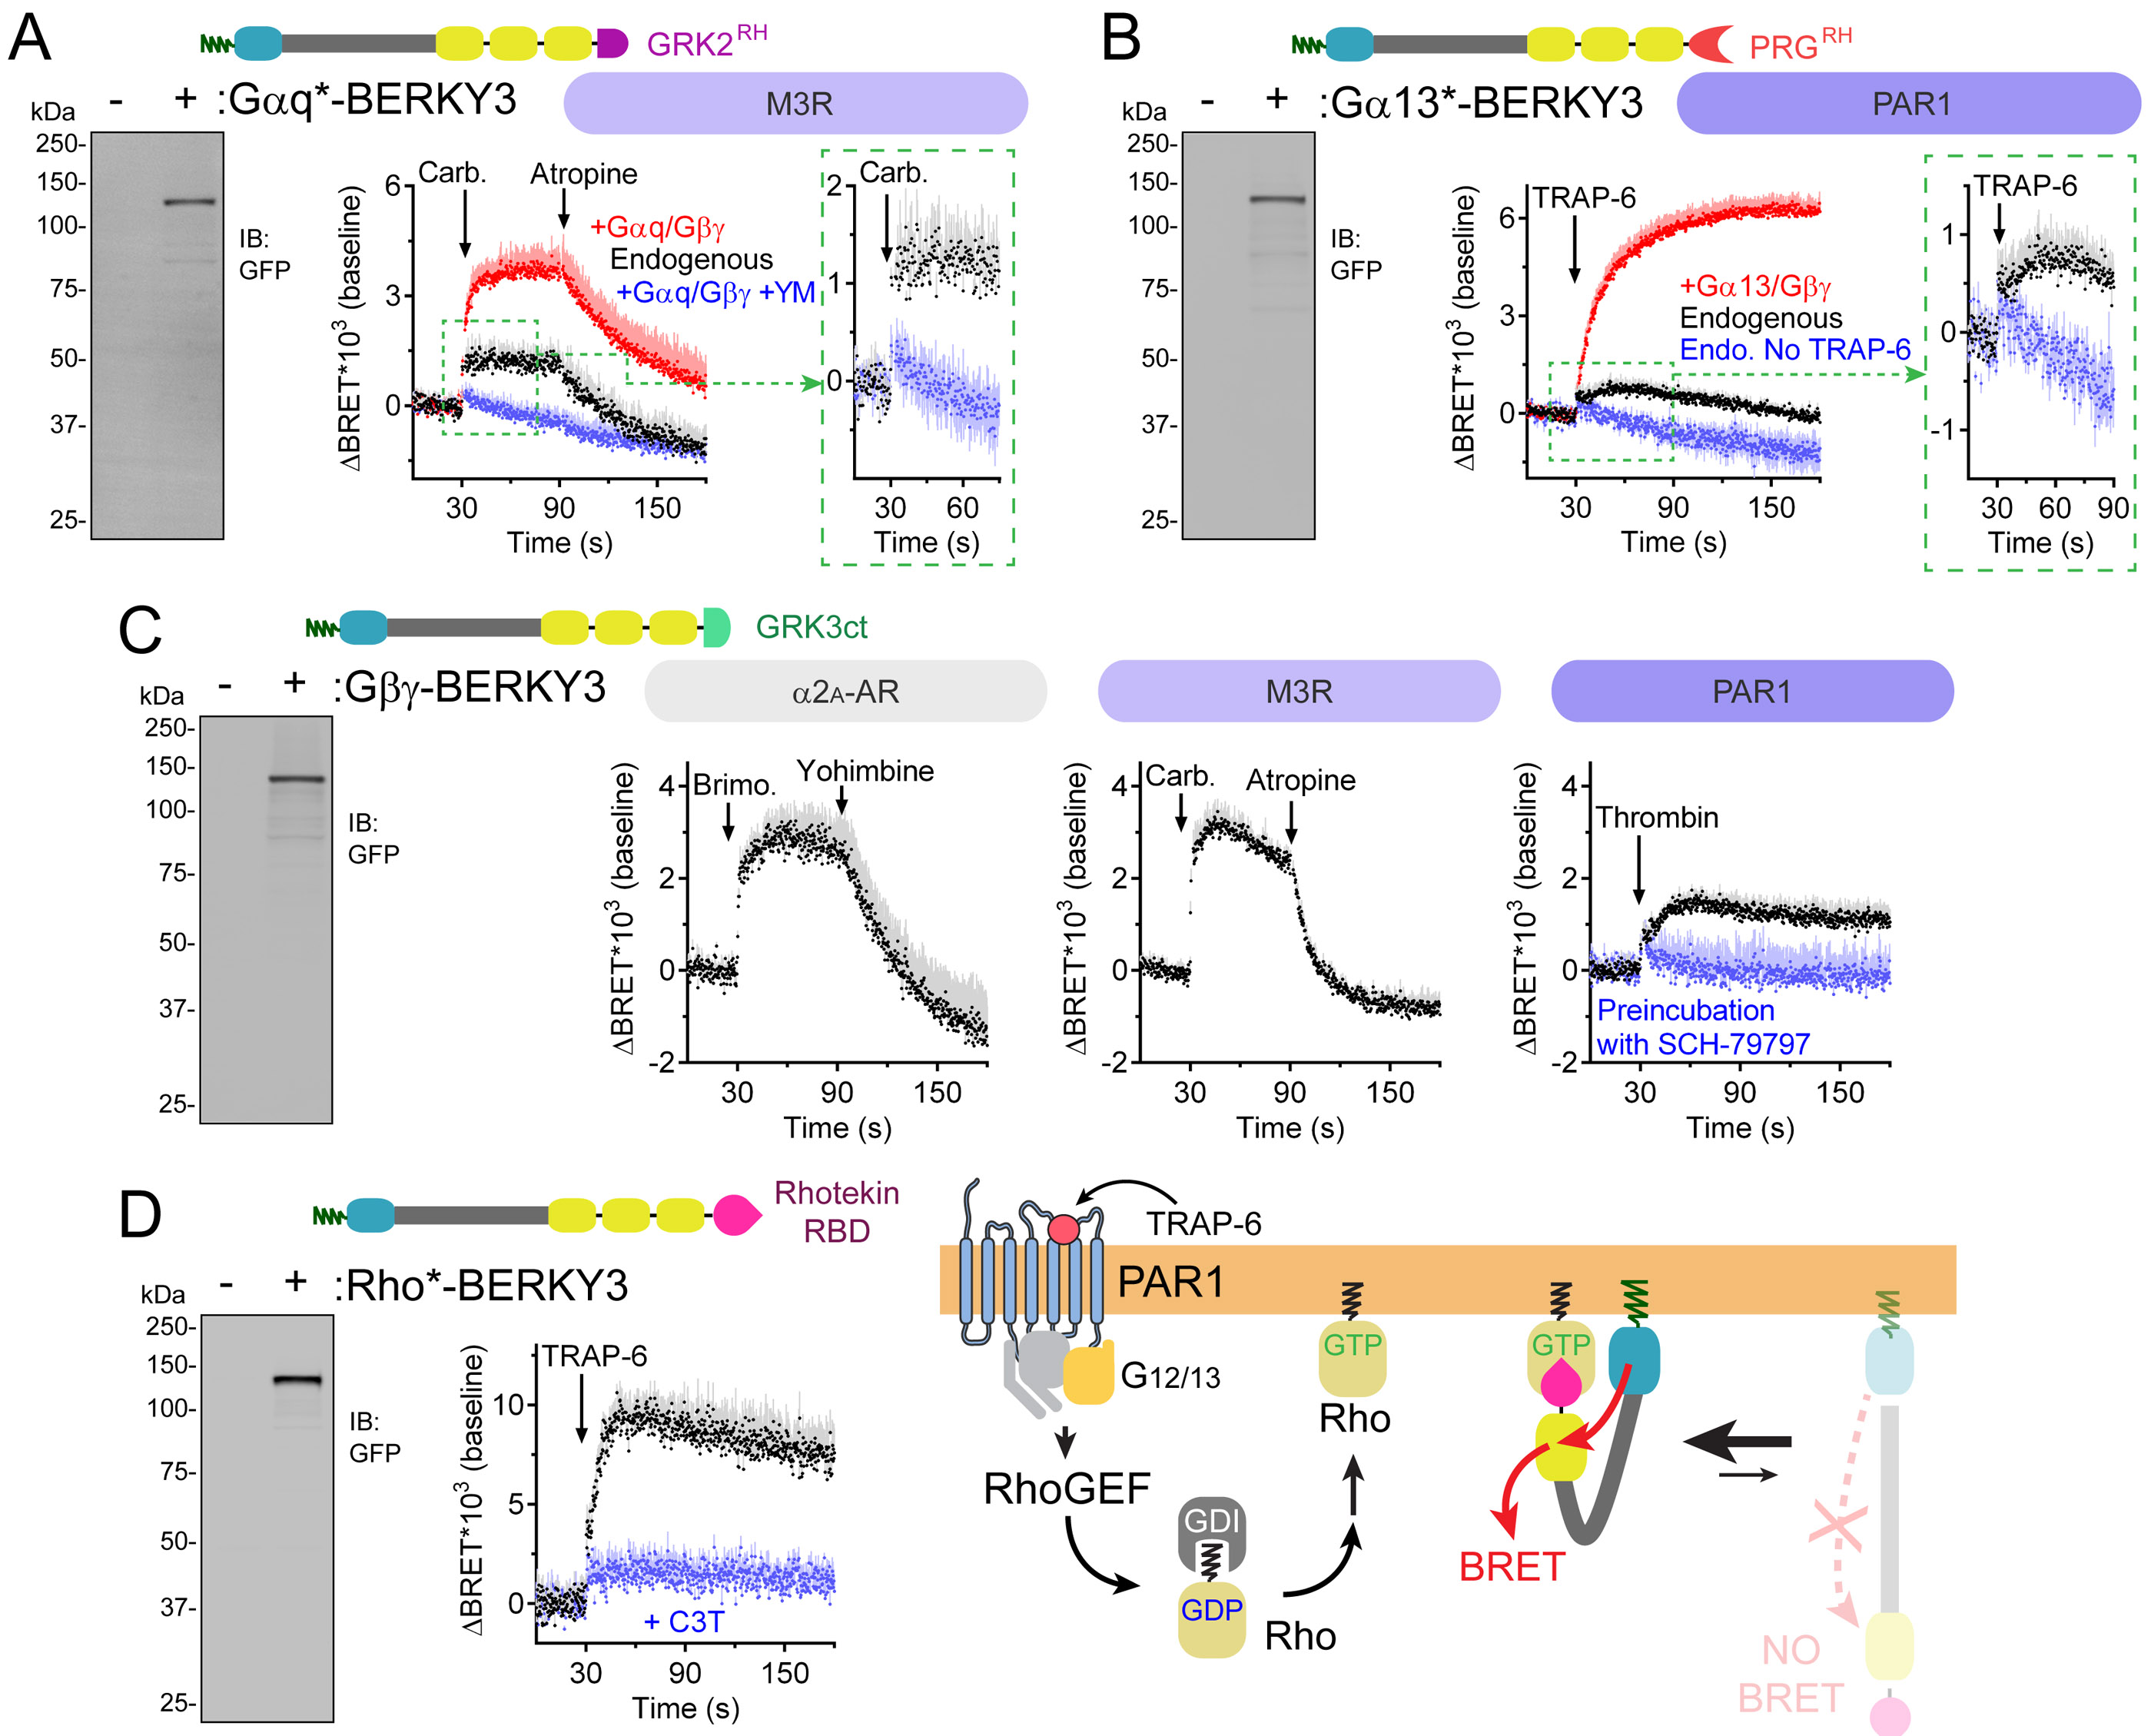
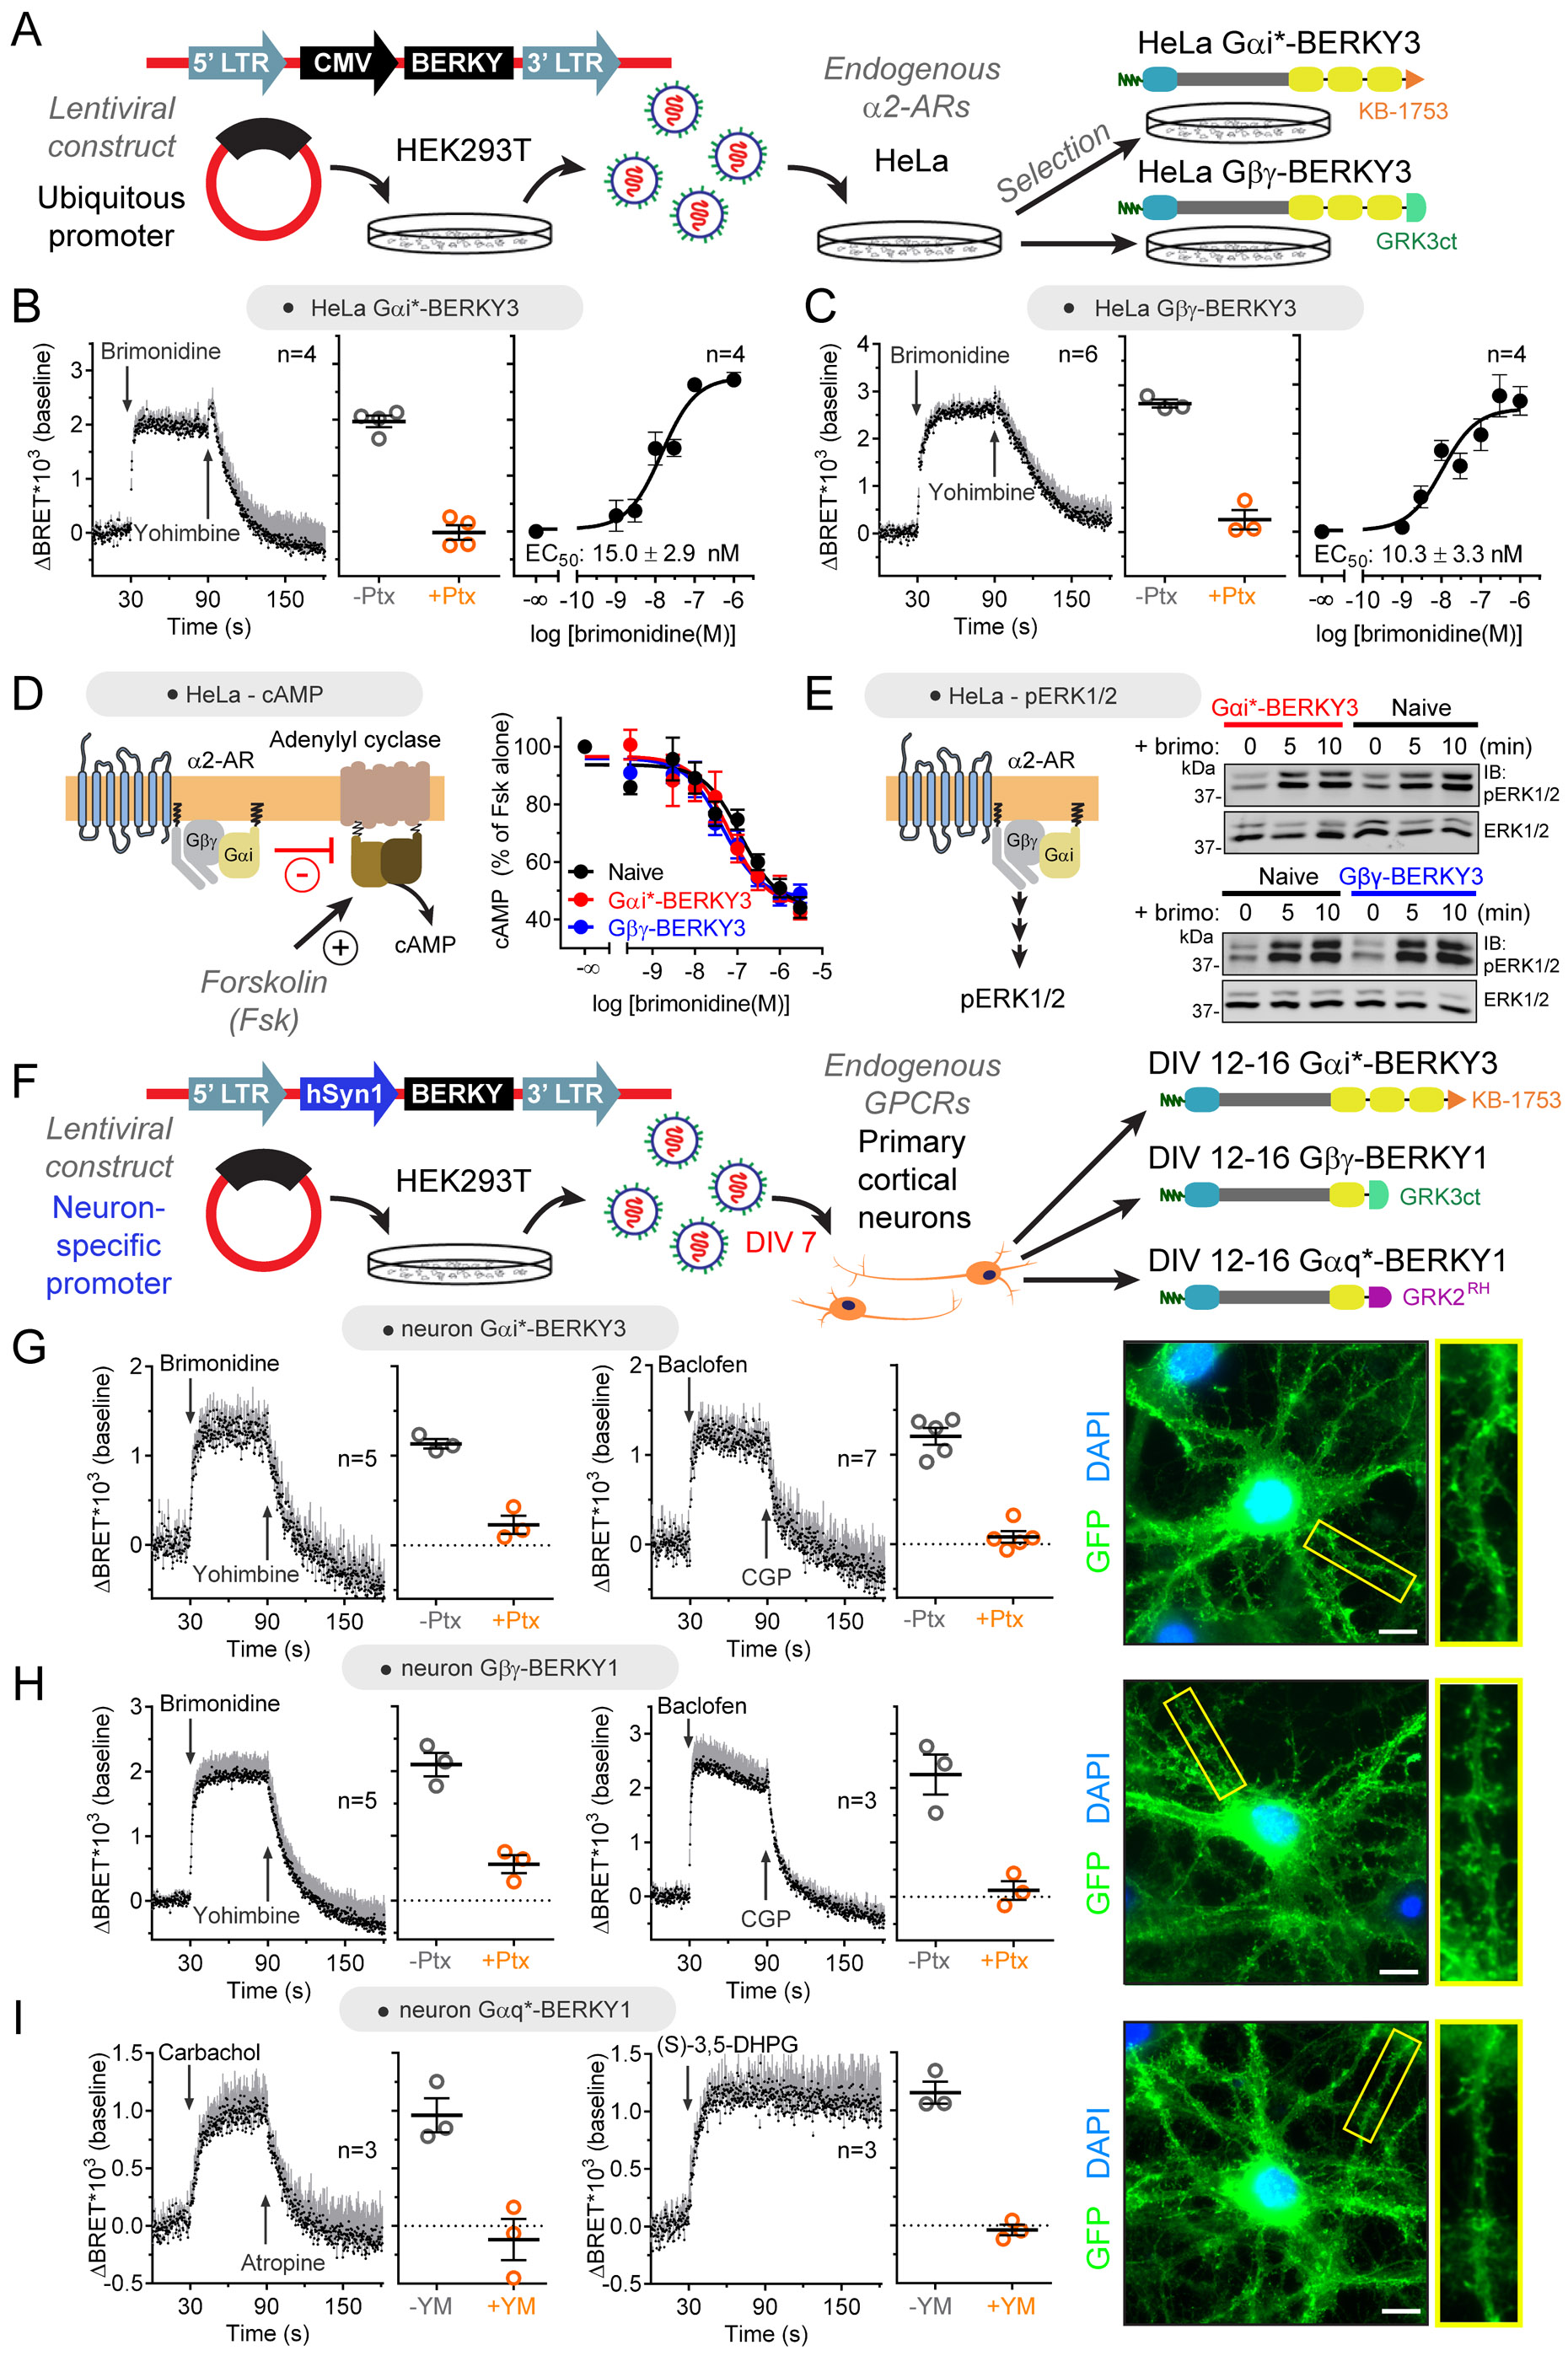
Heterotrimeric G-proteins (Gαβγ) are the main transducers of signals from GPCRs, mediating the action of countless natural stimuli and therapeutic agents. However, there are currently no robust approaches to directly measure the activity of endogenous G-proteins in cells. Here, we describe a suite of optical biosensors that detect endogenous active G-proteins with sub-second resolution in live cells. Using a modular design principle, we developed genetically encoded, unimolecular biosensors for endogenous Gα-GTP and free Gβγ: the two active species of heterotrimeric G-proteins. This design was leveraged to generate biosensors with specificity for different heterotrimeric G-proteins or for other G-proteins, such as Rho GTPases. Versatility was further validated by implementing the biosensors in multiple contexts, from characterizing cancer-associated G-protein mutants to neurotransmitter signaling in primary neurons. Overall, the versatile biosensor design introduced here enables studying the activity of endogenous G-proteins in live cells with high fidelity, temporal resolution, and convenience.

Keywords: BRET; G protein; GPCR; GTPase; biosensor; cancer; neurobiology; neurotransmitter; oncogene.


Conflict of interest statement

Declaration of Interests M.G.-M. is listed as an inventor in a provisional patent filed by Boston University related to the content of this manuscript.

Figures

Figure 1.
Figure 1.. Direct detection of GTP-bound Gαi in cells.
(A) Gαi-GTP biosensor design principle and representative traces of BRET measurements in HEK293T cells expressing KB-1753-Nluc along with the indicated constructs. Brimonidine= 0.1 μM/ Yohimbine= 100 μM. (B, C) Agonist dose-dependent Gαi-GTP responses using four- or two-component biosensors in HEK293T cells expressing α2A-AR. Mean ± S.E.M, n= 4. In B, S.E.M. is displayed as bars of lighter color tone than data points and only in the positive direction for clarity. Exo.= exogenous, Endo.= endogenous, *= non-specific immunoreactive band. (D) Loss of Gαi-GTP response upon mutation of KB-1753-Nluc. Brimonidine= 1 μM/ Yohimbine= 100 μM. Mean ± S.E.M, n= 3-6. (E) Detection of Gαi-GTP and Gαo-GTP but not Gαq-GTP or Gαs-GTP responses by KB-1753-Nluc upon GPCR agonist stimulation. Cells expressing G-proteins with the indicated cognate GPCRs were agonist-stimulated as follows: Gαi3/Gαo, 5 μM brimonidine; Gαq, 100 μM carbachol; Gαs, 100 μM isoproterenol. Mean ± S.E.M, n= 4. See also Figure S1.
Figure 2.
Figure 2.. Differential regulation of free Gβγ and Gαi-GTP levels by GoLoco motifs.
(A) Real-time measurement of free Gβγ or Gαi-GTP levels in cells upon rapamycin-induced rapid recruitment of the R12-GoLoco GDI to cell membranes. (B) Membrane recruitment of R12-GoLoco promotes Gβγ release from Gαi-Gβγ trimers but does not change basal levels of Gα-GTP in HEK293T cells. Mean ± S.E.M, n= 4. Rapa.= rapamycin. (C) Membrane recruitment of R12-GoLoco diminishes GPCR-stimulated (α2A-AR) levels of Gαi-GTP in cells, whereas it further promotes the dissociation of Gαi-Gβγ trimers in HEK293T cells. Mean ± S.E.M, n= 3-5. Brimo.= Brimonidine 3 nM.
Figure 3.
Figure 3.. Detection of endogenous Gαi-GTP in cells with a unimolecular biosensor.
(A) Modular design of a unimolecular biosensor for Gαi-GTP (=Gαi*) and the rationale for BRET enhancement upon G-protein activation. (B, C) Increasing the number of BRET acceptor modules (YFP) relative to donor modules (Nluc) per Gαi*-BERKY biosensor molecule enhances the BRET increases observed upon expression of a constitutively active G-protein mutant (Gi3 QL, in B) or upon GPCR stimulation (α2A-AR, in C). Mean ± S.E.M, n= 3-5. (D) Gαi activation kinetics were determined in HEK293T cells expressing Gαi*-BERKY3 with or without Gαi3/Gβγ overexpression upon GPCR stimulation (α2A-AR, 5 μM brimonidine). Data points are mean ± S.E.M. (n= 4) and solid lines are fits to one-component exponential curves (top) or two-component exponential curves (bottom). Residual plots for each of the curve fits are shown on the right. See also Figure S2.
Figure 4.
Figure 4.. Direct detection of GTP-bound Gαq in cells.
(A) Gαq-GTP biosensor design principle and representative traces of BRET measurements in HEK293T cells expressing GRK2RH-Nluc along with the indicated constructs. Carbachol= 100 μM/ Atropine= 100 μM. (B, C) Agonist dose-dependent Gαq-GTP responses using four- or two-component biosensors in HEK293T cells expressing M3R. Mean ± S.E.M, n= 4-6. (D) Loss of Gαq-GTP response upon mutation of GRK2RH-Nluc. Carbachol= 30 μM/ Atropine= 100 μM. Mean ± S.E.M, n= 3-7. (E) Detection of Gαq-GTP but not Gαi3-GTP, Gαo-GTP or Gαs-GTP responses by GRK2rh-Nluc upon GPCR agonist stimulation. Cells expressing G-proteins with the indicated cognate GPCRs were agonist-stimulated as follows: Gαq, 100 μM carbachol; Gαi3/Gαo, 5 μM brimonidine; Gαs, 100 μM isoproterenol. Mean ± S.E.M, n= 3-5. See also Figure S3 and Figure S4.
Figure 5.
Figure 5.. Characterization of cancer-associated G-protein mutants with a Gαq-GTP biosensor.
(A) Alignment of Gα Switch regions showing in red three fully conserved positions that are mutated in Gαq in cancer. Three dimensional model of Gαq (PDB: 3OHM) showing the position of selected residues around the nucleotide binding site. (B, C) Different activation properties of cancer-associated Gαq mutants as determined by the Gαq-GTP biosensor GRK2RH-Nluc. Gαq-GTP levels were determined with and without GPCR stimulation (M3R, carbachol 100 μM) and in the absence (grey) or presence (orange) of the GAP RGS8. Mean ± S.E.M, n= 4-9. (D) R247 mutants deactivate more slowly than Gαq WT upon termination of GPCR stimulation as determined by the Gαq-GTP biosensor GRK2RH-Nluc. Mean ± S.E.M, n= 4-5. Carbachol, 100 μM; Atropine, 100 μM. (E) Carbachol activates Gαq R247Q 5-fold more potently than Gαq WT as determined by the Gαq-GTP biosensor GRK2RH-Nluc. Mean ± S.E.M, n= 4. (F) Gαq R247 mutants do not bind to the RGS protein GAIP. Binding to immobilized GST-GAIP was determined in the absence or presence of AlF4, which induces the G-protein activation transition-state conformation recognized by RGS proteins. One experiment of n>3. See also Figure S5.
Figure 6.
Figure 6.. Detection of endogenous Gαq-GTP, Gα13-GTP, free Gβγ and Rho-GTP in cells with unimolecular biosensors.
(A) BRET response detected with Gαq*-BERKY3 upon M3R modulation in HEK293T cells expressing exogenous Gαq/Gβγ or only endogenous G-proteins. BRET of cells expressing exogenous Gαq/Gβγ and pre-treated with 10 μM YM-254890 for 10 min is shown in blue. Carbachol= 100 μM/ Atropine= 100 μM. Mean ± S.E.M, n= 4. (B) BRET response detected with Gα13*-BERKY3 upon PAR1 stimulation in HEK293T cells expressing exogenous Gα13/Gβγ or only endogenous G-proteins. BRET of unstimulated cells (blue) is shown for reference. TRAP-6= 30 μM. Mean ± S.E.M, n= 4-6. (C) BRET responses detected with Gβγ-BERKY3 upon modulation of α2A-AR, M3R, or PAR1, as indicated, in HEK293T cells expressing only endogenous G-proteins. Brimonidine= 5 μM; Yohimbine= 25 μM; Carbachol= 100 μM; Atropine= 100 μM; Thrombin= 1 U/ml; SCH-79797= 40 μM. Mean ± S.E.M, n= 3-4. (D) BRET responses detected with Rho*-BERKY3 upon PAR1 stimulation in HEK293T cells co-transfected (blue) or not (black) with the Rho inhibitor C3 toxin (C3T). TRAP-6= 30 μM. Mean ± S.E.M, n= 4.
Figure 7.
Figure 7.. Detection of endogenous G-protein activation by endogenous GPCRs in cell lines and primary neurons.
(A) Generation of HeLa cell lines stably expressing Gαi*-BERKY3 or Gβγ-BERKY3 to monitor G-protein activation upon activation of endogenously expressed α2-ARs. (B, C) Endogenous Gαi-GTP (in B) or free Gβγ (in C) BRET responses detected by BERKY biosensors upon stimulation of endogenous α2-ARs in HeLa cells are reversible, pertussis toxin (Ptx)-sensitive and dose-dependent. Unless otherwise indicated brimonidine was 5 μM. Yohimbine= 25 μM. Ptx= 0.2 μg/ml overnight. Mean ± S.E.M. (D, E) Expression of Gαi*-BERKY3 or Gβγ-BERKY3 does not affect downstream Gi-dependent signaling upon stimulation of endogenous α2-ARs in HeLa cells. cAMP levels were determined upon stimulation with the indicated concentrations of brimonidine in cells pretreated with 10 μM forskolin (in D), and pERK1/2 levels were determined by immunoblotting upon stimulation with 3 μM brimonidine (in E). (F) Acute lentiviral transduction of primary cortical neurons with Gαi*-BERKY3, Gβγ-BERKY1, or Gαq*-BERKY1 constructs to monitor G-protein activation upon stimulation of endogenously expressed GPCRs. DIV= days in vitro. (G, H, I) Endogenous Gαi-GTP (in G), free Gβγ (in H), or Gαq-GTP (in I) BRET responses detected by BERKY biosensors upon stimulation of endogenous GPCRs in primary cortical neurons. Responses to α2-AR (brimonidine, 5 μM) or GABABR (baclofen, 100 μM) are blocked by pertussis toxin (Ptx, 0.2 μg/ml overnight preincubation), and responses to muscarinic receptors (carbachol, 100 μM) or class I metabotropic glutamate receptors ((S)-3,5-DHPG, 100 μM) are blocked by YM-254890 (YM, 10 μM, 10 min preincubation). Yohimbine= 25 μM; CGP 54626 (CGP) = 1 μM (in H) or 10 μM (in G); Atropine, 100 μM. Mean ± S.E.M. Wide-field fluorescence images of immunostained neurons show broad distribution of BERKY biosensors throughout the soma and dendrites. Scale bar= 10 μm. See also Figure S7.

Similar articles

Cited by

References

    1. Berman DM, Wilkie TM, and Gilman AG (1996). GAIP and RGS4 are GTPase-activating proteins for the Gi subfamily of G protein alpha subunits. Cell 86, 445–452. - PubMed
    1. Bunemann M, Frank M, and Lohse MJ (2003). Gi protein activation in intact cells involves subunit rearrangement rather than dissociation. Proceedings of the National Academy of Sciences of the United States of America 100, 16077–16082. - PMC - PubMed
    1. Carman CV, Parent JL, Day PW, Pronin AN, Sternweis PM, Wedegaertner PB, Gilman AG, Benovic JL, and Kozasa T (1999). Selective regulation of Galpha(q/11) by an RGS domain in the G protein-coupled receptor kinase, GRK2. The Journal of biological chemistry 274, 34483–34492. - PubMed
    1. Cerami E, Gao J, Dogrusoz U, Gross BE, Sumer SO, Aksoy BA, Jacobsen A, Byrne CJ, Heuer ML, Larsson E, et al. (2012). The cBio cancer genomics portal: an open platform for exploring multidimensional cancer genomics data. Cancer discovery 2, 401–404. - PMC - PubMed
    1. Chen Z, Singer WD, Danesh SM, Sternweis PC, and Sprang SR (2008). Recognition of the activated states of Galpha13 by the rgRGS domain of PDZRhoGEF. Structure 16, 1532–1543. - PMC - PubMed

Publication types

MeSH terms

Substances

LinkOut - more resources