. 2020 Sep 1;130(9):4574-4586.
doi: 10.1172/JCI133909.

Donor monocyte-derived macrophages promote human acute graft-versus-host disease

Affiliations

Donor monocyte-derived macrophages promote human acute graft-versus-host disease

Laura Jardine et al. J Clin Invest. .

Abstract

Myelopoiesis is invariably present and contributes to pathology in animal models of graft-versus-host disease (GVHD). In humans, a rich inflammatory infiltrate bearing macrophage markers has also been described in histological studies. In order to determine the origin, functional properties, and role in pathogenesis of these cells, we isolated single-cell suspensions from acute cutaneous GVHD and subjected them to genotype, transcriptome, and in vitro functional analysis. A donor-derived population of CD11c+CD14+ cells was the dominant population of all leukocytes in GVHD. Surface phenotype and NanoString gene expression profiling indicated the closest steady-state counterpart of these cells to be monocyte-derived macrophages. In GVHD, however, there was upregulation of monocyte antigens SIRPα and S100A8/9 transcripts associated with leukocyte trafficking, pattern recognition, antigen presentation, and costimulation. Isolated GVHD macrophages stimulated greater proliferation and activation of allogeneic T cells and secreted higher levels of inflammatory cytokines than their steady-state counterparts. In HLA-matched mixed leukocyte reactions, we also observed differentiation of activated macrophages with a similar phenotype. These exhibited cytopathicity to a keratinocyte cell line and mediated pathological damage to skin explants independently of T cells. Together, these results define the origin, functional properties, and potential pathogenic roles of human GVHD macrophages.

Keywords: Bone marrow transplantation; Immunology; Macrophages; Stem cell transplantation; Transplantation.


Conflict of interest statement

Conflict of interest: The authors have declared that no conflict of interest exists.

Figures

Figure 1
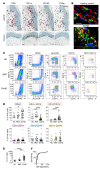
Figure 1. Mononuclear infiltrates in GVHD contain abundant CD14+CD11c+ myeloid cells.
Microscopic and flow cytometric evaluation of cutaneous GVHD lesions. (A) Acute GVHD (top row) and healthy control skin (bottom row). Immunohistochemistry with antibodies to CD3, CD11c, CD163, and factor XIIIa (red chromagen) costained with antibody to Ki67 (brown chromagen). Scale bar: 100 μm. (B) Whole-mount immunofluorescence of dermis from healthy controls and patients with GVHD, as indicated with antibodies to CD3 (red), CD11c, (green), and FXIIIA (blue). Scale bar: 50 μm. (C) Enzymatically digested dermis analyzed by flow cytometry from patients with GVHD, patients without GVHD (BMT), or healthy controls (HC), as indicated. Starting from CD45+ mononuclear cells (purple gate), HLA-DR+ cells were gated as shown to arrive at CD11cCD14+ resident macrophages (brown), CD11c+CD14+CD1c monocyte-macrophages (red), CD11c+CD14+CD1c+ double-positive cells (pink), CD1c+CD14 cDC2 (cyan), and CD141+ cDC1 (yellow; from the CD14CD11c gate). Representative samples of more than 60 experiments are shown. (D) Quantification of digested dermal mononuclear cells from patients with GVHD (n = 39), patients without GVHD (n = 16), or healthy controls (n = 21) as percentages of live cells. Mean + SEM for each group is shown. Groups were compared by 1-way ANOVA, and P values from Tukey’s multiple comparisons tests are shown. *P < 0.05; **P < 0.01; ***P < 0.001; ****P < 0.0001. (E) Ratio of CD11c+CD14+ cells to CD1c+CD14 cells in digests of GVHD, BMT control, or healthy control dermis (14:1c ratio). Median and interquartile range for each group are shown. Groups were compared by Kruskal-Wallis test, and P values from Dunn’s multiple comparisons test are shown. (F) ROC curve analysis of 14:1c ratio in digested cells from GVHD versus BMT controls. AUC = 0.85. Maximal sensitivity and specificity occurred at a ratio of greater than 0.55.
Figure 2
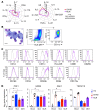
Figure 2. CD14+CD11c+ cells are small migratory macrophages with monocyte antigen expression.
(A) May-Grünwald Giemsa–stained cytospins of CD11c+CD14+ and CD11cCD14+ myeloid cells sorted from GVHD dermis and healthy controls. Representative cells from 2 to 4 concatenated images are shown. Scale bar: 20 μm. (B) Flow cytometry analysis of CD45+HLA-DR+ leukocytes migrating from explanted GVHD or healthy control skin over 48 hours in vitro. Gating as in Figure 1. (C) Comparison of CD14/CD1c ratio in migrating cells from GVHD skin (n = 14) and healthy controls (n = 6). Data are represented as mean ± SEM. ***P = 0.0002, Mann-Whitney U test. (D) Relative expression of selected antigens on CD11c+CD14+ cells migrating from GVHD skin (red line) or healthy control (blue line) compared with isotype control (gray line). Representative data from at least 3 donors are shown.
Figure 3
Figure 3. CD14+CD11c+ myeloid cells are donor-derived macrophages.
(A) PCA of immune gene expression by CD11c+CD14+ GVHD cells and 6 myeloid subsets from healthy control skin. Myeloid cells were sorted from healthy control skin as described in Figure 1 and are annotated accordingly. (B) Heatmap showing unsupervised clustering of CD11c+CD14+ cells from GVHD skin and myeloid cells derived from healthy control skin. Mean log2 expression for each subset is shown. n = 2 for CD141+; n = 3–6 for all other subsets. (C) Example of FISH showing the XY genotype of GVHD macrophages (CD11c+CD14+) and lymphocytes sorted from a female recipient transplanted with a male donor. A single field viewed at ×10 magnification was concatenated to show 8 representative cells per image. Scale bars: 20 μm. (D) Percentages of donor origin analyzed by XY FISH of macrophages (M) and lymphocytes (L) sorted from lesional GVHD skin compared with CD15+ myeloid cells (CD15) and lymphocytes (CD3) sorted from paired blood samples.
Figure 4
Figure 4. GVHD macrophages activate allogeneic T cells.
(A) Proliferation of allogeneic CD4+ and CD8+ cells estimated by CFSE dilution after coculture with DC and macrophage subsets sorted from GVHD or healthy controls. (B) Summary of T cell proliferation (percentage of CFSE dilution) and activation (percentage of CD69+CD8+ T cells and percentage of HLA-DR+ CD4+ T cells) from n = 3 experiments. *P < 0.05, unpaired t test. (C) Heatmap of genes differentially expressed between CD11c+CD14+ monocyte-derived macrophages sorted from healthy control skin (n = 4) and GVHD skin (n = 3) with fold difference in log2 gene expression of greater than 1.3. P < 0.05, unpaired t test. Annotations show functional attributes of genes (based on Entrez Gene summaries) upregulated in GVHD macrophages. (D) CD11c+CD14+ monocyte–derived macrophages sorted from GVHD (n = 3) and healthy control dermis (n = 4) were stimulated with LPS in culture over 10 hours. Chemokine and cytokine production were quantified in supernatants by Luminex assay. Data are represented as mean ± SEM. *P < 0.05; ***P < 0.001, unpaired t test.
Figure 5
Figure 5. Monocytes are poised to differentiate into GVHD macrophages.
(A) Comparison of PBMCs of healthy control, transplant patients without GVHD, and patients with GVHD. CD3CD4+HLA-DR+ monocyte and DC populations were divided into CD14+ classical monocytes and CD14CD16 DCs, including CD123+CD11clo pDC, CD141+ cDC1, and CD1c+ cDC2. Representative examples of 10 experiments are shown. Frequencies of gated CD14+ monocytes and CD1c+ cDC2 are indicated as percentages of HLA-DR+ cells. (B) Ratio of CD14+ monocytes to CD1c+ cDC2 in blood of GVHD patients (n = 15), BMT controls (n = 16), and healthy controls (n = 15) analyzed by flow cytometry, as shown in A. Data are represented as mean + SEM. *P < 0.05; **P < 0.01, 1-way ANOVA and Tukey’s multiple comparison tests. (C) Genes differentially expressed between healthy control monocytes and GVHD classical monocytes (upregulated in red and downregulated in purple) at fold difference in log2 gene expression of greater than 1.3 and P < 0.05. Cells sorted from n = 6 GVHD and n = 3 HC individuals. (D) Radial plot showing mean expression of chemokine genes in whole skin from patients with GVHD (red line; n = 10) and healthy controls (blue line; n = 6). Expression of the corresponding receptors by monocyte, T cell, or both is indicated. (E) Correlation between blood CD14+ monocyte frequency and CD11c+CD14+ content of GVHD dermis in paired blood and skin samples from 10 patients with GVHD. Statistical test by linear regression.
Figure 6
Figure 6. Allostimulated monocytes resemble GVHD macrophages.
(A) Radial plots of cytokine quantity in supernatants from GVHD explants cultured for 48 hours (red line) and BMT donor-recipient MLRs cultured for 7 days (purple line). Lines show mean cytokine concentration from n = 12 (GVHD) and n = 6 (MLR) experiments. IL-9, IL12p70, IL-23, IL-31, and TNF-β are not shown because they were not detected in any specimens. (B) May-Grünwald Giemsa cytospin morphology, scatter properties, and CD11c/CD14 expression by MLR macrophages, isolated on day 7. Scale bar: 20 μM. (C) Expression of selected antigens, previously used to define GVHD macrophages, by allostimulated CD11c+CD14+ cells from BMT donor-recipient MLRs (specific staining in purple; isotype control in gray). Representative histograms from more than 3 analyses are shown. (D) Expression of cytotoxic effector genes in CD14+ blood monocytes, skin CD11c+CD14+ cells, and MLR macrophages. Columns indicate mean and bars SEM of n = 3–6 values; *P < 0.05, Kruskal-Wallis test with P values from Dunn’s multiple comparison tests is shown.
Figure 7
Figure 7. Cytoxicity of alloactivated macrophages in vitro.
(A) Direct cytotoxicity of MLR macrophages to the keratinocyte cell line HaCaT was assessed by coculture of HaCaT and MLR macrophages at a range of effector/target ratios for 5 hours. Keratinocytes were identified as CD45 cells by flow cytometry, and the proportion of dead keratinocytes was quantified by annexin V and 7-AAD staining. Representative flow cytometry plots from keratinocytes alone (top row) and keratinocytes cultured with MLR macrophages at a 50:1 ratio (bottom row). (B) Quantitation of keratinocyte apoptosis versus effector/target ratio in 2 independent experiments. (C) Experiments using the skin-explant model of GVHD (see Methods for details). MLR outputs were sorted to yield macrophages and lymphocytes and cocultured with shave biopsies of recipient skin for 3 days. Explants were fixed and stained with H&E. Representative images from explants cultured for 3 days in control medium or medium with MLR macrophages, as indicated. (D) Summary of histological damage to the dermoepidermal junction graded on the Lerner scale from 6 independent experiments. **P < 0.01, Kruskal-Wallis and Dunn’s multiple comparison tests. Mac, macrophages; lymph, lymphocytes.

Comment in

Similar articles

Cited by

References

    1. D’Souza A, Lee S, Zhu X, Pasquini M. Current use and trends in hematopoietic cell transplantation in the United States. Biol Blood Marrow Transplant. 2017;23(9):1417–1421. doi: 10.1016/j.bbmt.2017.05.035. - DOI - PMC - PubMed
    1. Zeiser R, Blazar BR. Acute graft-versus-host disease - biologic process, prevention, and therapy. N Engl J Med. 2017;377(22):2167–2179. doi: 10.1056/NEJMra1609337. - DOI - PMC - PubMed
    1. Panoskaltsis-Mortari A, et al. An official American Thoracic Society research statement: noninfectious lung injury after hematopoietic stem cell transplantation: idiopathic pneumonia syndrome. Am J Respir Crit Care Med. 2011;183(9):1262–1279. doi: 10.1164/rccm.2007-413ST. - DOI - PMC - PubMed
    1. Koyama M, Hill GR. Alloantigen presentation and graft-versus-host disease: fuel for the fire. Blood. 2016;127(24):2963–2970. doi: 10.1182/blood-2016-02-697250. - DOI - PubMed
    1. Piper KP, et al. CXCL10-CXCR3 interactions play an important role in the pathogenesis of acute graft-versus-host disease in the skin following allogeneic stem-cell transplantation. Blood. 2007;110(12):3827–3832. doi: 10.1182/blood-2006-12-061408. - DOI - PubMed

Publication types