. 2020 Aug;16(8):876-886.
doi: 10.1038/s41589-020-0553-6. Epub 2020 May 25.

PGE1 and PGA1 bind to Nurr1 and activate its transcriptional function

Affiliations

PGE1 and PGA1 bind to Nurr1 and activate its transcriptional function

Sreekanth Rajan et al. Nat Chem Biol. 2020 Aug.

Abstract

The orphan nuclear receptor Nurr1 is critical for the development, maintenance and protection of midbrain dopaminergic (mDA) neurons. Here we show that prostaglandin E1 (PGE1) and its dehydrated metabolite, PGA1, directly interact with the ligand-binding domain (LBD) of Nurr1 and stimulate its transcriptional function. We also report the crystallographic structure of Nurr1-LBD bound to PGA1 at 2.05 Å resolution. PGA1 couples covalently to Nurr1-LBD by forming a Michael adduct with Cys566, and induces notable conformational changes, including a 21° shift of the activation function-2 helix (H12) away from the protein core. Furthermore, PGE1/PGA1 exhibit neuroprotective effects in a Nurr1-dependent manner, prominently enhance expression of Nurr1 target genes in mDA neurons and improve motor deficits in 1-methyl-4-phenyl-1,2,3,6-tetrahydropyridine-lesioned mouse models of Parkinson's disease. Based on these results, we propose that PGE1/PGA1 represent native ligands of Nurr1 and can exert neuroprotective effects on mDA neurons, via activation of Nurr1's transcriptional function.


Figures

Extended Data Fig. 1 |
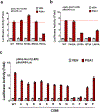
Extended Data Fig. 1 |. Identification of PGE1 from brain tissue extract.
(a) Isolation of endogenous ligand candidates using a combination of boiling, acetone precipitation, and ultrafiltration (3,000 molecular weight cut-off). Fractions were monitored for their Nurr1-enhancing activity using a cell-based luciferase assay system. Nurr1-enhancing activity was unaffected by boiling and acetone precipitation. n = 3 independent experiments, Data are presented as mean ± s.d. (b) Following ultrafiltration, filtrates were fractionated by HPLC column C-18 and each fraction was assayed for Nurr1-activating activities. Fraction 5 contained the most activity and thus was used for the mass spectrometry (MS) analysis. n = 3 independent experiments, Data are presented as mean ± s.d. (c) Candidate compounds that are tested after identification by an ultra-performance liquid chromatography quadrupole time of flight mass spectrometry (UPLC-qTOF-MS/MS).
Extended Data Fig. 2 |
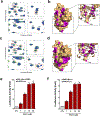
Extended Data Fig. 2 |. Direct binding of PGE1 and PGA1 to Nurr1-LBD.
(a-f) Molecular interaction of Nurr1-LBD with PGE1 (a and b) and PGA1 (c and d) studied using 2D HSQC NMR titration experiments with uniformly 15N-labeled Nurr1-LBD. (a) Close-up view of a section of the overlay of free Nurr1-LBD (red) and Nurr1-LBD with PGE1 (1:4, green; 1:10, blue), with residues showing chemical shift perturbations (with arrows) or intensity changes (boxed in red) labelled. (b) Selected residues were mapped on the crystal structure of Nurr1-LBD (PDB: 1OVL) in surface representation, with a close-up section (as inset) showing affected helices H4, H11 and H12, with amino acid residues indicated. (c) Close-up view of a section of the overlay of free Nurr1-LBD (red) and Nurr1-LBD with PGA1 (1:5, green; 1:10, blue), with residues showing chemical shift perturbations (with arrows) or intensity changes (boxed in red) labelled. Residues (Leu559, Gln571 and Thr595) showing additional peaks upon PGA1 incubation are marked with asterisks (*). This indicates that the PGE1 (a) and PGA1 (c) interaction with Nurr1-LBD matches the typical two-state binding model (P + L ⇆ PL) and an induced-fit binding model (P + L ⇆ PLopen → PLclosed), respectively. (d) Mapping of Nurr1-LBD residues perturbed in the presence of PGA1 reveals that both PGE1 (a and b) and PGA1 (c and d) recognize the same binding region on Nurr1-LBD, with maximum perturbation observed in helices H11 and H12. Residues showing chemical shifts and line broadening are coloured in purple while L410 is coloured in red (b and d), as its peak disappeared upon PGA1 binding. (e, f) PGA1 increases the transcriptional activity of Nurr1-based reporter constructs: Nurr1-LBD-dependent (e) and full-length Nurr1-dependent (f) transcriptional activities in SK-N-BE(2)C cells. n = 3 independent experiments, Data are presented as mean ± s.e.m.
Extended Data Fig. 3 |
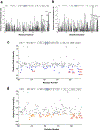
Extended Data Fig. 3 |. Chemical shift perturbation plot of Nurr1-LBD upon PGE1 and PGA1 binding.
Chemical shift perturbation plot of Nurr1-LBD upon PGE1 (a) / PGA1 (b) binding (1:10 ratio) and their corresponding peak intensity plots (PGE1 (c) / PGA1 (d)) revealing residues with perturbed resonances and/or line broadening upon ligand binding. (*) denotes the peak belonging to L410 which disappeared upon PGA1 binding.
Extended Data Fig. 4 |
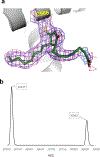
Extended Data Fig. 4 |. PGE1 conversion to PGA1 under crystal condition.
(a) The overlaid 2Fo-Fc (blue) and composite omit (pink) electron density maps contoured at 1a cut-off confirming the conversion of PGE1 to PGA1, evident from the covalent bonding density with Cys566. (b) Mass spectrometry data of PGE1 incubated with Nurr1-LBD under crystallization buffer condition (100 mM MES, pH 5.5 and 200 mM MgCl2) confirming the conversion of PGE1 to PGA1, as revealed by the covalent complex molecular mass of 30,862 Da (Nurr1-LBD328–598 is 30,525 Da and PGA1 is 336.5 Da).
Extended Data Fig. 5 |
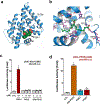
Extended Data Fig. 5 |. Crystal structure of PGA1-bound Nurr1-LBD and its molecular and functional analyses.
(a) Cartoon representation of Nurr1-LBD (blue) with PGA1 shown in sphere mode. (b) Interactions between PGA1 and Nurr1 residues (labelled) through hydrophobic contacts (grey broken lines) and hydrogen bonds (blue broken lines). Only chain B in the asymmetric unit are shown here, as the electron density for the PGA1 attached to this chain was complete. (c) PGJ2 and 15d-PGJ2 show no effect on the transcriptional activity of Nurr1-LBD. n = 3 independent experiments, Data are presented as mean ± s.e.m. (d) 15d-PGJ2 (3 μM), but not PGE1 (1 μM) or PGA1 (10 μM), induces the transcriptional activity of PPARγ-LBD.
Extended Data Fig. 6 |
Extended Data Fig. 6 |. Effects of mutations at Nurr1 residues interacting with the chain B (Arg515, His516, Arg563, Thr567).
(a), with the chain A (Phe443, Leu570, Ile573, Leu591) (b), and effects of mutations at the residue Cys566 (c) on PGA1 (10 μM)-induced transcriptional activation of Nurr1-LBD in SK-N-BE(2)C cells. n = 3 independent experiments, Data are presented as mean±s.e.m.
Extended Data Fig. 7 |
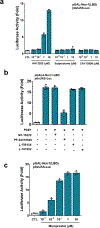
Extended Data Fig. 7 |. Effects of EP2 agonists and antagonists on the transcriptional activity of Nurr1-LBD.
(a) The EP2 agonist, AH13205 activates Nurr1’s transcriptional activity, whereas EP3/EP4 agonists (Sulprostone and CAY10598) do not. (b) EP2 antagonist, PF-04418948 suppresses PGE1-induced transcriptional activation of Nurr1, whereas EP1/EP3/EP4 antagonists (SC-19220, L-798106, and L-161982) do not. (c) The synthetic PGE1 analogue misoprostol, activates Nurr1’s transcriptional activity in SK-N-BE(2)C cells. n = 3 independent experiments, Data are presented as mean ± s.e.m.
Extended Data Fig. 8 |
Extended Data Fig. 8 |. Protective effects of PGE1 and PGA1 against MPP+ in MN9D cells.
(a, b) Determination of protective effects of PGE1 and PGA1 in MN9D cells under MPP+-induced oxidative stress measured by MTT reduction. (a) Cells were treated with MPP+ (0–1000 μM) for 24 hrs. Cell viabilities assessed by MTT reduction assay show that treatment with 500 μM of MPP+ significantly induces 50% of cell death. (b) Pre-treatments with PGE1/PGA1 (24 hrs prior to MPP+ treatment) increase cell viability against the MPP+ induced oxidative stress in MN9D cells. *P<0.05, **P<0.01 compared to 0 μM; ###P< 0.001 compared to the absence of MPP+, unpaired two-tailed t-test; n = 3 independent samples per group. Data are mean ± s.e.m. (c, d) Protective effects of PGE1 and PGA1 measured by LDH release. (c) Cytotoxicity determined by LDH release assay also reveals that treatment with 500 μM of MPP+ significantly induces 50% of cell death in MN9D cells. (d) Similar to MTT reduction assay, pre-treatments with PGE1/PGA1 reduce cytotoxicity under the MPP+-induced oxidative stress. **P<0.01, ***P< 0.001 compared to 0 μM; ###P< 0.001 compared to the absence of MPP+, unpaired two-tailed t-test; n = 3 independent samples per group. Data are mean ± s.e.m.
Extended Data Fig. 9 |
Extended Data Fig. 9 |. Effects of PGE1/PGA1 in the MPTP-induced reduction of DA levels.
The administration of PGE1/PGA1 significantly restores the MPTP-induced reduction of DA levels in the SN (a) and in the striatum (b). One-way ANOVA, Tukey’s post-hoc test; n = 5 per group. Data are mean ± s.e.m.
Extended Data Fig. 10 |
Extended Data Fig. 10 |. Mass spectrometry data between PGA1 and Nurr1-LBD under NMR condition.
Mass spectrometry data confirming the formation of the covalent bond between PGA1 (red line) with Nurr1-LBD356–598 (28.03 5 kDa), while PGE1 (blue dotted line) does not form such a covalent attachment under the NMR buffer conditions (20 mM sodium phosphate (pH 7.5) buffer containing 50 mM NaCl, 0.01% NaN3 in 90% H2O/10% D2O). The apo Nurr1-LBD356–598 (black line) (27.698 kDa) is shown for reference. The molecular weight of PGA1 is 336.5 Da. This also corroborates with the two-state binding and induced-fit model observed from NMR data (Extended Data Fig. 2a, c).
Fig. 1 |
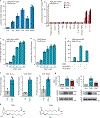
Fig. 1 |. Identification of PGE1 and 8-iso-PGE1 as Nurr1 activators from brain tissue extracts.
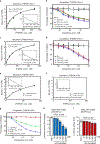
a, Brain, lung, heart and kidney tissue extracts increase the transcriptional activity of Nurr1-LBD-based reporter constructs. Amodiaquine (AQ) (10 μM) was used as positive control. n = 3 independent experiments. Data are presented as mean ± s.d. b, PGE1 and 8-iso PGE1 increase transcriptional activity of Nurr1-LBD in a dose-dependent manner. Amodiaquine (30 μM) was used as positive control. n = 2 independent experiments. Data are presented as mean± s.d. c,d, PGE1 also induces Nurr1-LBD-dependent (c) and full-length Nurr1-dependent (d) transcriptional activity in a dose-dependent manner. n = 3 independent experiments. Data are presented as mean± s.e.m. e, PGE1 (1 μM)-induced Nurr1 activation is potentiated by transcriptional coactivators, SRC1 and SRC3 in SK-N-BE(2)C cells. n = 3 independent experiments. Data are presented as mean±s.e.m. f, ChIP assay using antibodies against Nurr1, SRC1 and SRC3 in rat pheochromocytoma PC12 cells untreated or treated with PGE1 (1 μM). The TH promoter sequence including the Nurr1 binding site (NL3) was detected by rtPCR. The treatment of PGE1 significantly increases the binding on NL3 sequence of Nurr1 (3.27±0.44, P = 0.017), SRC1 (4.86±0.50, P=0.015) and SRC3 (2.50±0.15, P = 0.009). n = 3 independent experiments. Data are presented as mean±s.e.m., *P<0.05, **P<0.01, two-tailed Welch’s t-test. g, Co-IP assays show that treatment with PGE1 (1 μM) augments Nurr1’s interaction with SRC1 (4.33 ± 0.03) or SRC3 (11.24 ± 0.24) in SK-N-BE(2)C cells. The application of PGA1 (10 μM) also increases Nurr1’s interaction with SRC1 (3.00 ±0.12) or SRC3 (2.16 ±0.12). n = 3 independent experiments, Data are presented as mean±s.e.m., **P<0.01, ***P<0.001 (one-way ANOVA, Tukey’s post hoc test). h, Chemical diagram of PGE1 and PGA1 indicating the Michael addition center (*, C11) in PGA1, which is attached to a hydroxyl group in PGE1.
Fig. 2 |
Fig. 2 |. Crystal structure of PGA1-bound Nurr1-LBD and its molecular and functional analyses.
a, The 2Fo-Fc electron density map (pink color) contoured at 1σ cut-off clearly reveals the covalent bond (within black circle) between the sulfur of Cys566 and cyclopentenone C11 of PGA1, as well as the well-ordered PGA1 packed between helices H4, H11 and H12. b, MS data confirming that PGA1 is covalently attached to Nurr1-LBD. The MS data for apo (top), PGE1 (middle) and PGA1 (bottom) bound Nurr1-LBD, reveals the presence of covalent complex formation in the presence of PGA1 but not PGE1, as shown by the combined molecular mass of 30,862 Da (Nurr1-LBD328–598 is 30,525 Da and PGA1 is 336.5 Da). c, Functional effects of mutations in the potential PGA1 binding residues on Nurr1’s transcriptional activity. Wild-type (WT) and mutant constructs (C566F, T567A, L570A, I573A or L591A) were examined by luciferase reporter assay with or without PGA1 (10 μM). The mutant constructs show a significant reduction in Nurr1’s transcriptional activity. The mean and error values are as following: WT (7.75 ± 0.37), C566F (1.59 ± 0.14), T567A (2.14 ± 0.20), L570A (2.32 ± 0.18), I573A (1.26 ± 0.03) and L591A (3.52 ± 0.31). n = 3 independent experiments, Data are presented as mean ± s.e.m., ***P < 0.001 compared with PGA1-treated WT (one-way ANOVA, Tukey’s post hoc test). d, Mutations do not affect the protein expression levels. n = 3 independent experiments.
Fig. 3 |
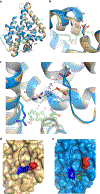
Fig. 3 |. Structural comparison of apo and PGA1-bound Nurr1-LBD.
a, Cartoon representation of the superposition of the PGA1 bound to Nurr1 (blue) with its apo form (pale yellow) revealing a shift of the helix H12 by 21° away from the protein core, enabling the binding of PGA1 shown in stick mode. b, PGA1 binding leads to a ~3.0Å expansion of the salt-bridge between residues Glu440 and Lys590. c-e, Similarly, the distance between residues Glu514 and Arg563 also expands by ~8Å (c). As a result, the surface pocket area formed by the H9-H11 wedge enlarges considerably in the PGA1 bound form (e) in comparison with the apo form (d).
Fig. 4 |
Fig. 4 |. Direct binding of PGE1/PGA1 to Nurr1-LBD or EP2.
a-d, Saturation and competition assays of PGE1/PGA1 with Nurr1-LBD. a, Nurr1-LBD protein was incubated with increasing concentrations (31.3, 62.5, 125, 250 and 500 nM) of [3H]-PGE1 for saturation assay. The inset indicates Scatchard analysis of the specific binding. b, Competition of PGE1, PGA1, misoprostol, 15d-PGJ2 or retinoic acid for binding of [3H]-PGE1 to Nurr1-LBD. Increasing concentrations of unlabeled competitors were incubated with 500nM of [3H]-PGE1 and 0.2 μM of Nurr1-LBD. c, Similar to [3H]-PGE1, Nurr1-LBD was incubated with 7.8, 15.6, 31.3, 62.5, 125, 250 and 500 nM of [3H]-PGA1. d, Unlabeled PGE1, PGA1, 15d-PGJ2 or retinoic acid were incubated with 1 μM of [3H]-PGA1 and 0.2 μM of Nurr1-LBD for competition assay. n = 3 independent samples per group. Data are mean±s.e.m. e-g, Saturation and competition assays of PGE1/PGA1 with EP2. e,f, EP2 protein (0.38 μM) was incubated with 31.25, 62.5, 125 and 250 nM of [3H]-PGE1 (e) or [3H]-PGA1 (f) for saturation assay. Contrary to [3H]-PGE1, [3H]-PGA1 does not interact with EP2. g, Competition of PGE1, PGA1, misoprostol or 15d-PGJ2 for binding of [3H]-PGE1 to EP2. n = 3 independent samples per group. Data are mean± s.e.m. h,i, PF-04418948 effectively inhibits PGE1-induced transcriptional activity of Nurr1 in MN9D cells (h). PF-04418949 only marginally inhibits PGA1-induced transcriptional activity of Nurr1 in MN9D cells (i). *P< 0.05, **P< 0.01, ***P< 0.001 compared to PGE1/PGA1 only, unpaired two-tailed t-test; n = 3 independent samples per group. Data are mean±s.e.m.
Fig. 5 |
Fig. 5 |. Neuroprotective effect of PGE1/PGA1 is dependent on Nurr1.
a-d, Protective effects of PGE1 and PGA1 on cell viability and cytotoxicity measured by MTT reduction and LDH release in MN9D cells. Nurr1 overexpression (OE) potentiates the protective effects of PGE1 (3 μM) and PGA1 (5 μM) both in the normal condition and MPP+-induced toxic condition compared to Mock OE (a,c). Nurr1 knockdown (KD), however, attenuates PGE1/PGA1’s protective effects under both normal and MPP+-induced toxic conditions (b,d). *P<0.05, ***P< 0.001 compared to VEH treatment under Mock or Scramble conditions; #P< 0.05, ##P<0.01, ###P<0.001 compared between each treatment group, one-way ANOVA, Tukey’s post hoc test; n = 4 independent samples per group. Data are mean±s.e.m. e-g, PGE1 (e,f) or PGA1 (e,g) treatment ameliorates both MPP+- and LPS-induced losses of TH-positive mDA neurons at nanomolar ranges in primary mDA-glia cocultures isolated from rat embryonic ventral mesencephalic area. Scale bars in e, 100 μm. *P<0.05, **P< 0.01, ***P< 0.001 compared to 0nM, unpaired two-tailed t-test; n = 3 biologically independent samples per group. Data are mean±s.e.m. from two biologically independent experiments.
Fig. 6 |
Fig. 6 |. Neuroprotective effects of PGE1 and PGA1 in the MPTP-induced PD mouse model.
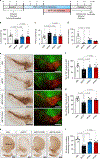
a, Schematic representation of PGE1 and PGA1 administrations to MPTP-treated mice. PGE1 and PGA1 (2 mg kg−1) were administered 3 d before subchronic MPTP regimen (30 mg kg−1 d−1, 5d) and continued during MPTP administration until day 8. b-d, Motor behaviors were assessed on the days indicated in a; PGE1 and PGA1 treatments significantly rescue motor deficits on the rotarod latency to fall (b) and reduce time to traverse on a pole (c) compared to MPTP treatment: PGE1-treated mice recovered rearing numbers in the cylinder test (d). One-way ANOVA, Tukey’s post hoc test; n = 8 per group. Data are mean±s.e.m. e-i, Immunohistochemical analyses of subchronic MPTP-treated mice after PGE1 and PGA1 administrations. The administration of PGE1 or PGA1 significantly rescues TH-positive DA neurons (e,f) and NeuN-positive neurons (g) in the SN and retains TH density (h,i) in the striatum compared to MPTP-treated mice. *P<0.05, **P<0.01, ***P< 0.001, one-way ANOVA, Tukey’s post hoc test; n = 8 per group. Data are mean±s.e.m.

Similar articles

Cited by

References

    1. Mangelsdorf DJ et al. The nuclear receptor superfamily: the second decade. Cell 83, 835–839 (1995). - PMC - PubMed
    1. Evans RM & Mangelsdorf DJ Nuclear receptors, RXR, and the big bang. Cell 157, 255–266 (2014). - PMC - PubMed
    1. Kliewer SA, Lehmann JM & Willson TM Orphan nuclear receptors: shifting endocrinology into reverse. Science 284, 757–760 (1999). - PubMed
    1. Kurakula K, Koenis DS, van Tiel CM & de Vries CJ NR4A nuclear receptors are orphans but not lonesome. Biochim Biophys. Acta 1843, 2543–2555 (2014). - PubMed
    1. Pearen MA & Muscat GE Minireview: nuclear hormone receptor 4A signaling: implications for metabolic disease. Mol. Endocrinol 24, 1891–1903 (2010). - PMC - PubMed

Publication types

MeSH terms