

miR-26a Attenuated Bone-Specific Insulin Resistance and Bone Quality in Diabetic Mice
- PMID: 32278305
- PMCID: PMC7150437
- DOI: 10.1016/j.omtn.2020.03.010
miR-26a Attenuated Bone-Specific Insulin Resistance and Bone Quality in Diabetic Mice
Abstract
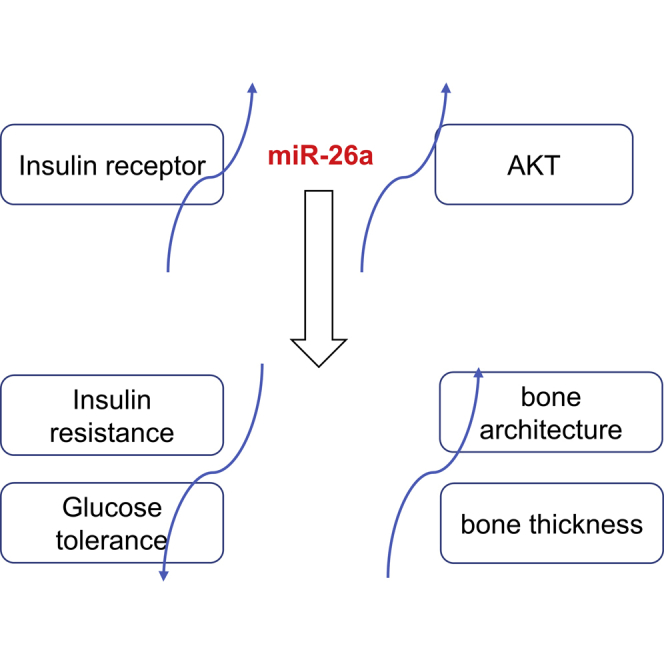
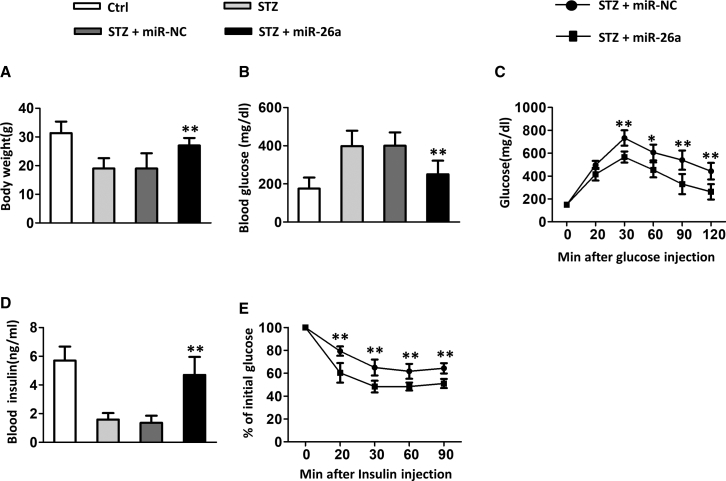
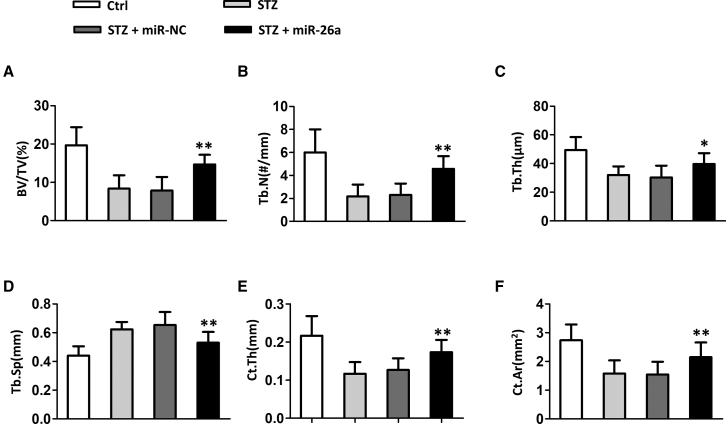
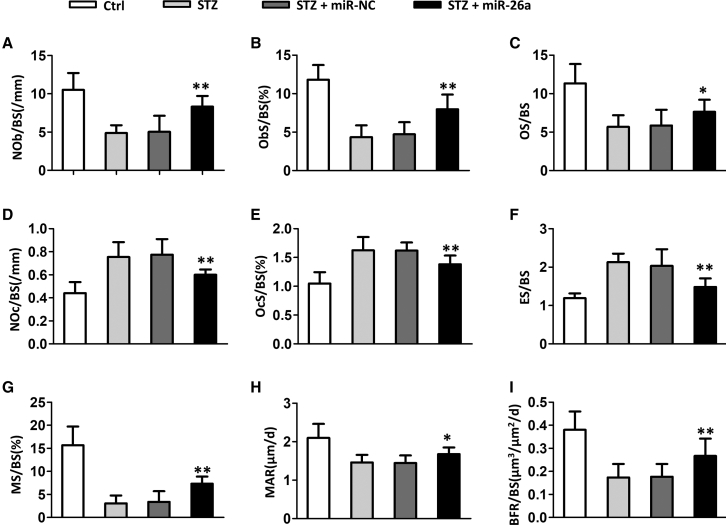
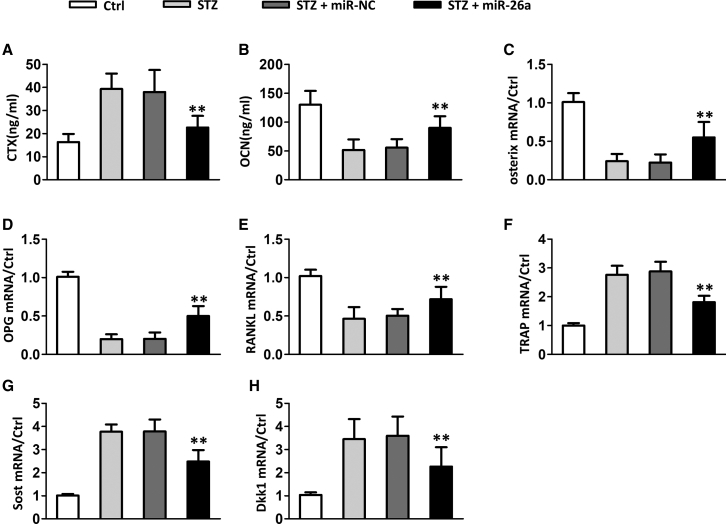
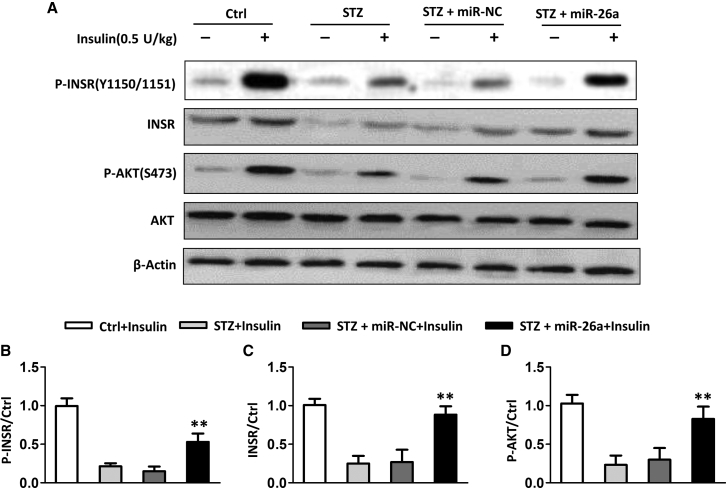
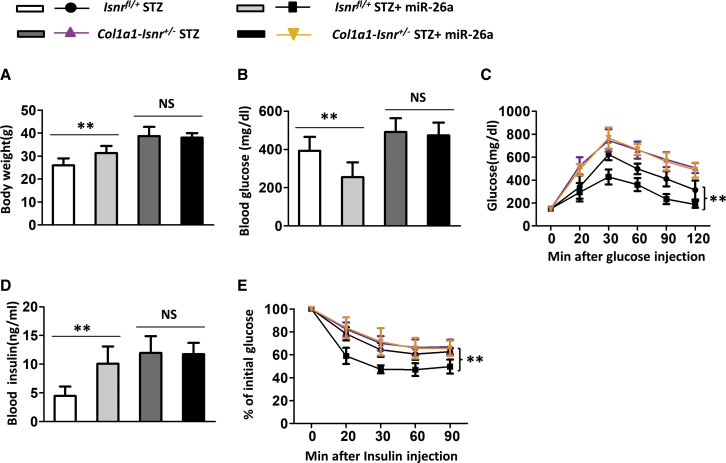
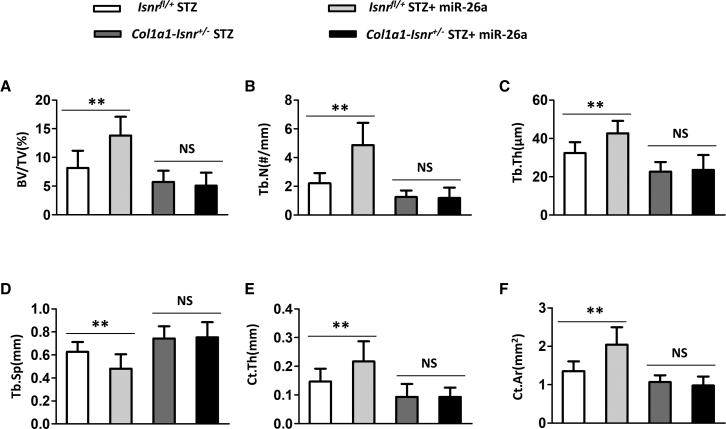
Diabetes mellitus is a prevalent disease result in several complications, including bone problems. Previous studies have shown that microRNA (miR)-26a regulates glucose metabolism and plays a protective role in diabetes. However, whether miR-26a also affects bone quality in diabetes remains unknown. In the present study, we evaluated the potential effects of miR-26a on bone in diabetic mice. We administrated miR-26a in streptozotocin-induced diabetic mice. The metabolic parameters, bone quality, osteoblast and osteoclast markers, and insulin signaling activation were measured. miR-26a ameliorated insulin resistance and glucose tolerance, improved bone microarchitecture and quality, increased osteoblasts and bone formation, decreased osteoclasts, and promoted the insulin signaling pathway in diabetic mice. These effects were abolished in insulin receptor-compromised Col1a1-Insr+/- mice. In conclusion, miR-26a could ameliorate bone-specific insulin resistance and bone quality in diabetic mice, which depended on the insulin receptors on osteoblasts. Our findings highlight the potential of miR-26a as a therapeutic target for diabetes mellitus-related bone metabolism and diseases.
Keywords: bone; diabetes; insulin receptor; miR-26a.
Copyright © 2020 The Author(s). Published by Elsevier Inc. All rights reserved.
Figures
Similar articles
-
MicroRNA-26a regulates insulin sensitivity and metabolism of glucose and lipids.J Clin Invest. 2015 Jun;125(6):2497-509. doi: 10.1172/JCI75438. Epub 2015 May 11. J Clin Invest. 2015. PMID: 25961460 Free PMC article. Clinical Trial.
-
Regulation of impaired angiogenesis in diabetic dermal wound healing by microRNA-26a.J Mol Cell Cardiol. 2016 Feb;91:151-9. doi: 10.1016/j.yjmcc.2016.01.007. Epub 2016 Jan 9. J Mol Cell Cardiol. 2016. PMID: 26776318 Free PMC article.
-
Pancreatic β cell microRNA-26a alleviates type 2 diabetes by improving peripheral insulin sensitivity and preserving β cell function.PLoS Biol. 2020 Feb 24;18(2):e3000603. doi: 10.1371/journal.pbio.3000603. eCollection 2020 Feb. PLoS Biol. 2020. PMID: 32092075 Free PMC article.
-
Possible roles of insulin signaling in osteoblasts.Endocr Res. 2014;39(4):144-51. doi: 10.3109/07435800.2013.879168. Epub 2014 Mar 28. Endocr Res. 2014. PMID: 24679227 Review.
-
MicroRNA-26a: An Emerging Regulator of Renal Biology and Disease.Kidney Blood Press Res. 2019;44(3):287-297. doi: 10.1159/000499646. Epub 2019 Jun 4. Kidney Blood Press Res. 2019. PMID: 31163420 Review.
Cited by
-
miR-26a is a Key Therapeutic Target with Enormous Potential in the Diagnosis and Prognosis of Human Disease.Curr Med Chem. 2024;31(18):2550-2570. doi: 10.2174/0109298673271808231116075056. Curr Med Chem. 2024. PMID: 38204224 Review.
-
Noncoding RNAs in subchondral bone osteoclast function and their therapeutic potential for osteoarthritis.Arthritis Res Ther. 2020 Nov 25;22(1):279. doi: 10.1186/s13075-020-02374-x. Arthritis Res Ther. 2020. PMID: 33239099 Free PMC article. Review.
-
Cohort-specific boolean models highlight different regulatory modules during Parkinson's disease progression.iScience. 2024 Sep 14;27(10):110956. doi: 10.1016/j.isci.2024.110956. eCollection 2024 Oct 18. iScience. 2024. PMID: 39429779 Free PMC article.
-
MicroRNAs, Parkinson's Disease, and Diabetes Mellitus.Int J Mol Sci. 2021 Mar 14;22(6):2953. doi: 10.3390/ijms22062953. Int J Mol Sci. 2021. PMID: 33799467 Free PMC article. Review.
-
MiR-26a regulates the expression of serum IGF-1 in patients with osteoporosis and its effect on proliferation and apoptosis of mouse chondrocytes.J Musculoskelet Neuronal Interact. 2021 Jun 1;21(2):298-307. J Musculoskelet Neuronal Interact. 2021. PMID: 34059575 Free PMC article.
References
-
- Yan W., Li X. Impact of diabetes and its treatments on skeletal diseases. Front. Med. 2013;7:81–90. - PubMed
-
- Inaba M., Terada M., Koyama H., Yoshida O., Ishimura E., Kawagishi T., Okuno Y., Nishizawa Y., Otani S., Morii H. Influence of high glucose on 1,25-dihydroxyvitamin D3-induced effect on human osteoblast-like MG-63 cells. J. Bone Miner. Res. 1995;10:1050–1056. - PubMed
-
- Botolin S., McCabe L.R. Chronic hyperglycemia modulates osteoblast gene expression through osmotic and non-osmotic pathways. J. Cell. Biochem. 2006;99:411–424. - PubMed
-
- Vestergaard P. Discrepancies in bone mineral density and fracture risk in patients with type 1 and type 2 diabetes--a meta-analysis. Osteoporos. Int. 2007;18:427–444. - PubMed
LinkOut - more resources
Full Text Sources
Miscellaneous
