

Annual report to the nation on the status of cancer, part I: National cancer statistics
- PMID: 32162336
- PMCID: PMC7299151
- DOI: 10.1002/cncr.32802
Annual report to the nation on the status of cancer, part I: National cancer statistics
Abstract
Background: The American Cancer Society, the Centers for Disease Control and Prevention, the National Cancer Institute, and the North American Association of Central Cancer Registries collaborate to provide annual updates on cancer occurrence and trends in the United States.
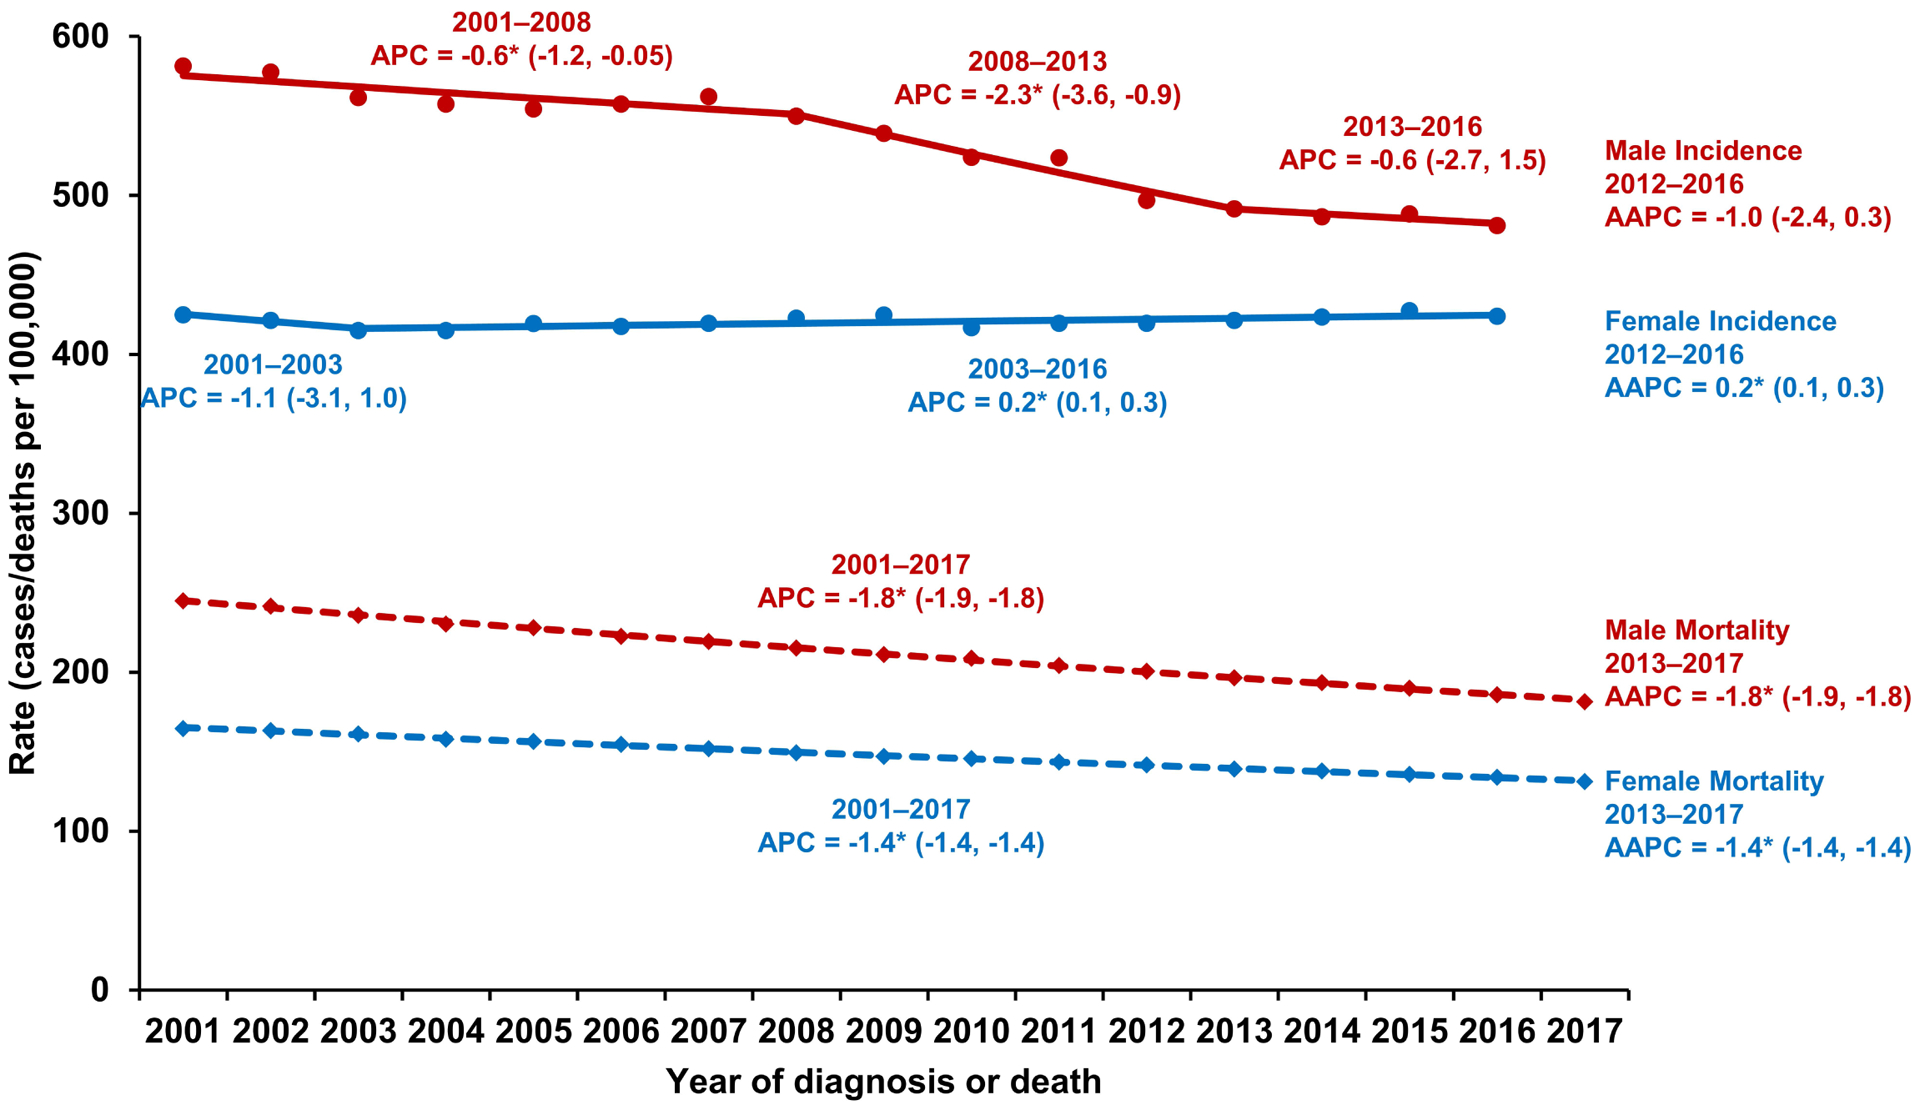
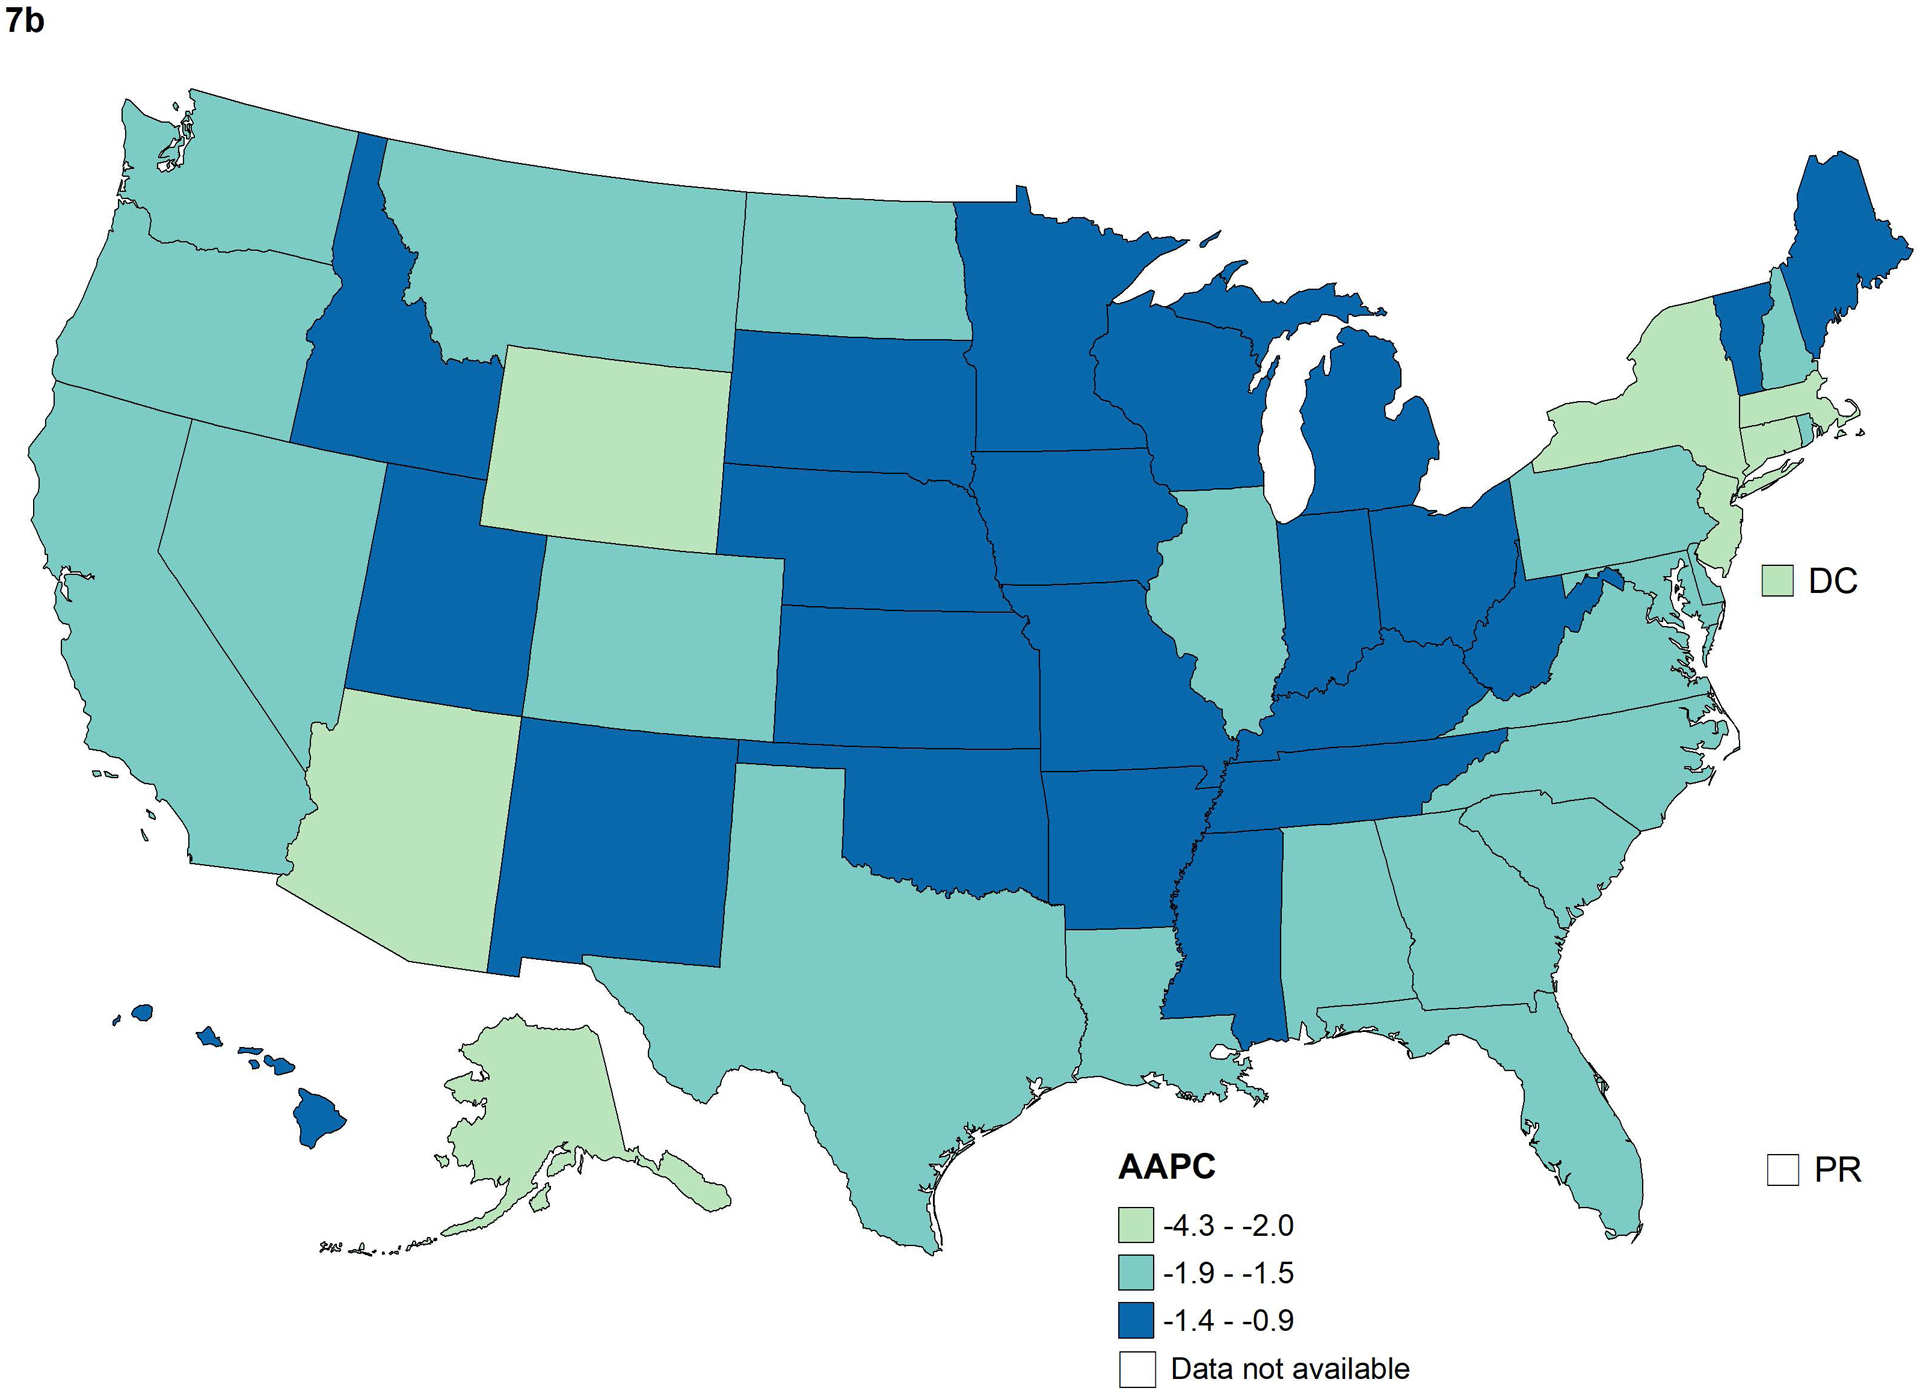
Methods: Data on new cancer diagnoses during 2001 through 2016 were obtained from the Centers for Disease Control and Prevention-funded and National Cancer Institute-funded population-based cancer registry programs and compiled by the North American Association of Central Cancer Registries. Data on cancer deaths during 2001 through 2017 were obtained from the National Center for Health Statistics' National Vital Statistics System. Trends in incidence and death rates for all cancers combined and for the leading cancer types by sex, racial/ethnic group, and age were estimated by joinpoint analysis and characterized by the average annual percent change during the most recent 5 years (2012-2016 for incidence and 2013-2017 for mortality).
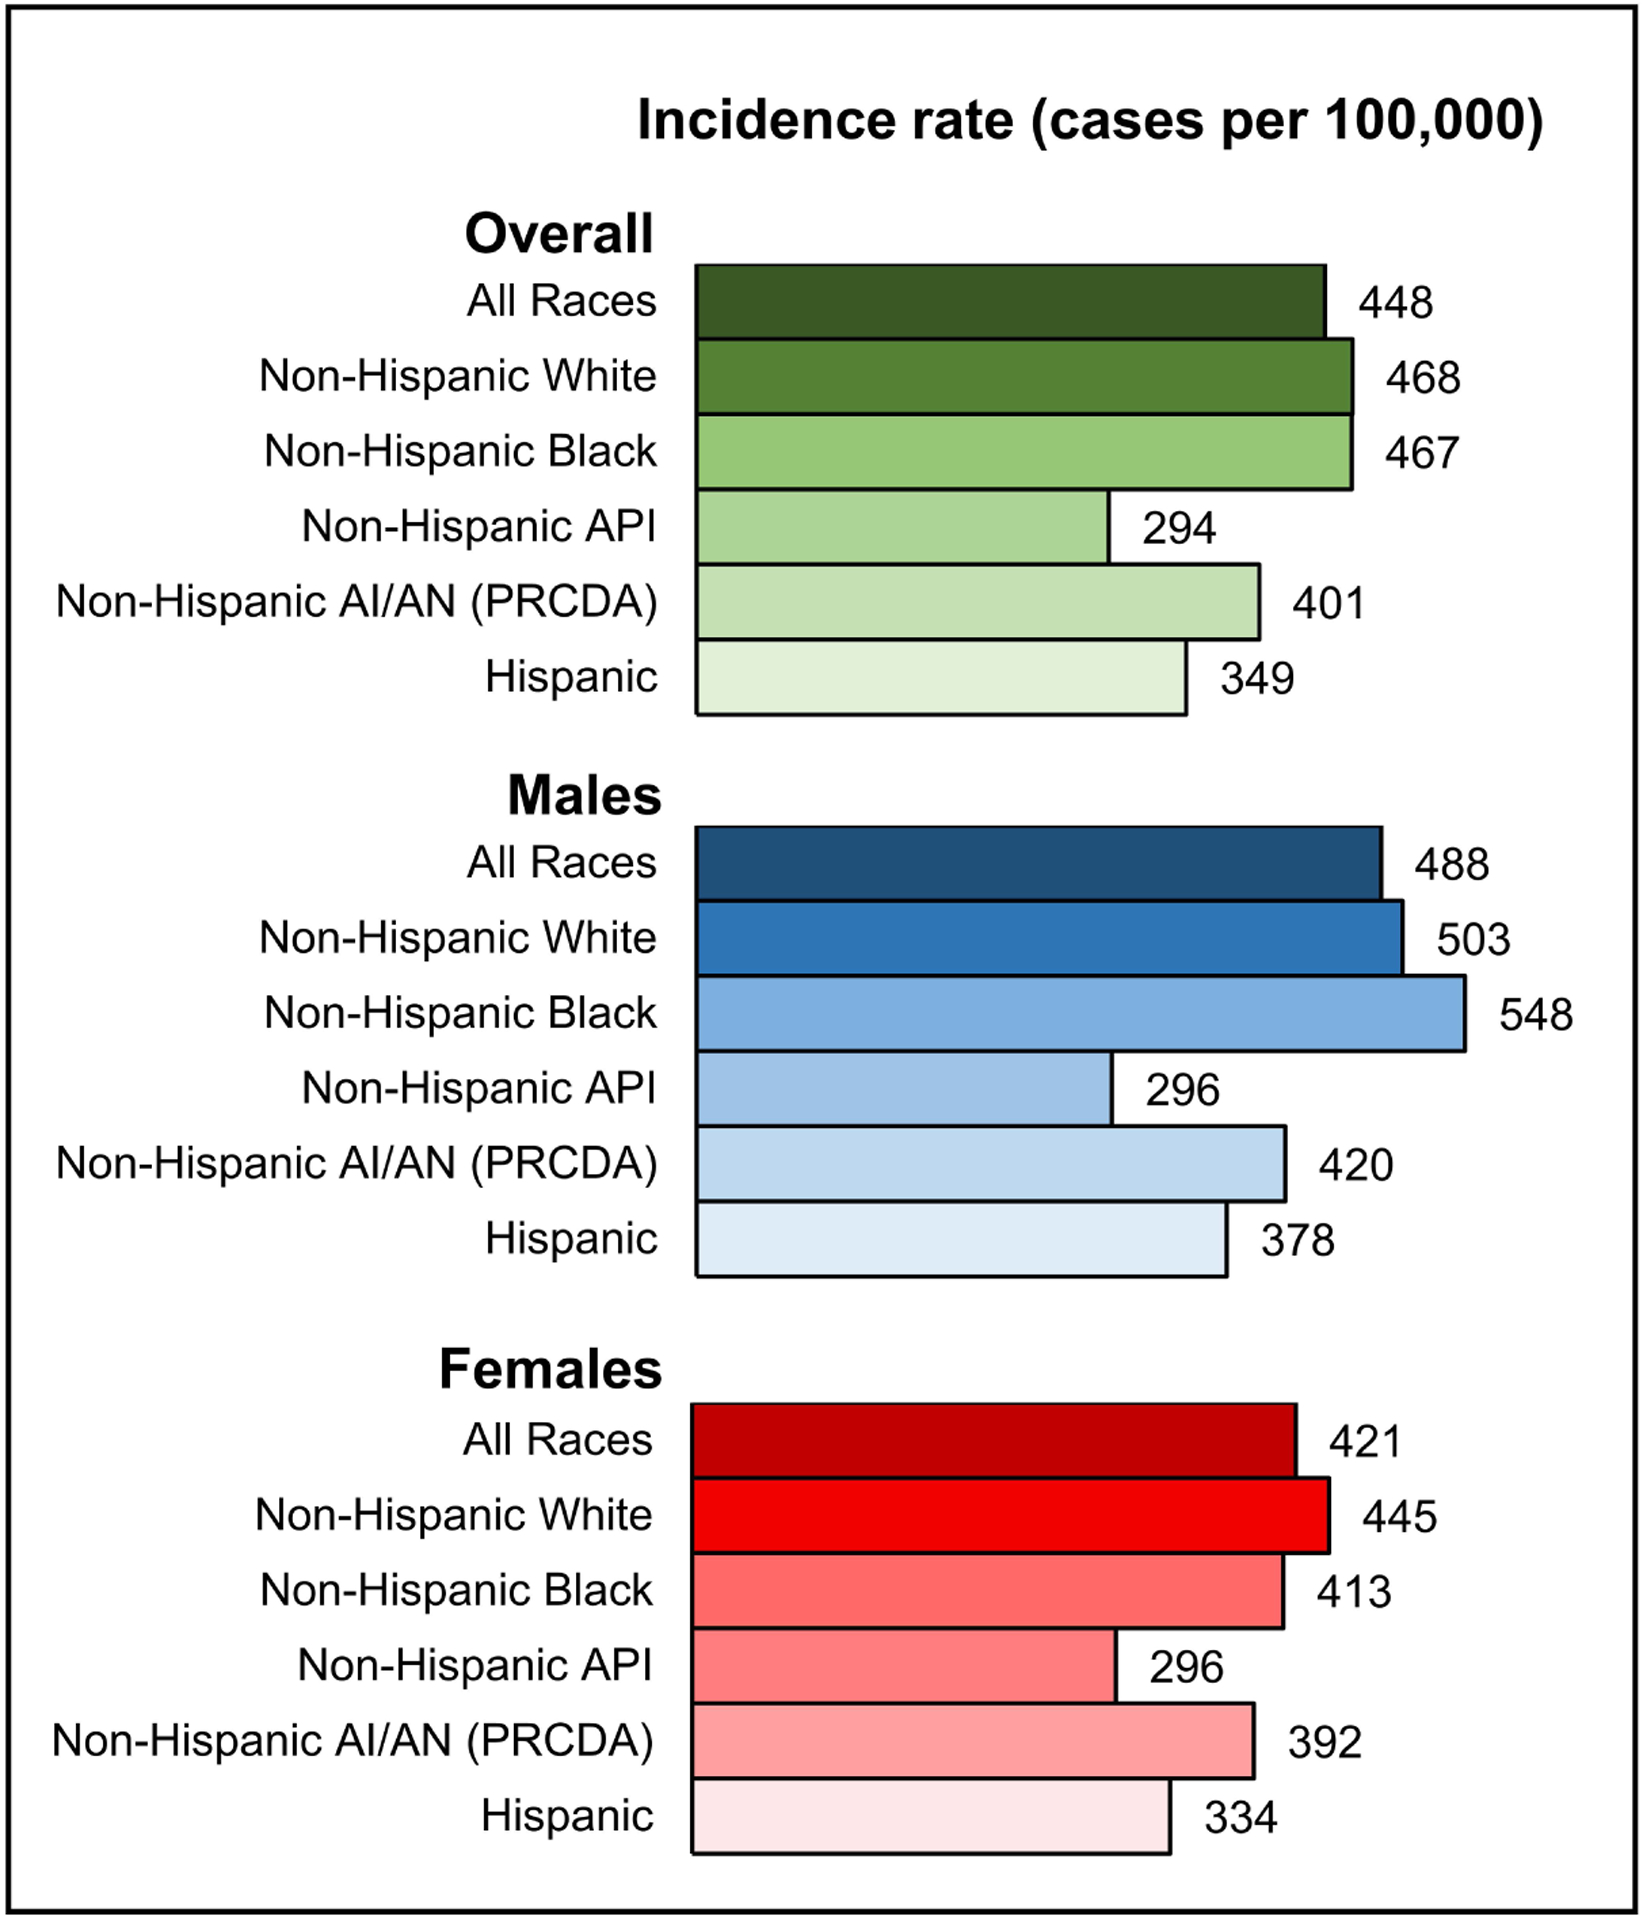
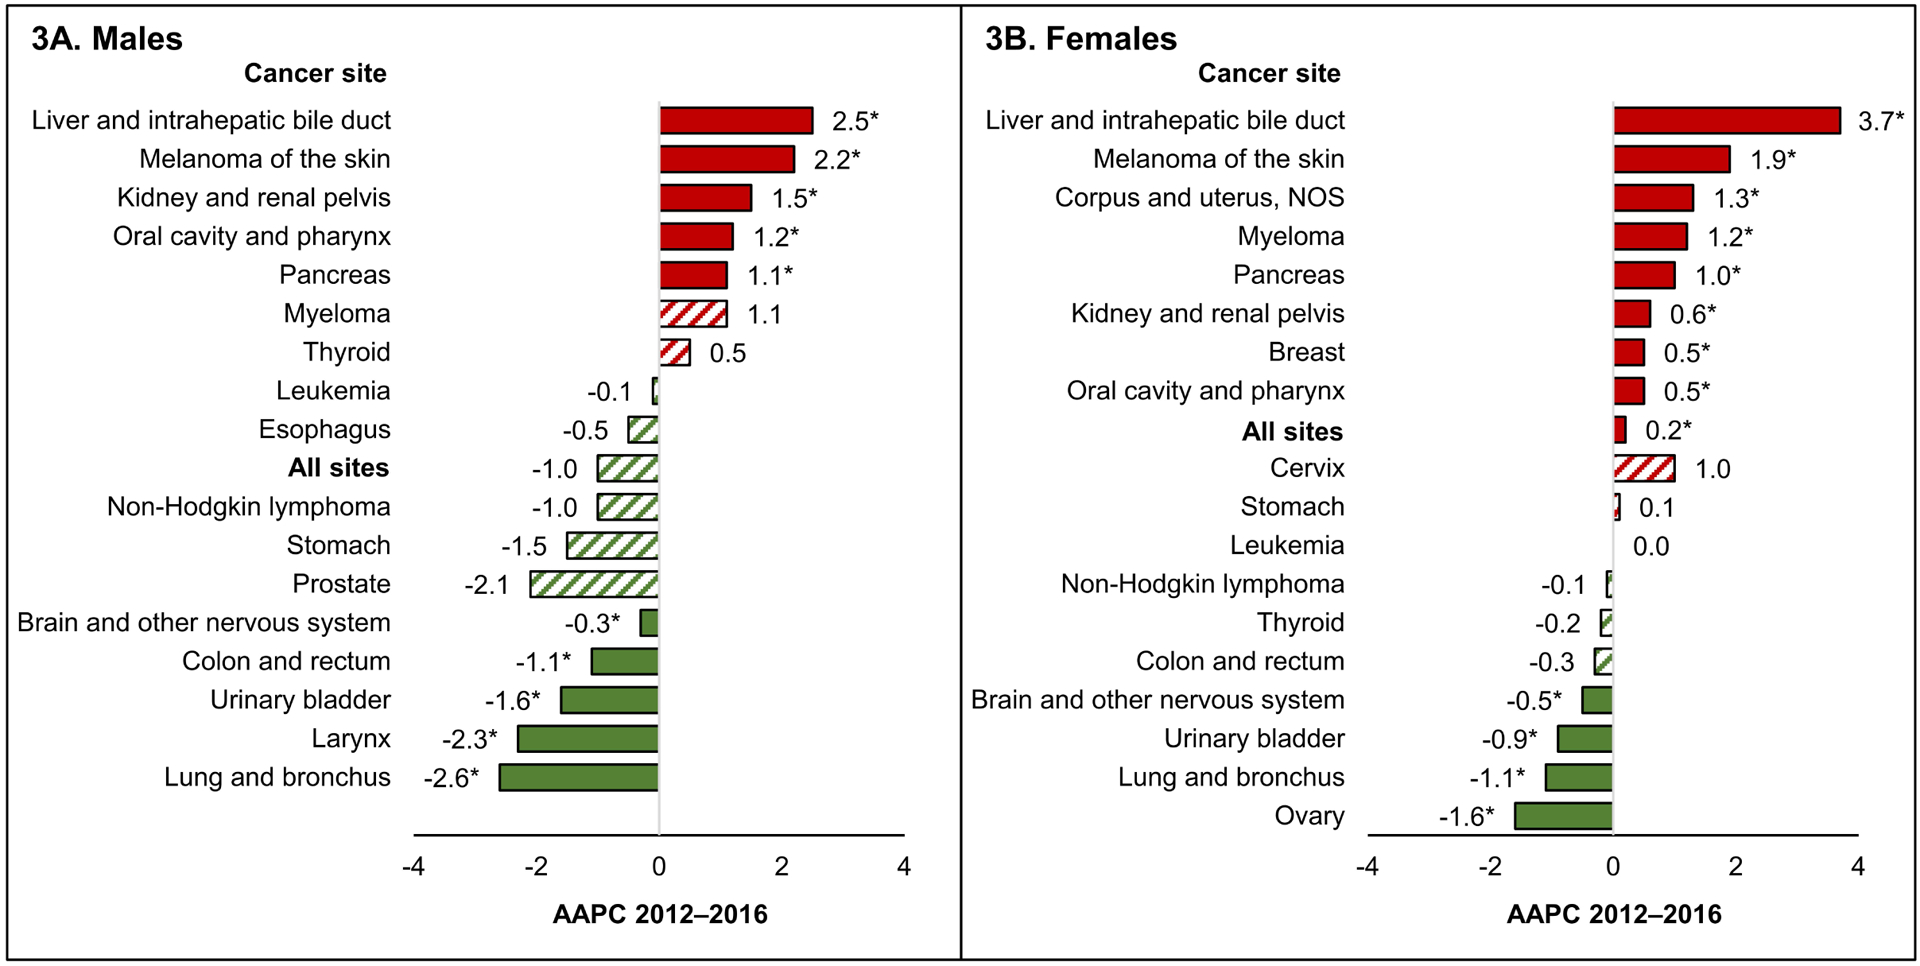
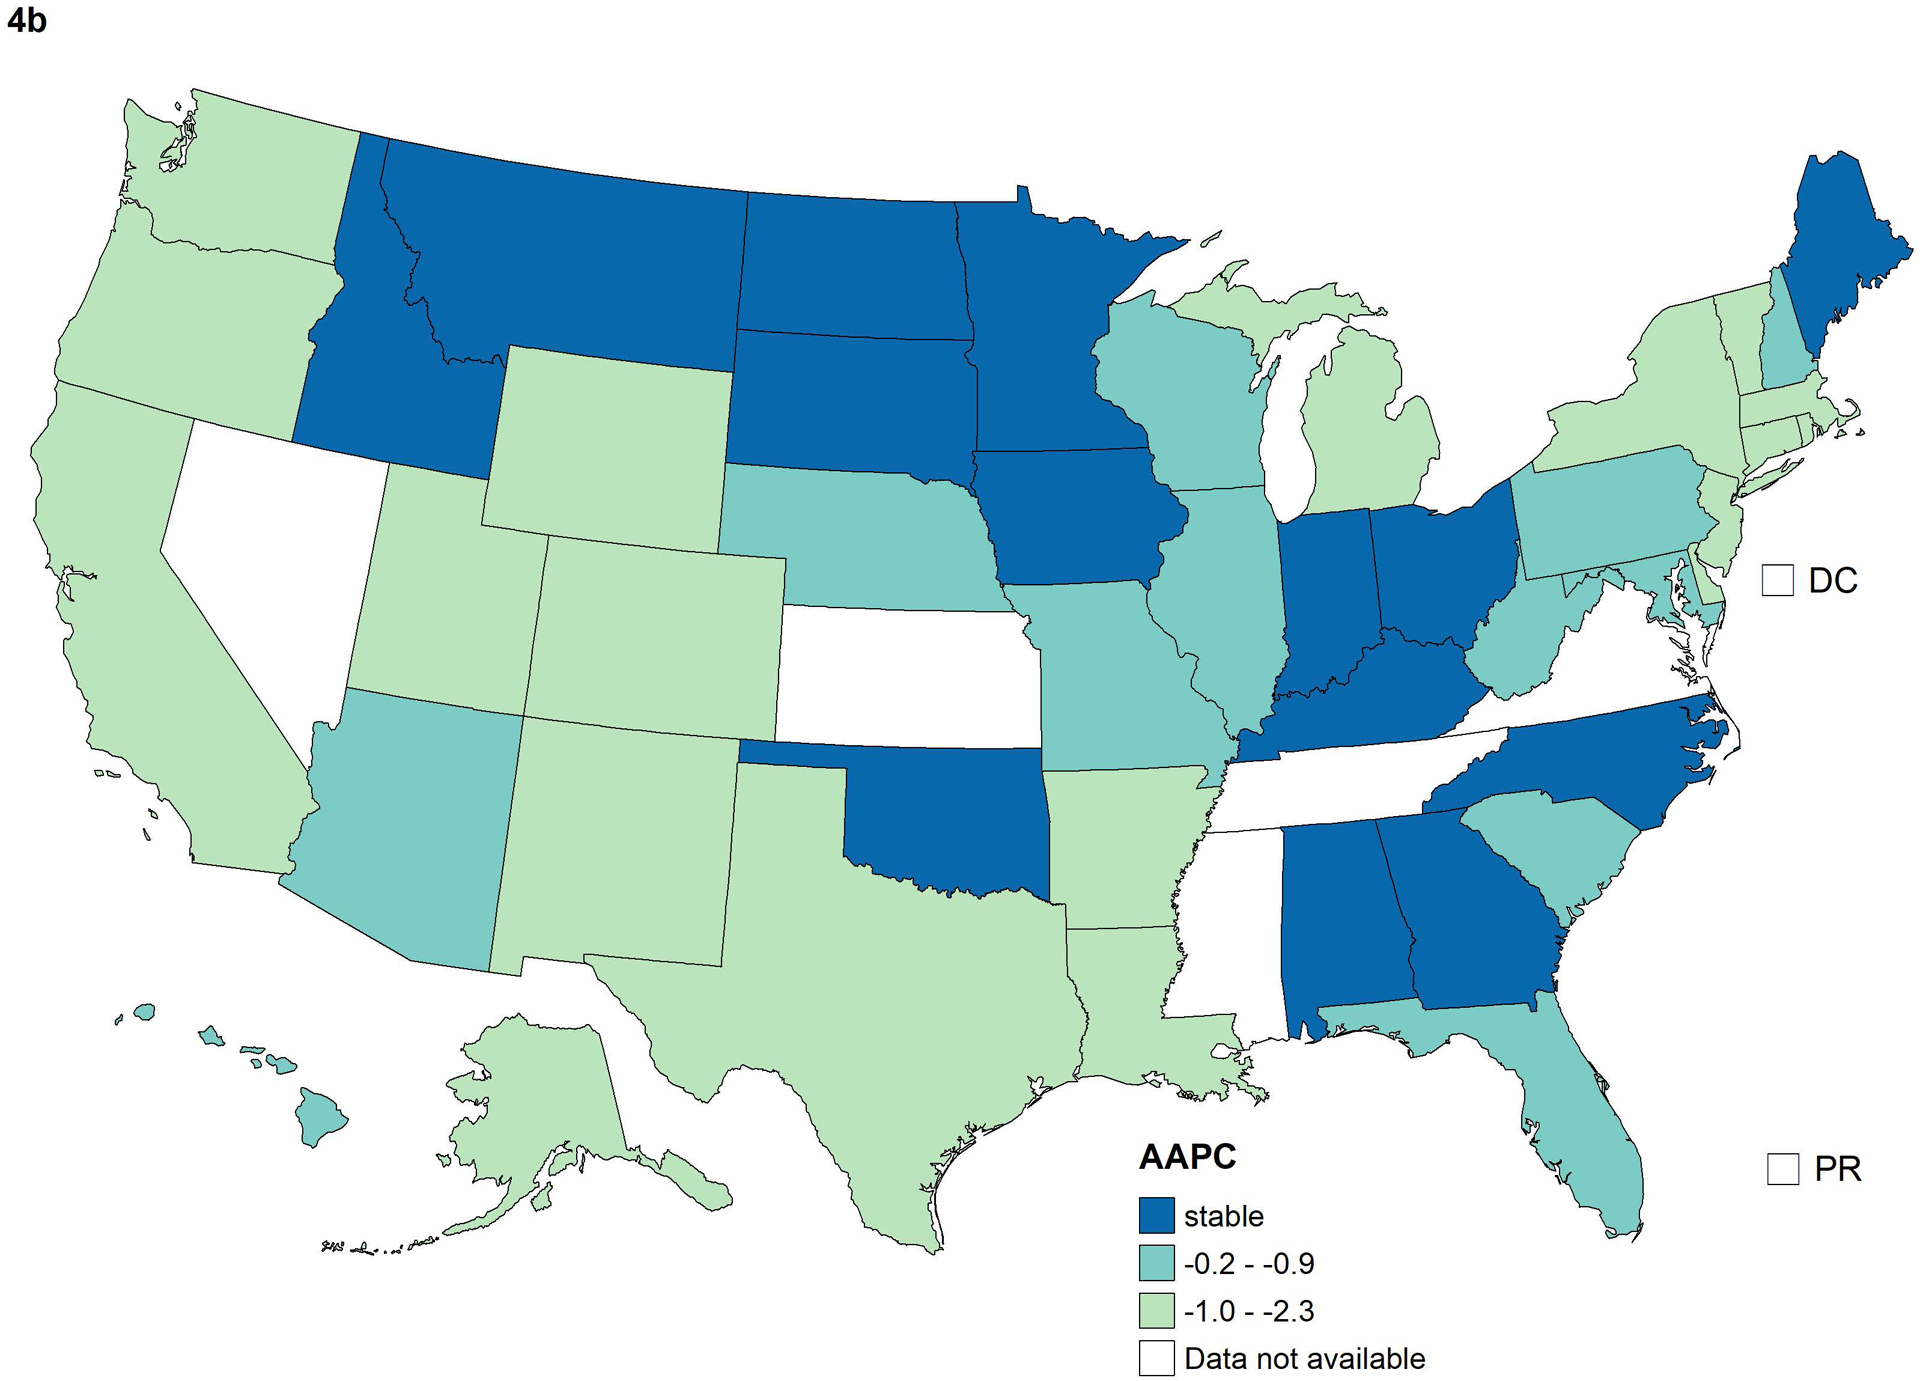
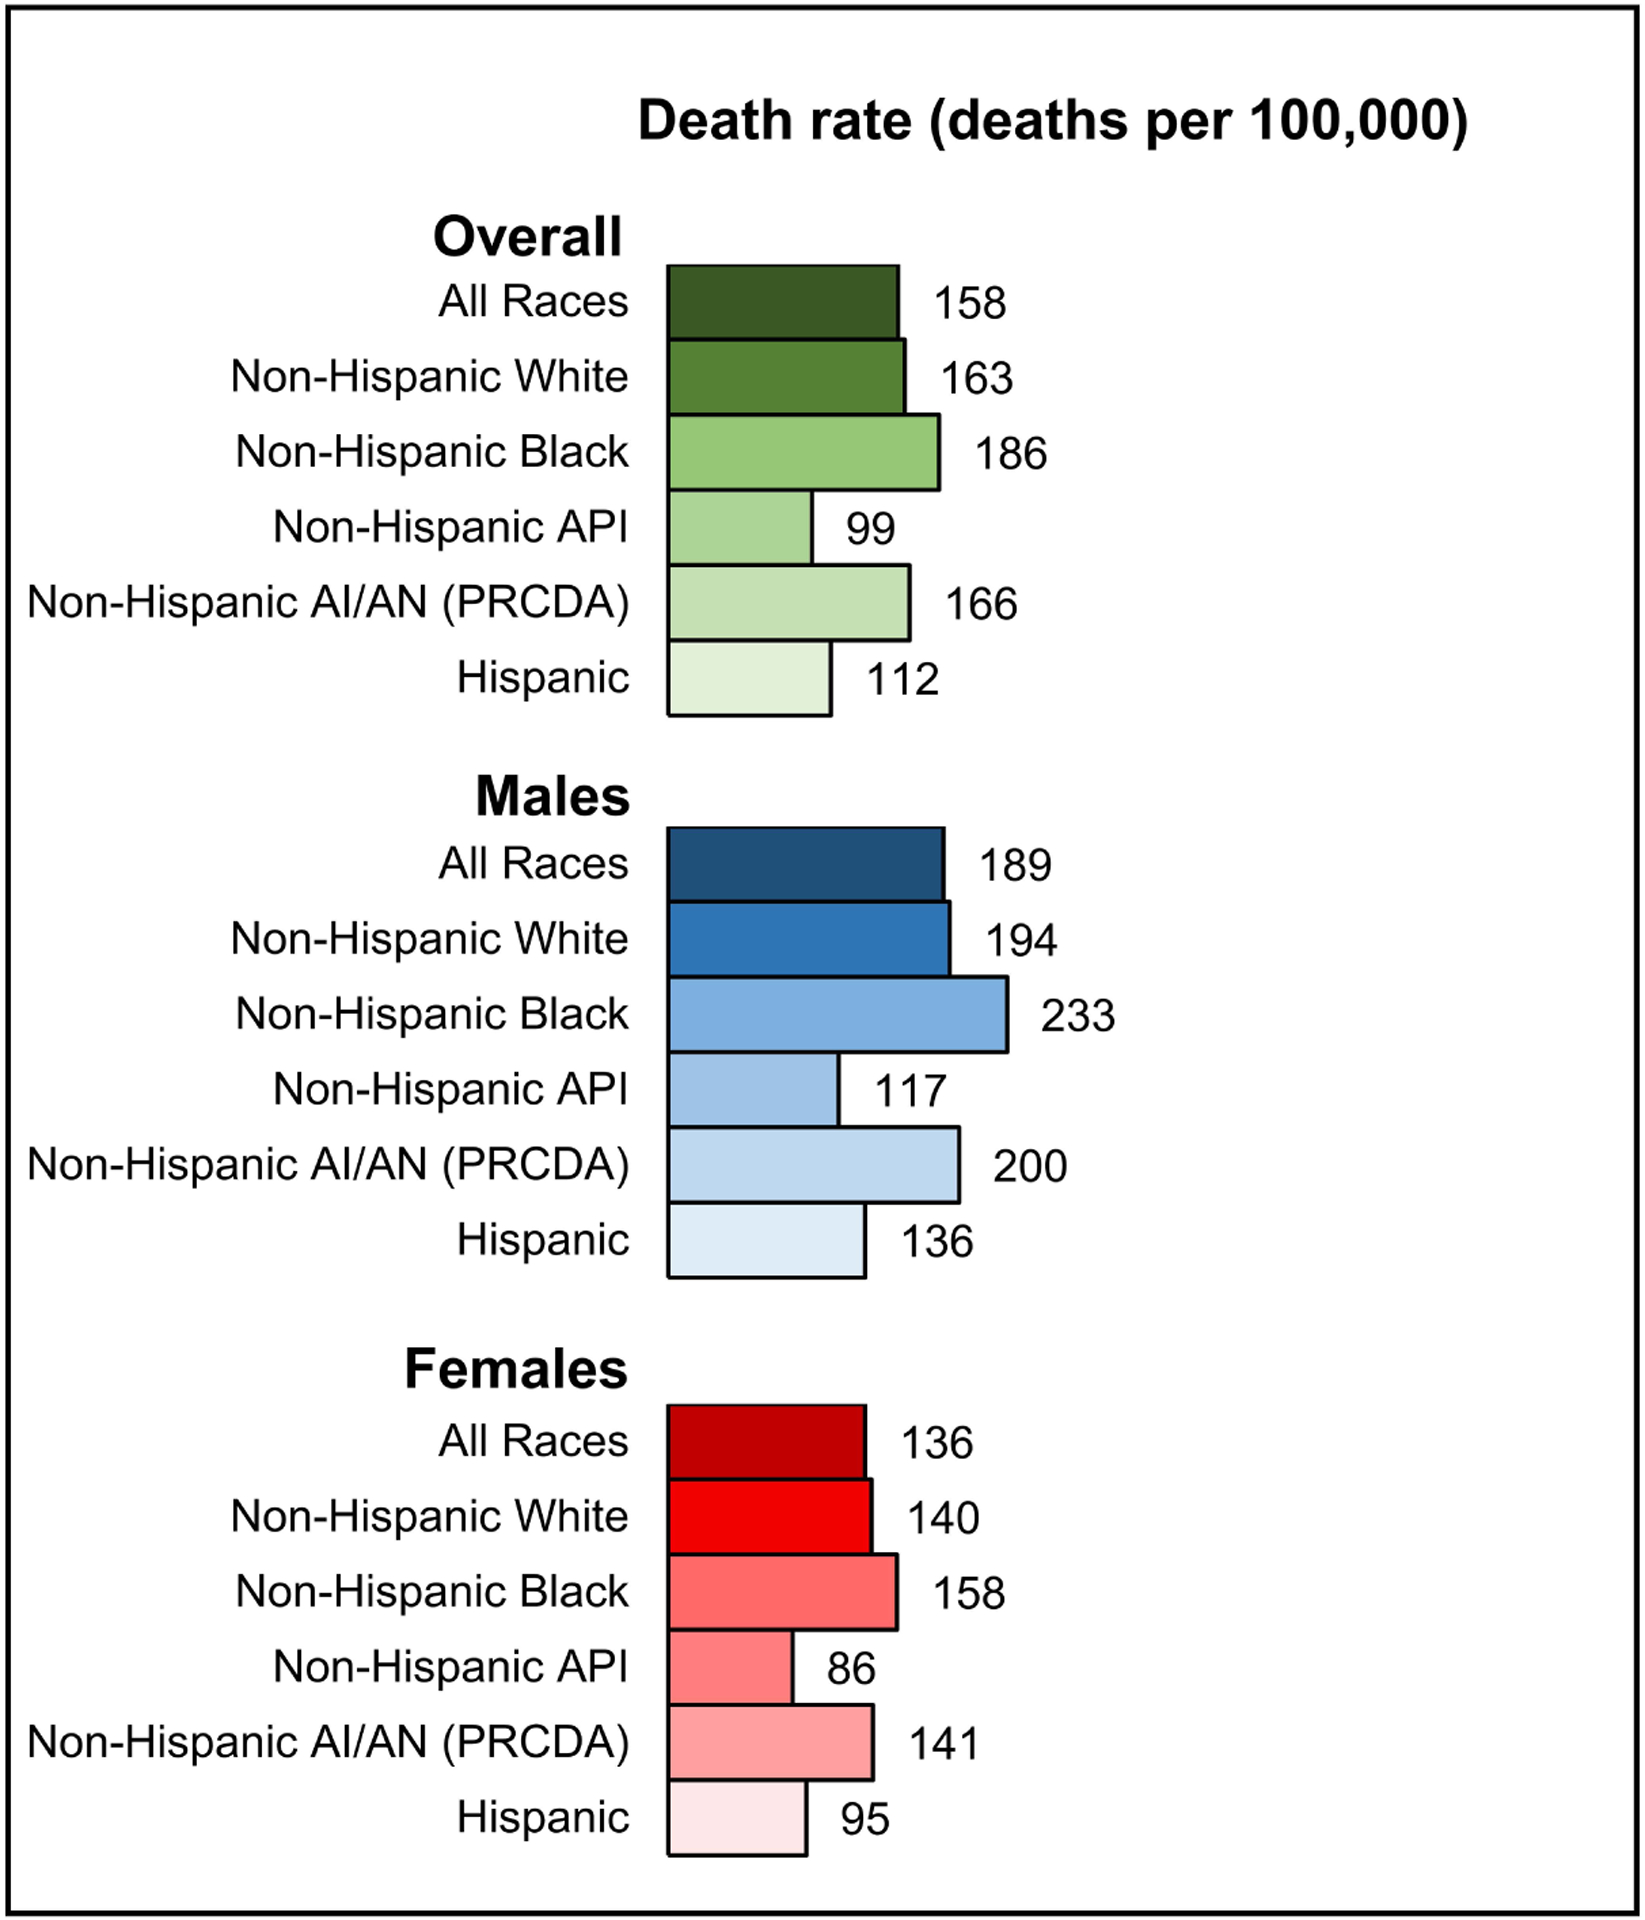
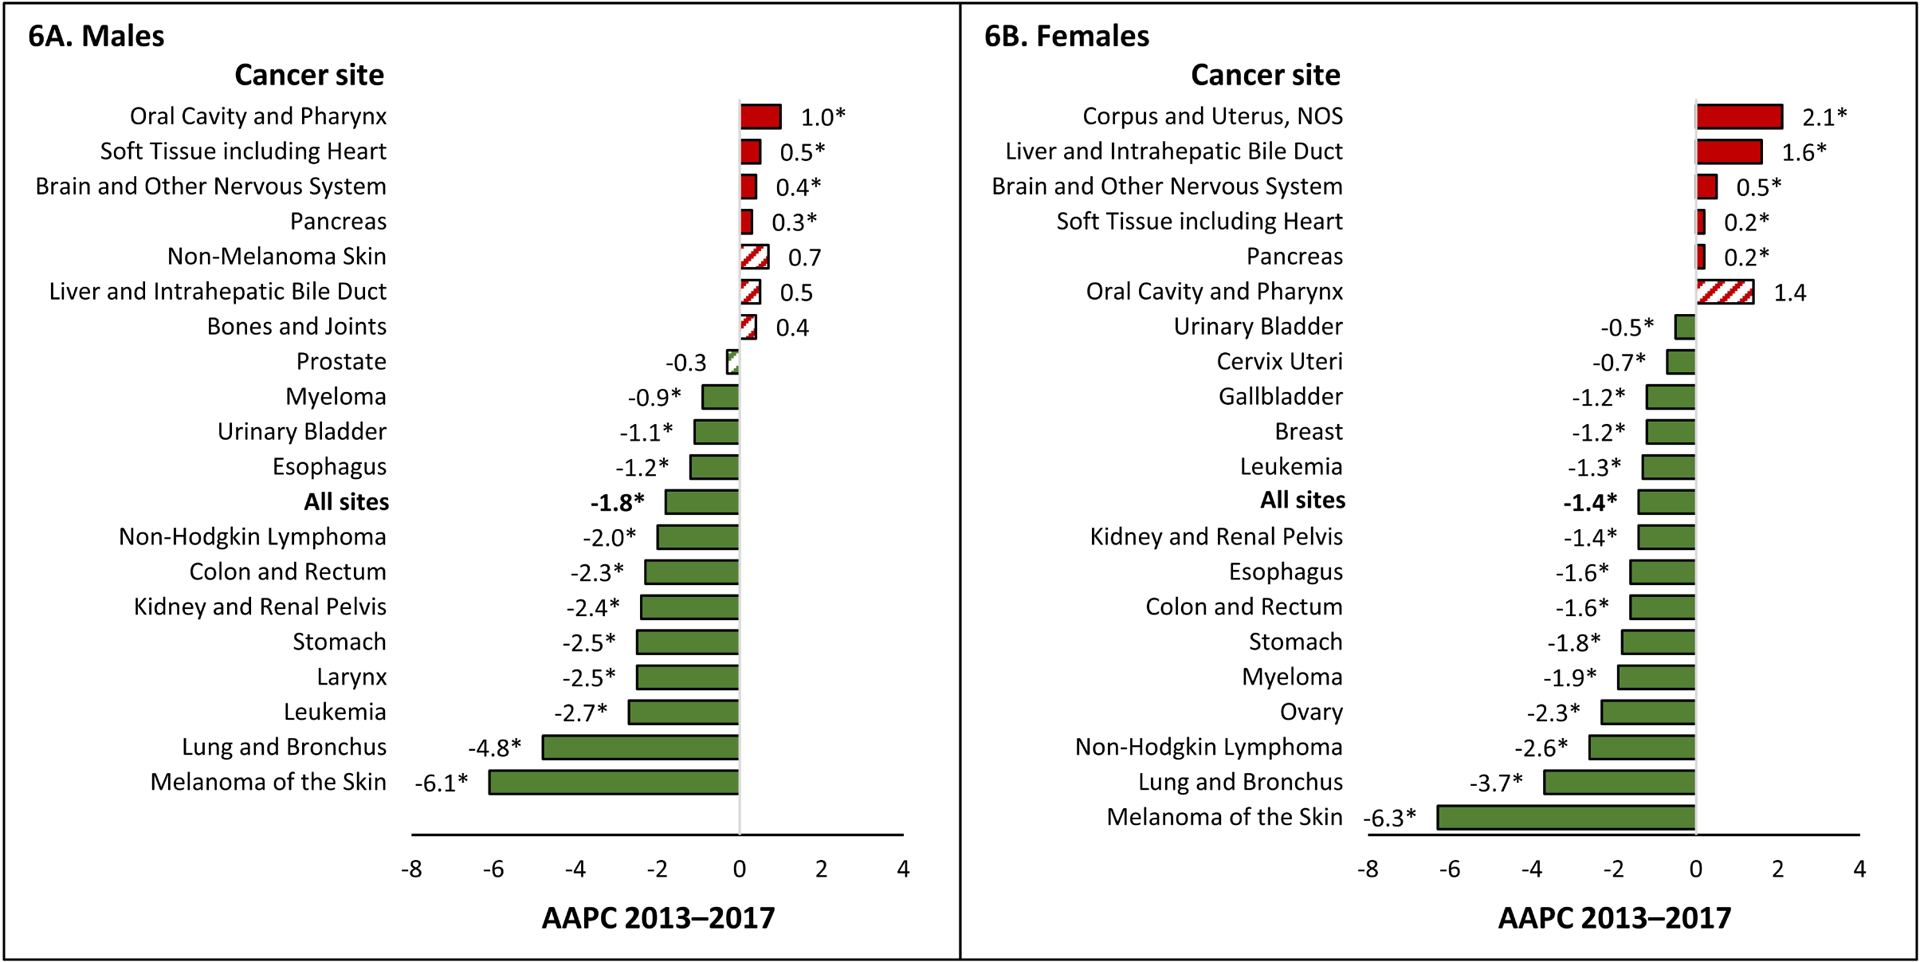
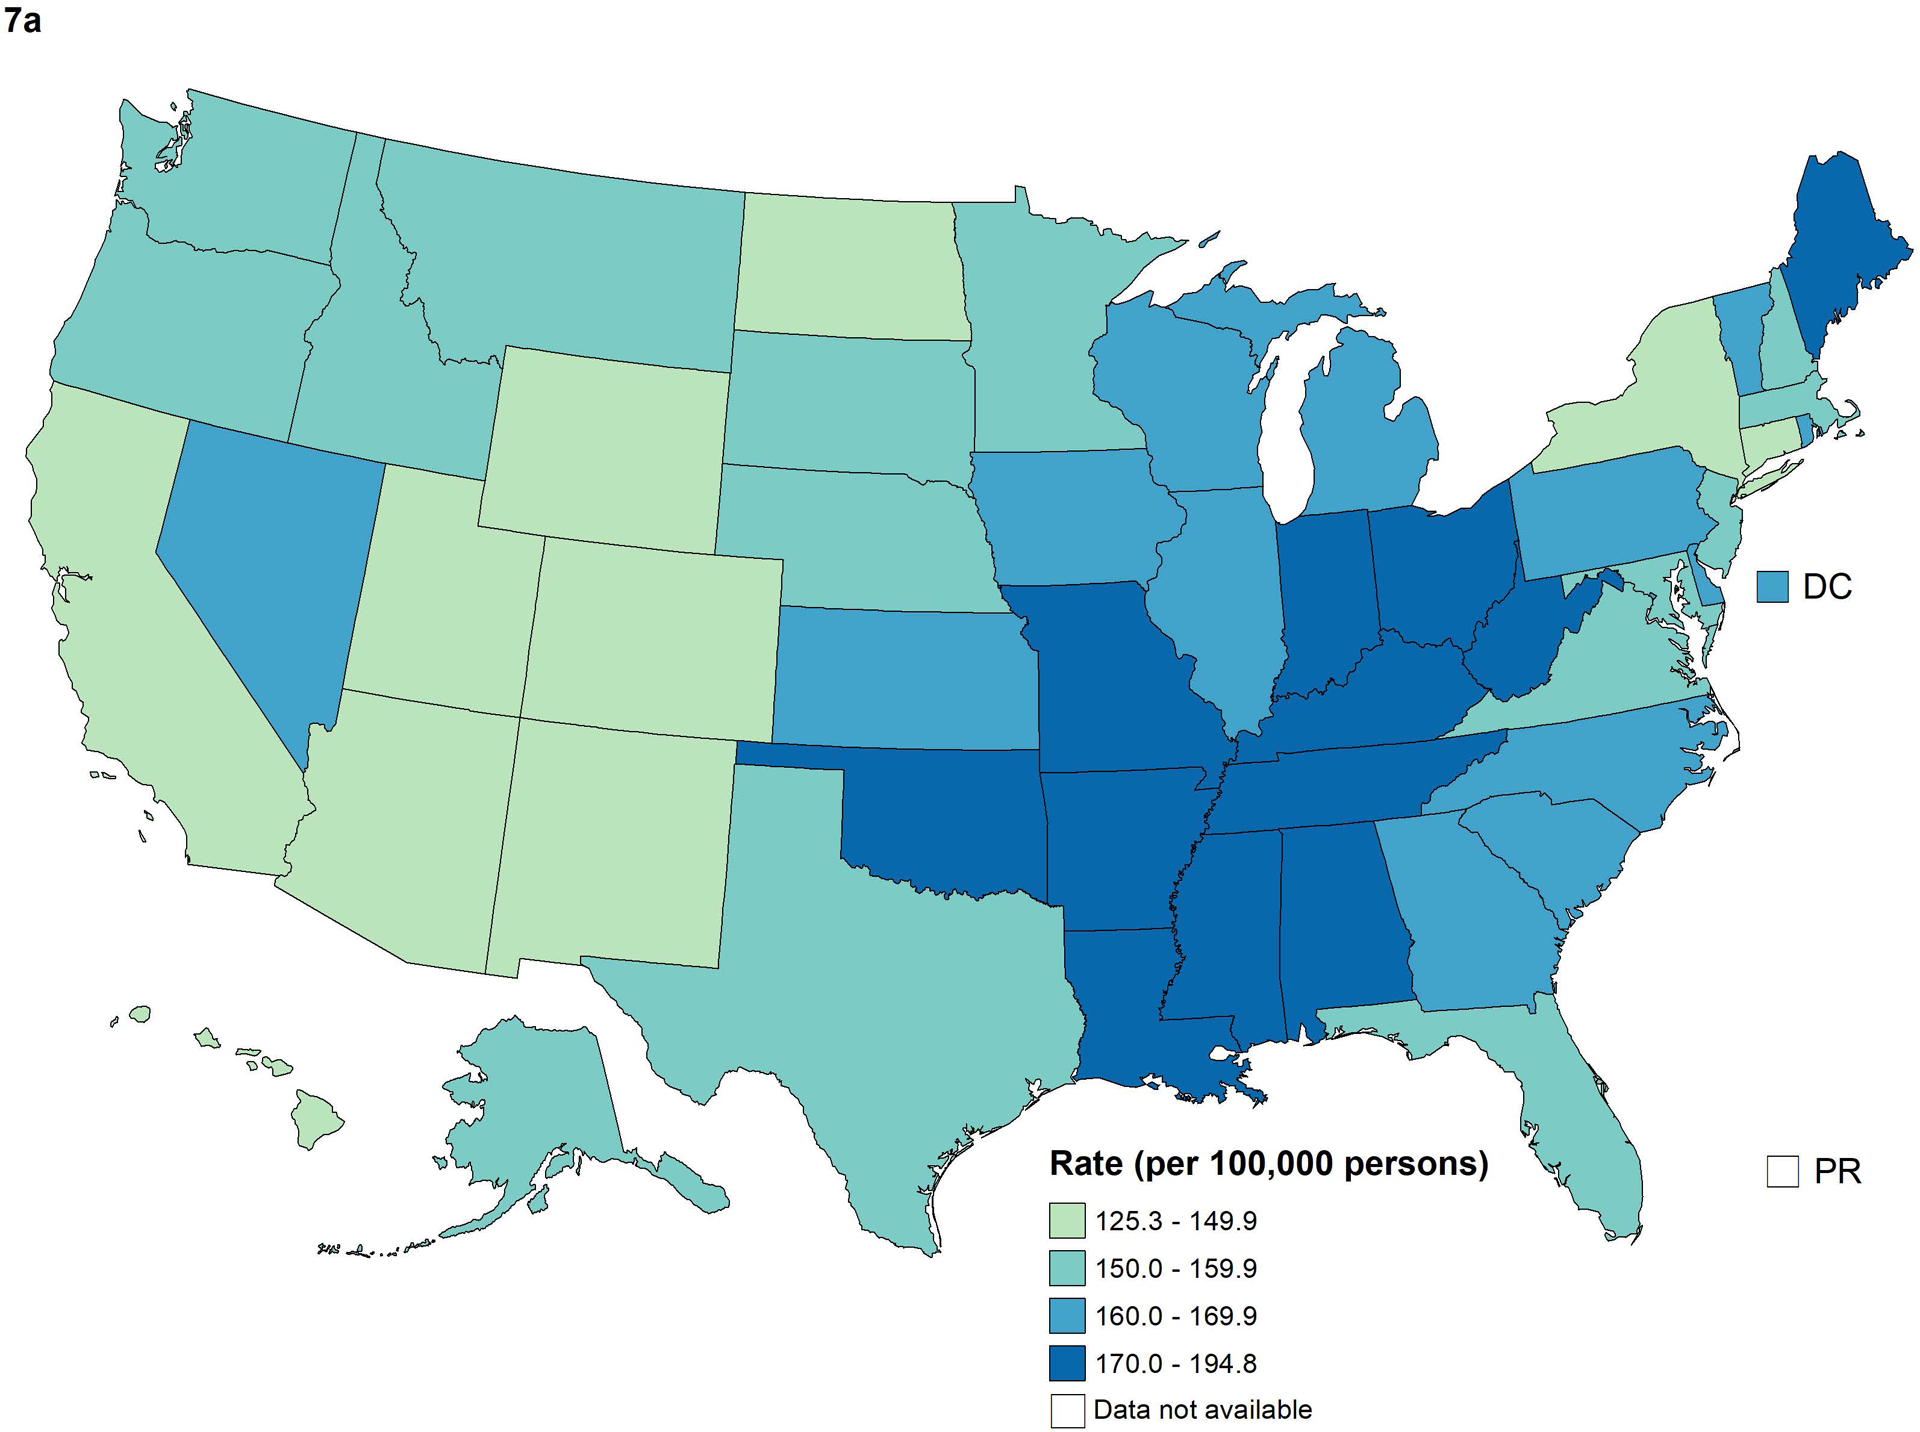
Results: Overall, cancer incidence rates decreased 0.6% on average per year during 2012 through 2016, but trends differed by sex, racial/ethnic group, and cancer type. Among males, cancer incidence rates were stable overall and among non-Hispanic white males but decreased in other racial/ethnic groups; rates increased for 5 of the 17 most common cancers, were stable for 7 cancers (including prostate), and decreased for 5 cancers (including lung and bronchus [lung] and colorectal). Among females, cancer incidence rates increased during 2012 to 2016 in all racial/ethnic groups, increasing on average 0.2% per year; rates increased for 8 of the 18 most common cancers (including breast), were stable for 6 cancers (including colorectal), and decreased for 4 cancers (including lung). Overall, cancer death rates decreased 1.5% on average per year during 2013 to 2017, decreasing 1.8% per year among males and 1.4% per year among females. During 2013 to 2017, cancer death rates decreased for all cancers combined among both males and females in each racial/ethnic group, for 11 of the 19 most common cancers among males (including lung and colorectal), and for 14 of the 20 most common cancers among females (including lung, colorectal, and breast). The largest declines in death rates were observed for melanoma of the skin (decreasing 6.1% per year among males and 6.3% among females) and lung (decreasing 4.8% per year among males and 3.7% among females). Among children younger than 15 years, cancer incidence rates increased an average of 0.8% per year during 2012 to 2016, and cancer death rates decreased an average of 1.4% per year during 2013 to 2017. Among adolescents and young adults aged 15 to 39 years, cancer incidence rates increased an average of 0.9% per year during 2012 to 2016, and cancer death rates decreased an average of 1.0% per year during 2013 to 2017.
Conclusions: Although overall cancer death rates continue to decline, incidence rates are leveling off among males and are increasing slightly among females. These trends reflect population changes in cancer risk factors, screening test use, diagnostic practices, and treatment advances. Many cancers can be prevented or treated effectively if they are found early. Population-based cancer incidence and mortality data can be used to inform efforts to decrease the cancer burden in the United States and regularly monitor progress toward goals.
Keywords: Annual Report to the Nation; Epidemiology; National Program of Cancer Registries (NPCR); National Vital Statistics System (NVSS); North American Association of Central Cancer Registries (NAACCR); Surveillance; and End Results (SEER) program; cancer; epidemiology; incidence; mortality; trends.
© 2020 American Cancer Society.
Conflict of interest statement
CONFLICT OF INTEREST DISCLOSURES
The authors have no conflicts of interest related to this work to disclose.
Figures
Similar articles
-
Annual Report to the Nation on the Status of Cancer, part I: National cancer statistics.Cancer. 2018 Jul 1;124(13):2785-2800. doi: 10.1002/cncr.31551. Epub 2018 May 22. Cancer. 2018. PMID: 29786848 Free PMC article.
-
Annual report to the nation on the status of cancer, part 1: National cancer statistics.Cancer. 2022 Dec 15;128(24):4251-4284. doi: 10.1002/cncr.34479. Epub 2022 Oct 27. Cancer. 2022. PMID: 36301149 Free PMC article.
-
Annual Report to the Nation on the Status of Cancer, Part 1: National Cancer Statistics.J Natl Cancer Inst. 2021 Nov 29;113(12):1648-1669. doi: 10.1093/jnci/djab131. J Natl Cancer Inst. 2021. PMID: 34240195 Free PMC article.
-
Annual report to the nation on the status of cancer, 1975-2000, featuring the uses of surveillance data for cancer prevention and control.J Natl Cancer Inst. 2003 Sep 3;95(17):1276-99. doi: 10.1093/jnci/djg040. J Natl Cancer Inst. 2003. PMID: 12953083 Review.
-
Cancers with increasing incidence trends in the United States: 1999 through 2008.CA Cancer J Clin. 2012 Mar-Apr;62(2):118-28. doi: 10.3322/caac.20141. Epub 2012 Jan 4. CA Cancer J Clin. 2012. PMID: 22281605 Review.
Cited by
-
Colonic Stenting in the Emergency Setting.Medicina (Kaunas). 2021 Apr 1;57(4):328. doi: 10.3390/medicina57040328. Medicina (Kaunas). 2021. PMID: 33915760 Free PMC article. Review.
-
Impact of the COVID-19 pandemic on colorectal cancer screening in New York City.J Med Screen. 2023 Jun;30(2):81-86. doi: 10.1177/09691413221128666. Epub 2022 Sep 26. J Med Screen. 2023. PMID: 36164282 Free PMC article.
-
Organoid modeling meets cancers of female reproductive tract.Cell Death Discov. 2024 Sep 27;10(1):410. doi: 10.1038/s41420-024-02186-x. Cell Death Discov. 2024. PMID: 39333482 Free PMC article. Review.
-
Establishment of a Prognostic Model for Hepatocellular Carcinoma Based on Bioinformatics and the Role of NR6A1 in the Progression of HCC.J Clin Transl Hepatol. 2022 Oct 28;10(5):901-912. doi: 10.14218/JCTH.2022.00191. Epub 2022 Aug 8. J Clin Transl Hepatol. 2022. PMID: 36304495 Free PMC article.
-
Incidence of renal cell carcinoma after solid organ transplantation: a systematic review and meta-analysis.BMC Urol. 2024 Jan 6;24(1):11. doi: 10.1186/s12894-023-01389-1. BMC Urol. 2024. PMID: 38184525 Free PMC article.
References
-
- Sherman RFR, De P, Green D, Hofferkamp J, Johnson C, Kohler B, Charlton M, Hofer B, Hsieh M, Nash S, B Q, eds. Cancer in North America: 2012–2016. Volume one: Combined cancer incidence for the United States, Canada and North America. Springfield, IL: North American Association of Central Cancer Registries, Inc.; 2019.
-
- Fritz A, Percy C, Jack A, et al., eds. International classification of diseases for oncology. 3rd ed. Geneva, Switzerland: World Health Organization; 2000.
Publication types
MeSH terms
Grants and funding
LinkOut - more resources
Full Text Sources
Other Literature Sources
