A Systematic Investigation on Complement Pathway Activation in Diabetic Retinopathy
- PMID: 32117292
- PMCID: PMC7026189
- DOI: 10.3389/fimmu.2020.00154
A Systematic Investigation on Complement Pathway Activation in Diabetic Retinopathy
Abstract
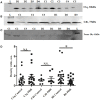
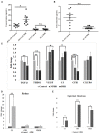
The complement system plays a crucial role in retinal homeostasis. While the proteomic analysis of ocular tissues in diabetic retinopathy (DR) has shown the deposition of complement proteins, their exact role in the pathogenesis of DR is yet unclear. We performed a detailed investigation of the role of the complement system by evaluating the levels of major complement proteins including C3, C1q, C4b, Complement Factor B (CFB), and Complement Factor H (CFH) and their activated fragments from both the classical and alternative pathways in vitreous humor and serum samples from proliferative DR (PDR) patients and controls. Further, the expressions of complements and several other key pro- and anti-angiogenic genes in the serum and vitreous humor were analyzed in the blood samples of PDR and non-PDR (NPDR) patients along with controls without diabetes. We also assessed the pro-inflammatory cytokines and matrix metalloproteinases in the vitreous humor samples. There was a significant increase in C3 and its activated fragment C3bα' (110 kDa) along with a corresponding upregulation of CFH in the vitreous of PDR patients, which confirmed the increased activation of the alternative complement pathway in PDR. Likewise, a significant upregulation of angiogenic genes and downregulation of anti-angiogenic genes was seen in PDR and NPDR cases. Increased MMP9 activity and upregulation of inflammatory markers IL8 and sPECAM with a downregulation of anti-inflammatory marker IL-10 in PDR vitreous indicated the possible involvement of microglia in DR pathogenesis. Further, a significantly high C3 deposition in the capillary wall along with thickening of basement membranes and co-localization of CFH expression with CD11b+ve activated microglial cells in diabetic retina suggested microglia as a source of CFH in diabetic retina. The increased CFH levels could be a feedback mechanism for arresting excessive complement activation in DR eyes. A gradual increase of CFH and CD11b expression in retina with early to late changes in epiretinal membranes of DR patients indicated a major role for the alternative complement pathway in disease progression.
Keywords: angiogenesis; complement pathway; diabetic retinopathy; inflammation; microglia; retina; vitreous humor.
Copyright © 2020 Shahulhameed, Vishwakarma, Chhablani, Tyagi, Pappuru, Jakati, Chakrabarti and Kaur.
Figures


Similar articles
-
Elevated Activating Transcription Factor 4 and Glucose-Regulated 78 Kda Protein Levels Correlate with Inflammatory Cytokines in the Aqueous Humor and Vitreous of Proliferative Diabetic Retinopathy.Curr Eye Res. 2017 Aug;42(8):1202-1208. doi: 10.1080/02713683.2017.1297998. Epub 2017 May 12. Curr Eye Res. 2017. PMID: 28497987
-
The Profile of Angiogenic Factors in Vitreous Humor of the Patients with Proliferative Diabetic Retinopathy.Curr Mol Med. 2017 Dec 7;17(4):280-286. doi: 10.2174/1566524017666171106111440. Curr Mol Med. 2017. PMID: 29110608
-
Intraocular tumour necrosis factor ligand related molecule 1 A links disease progression of proliferative diabetic retinopathy after primary vitrectomy.Clin Exp Pharmacol Physiol. 2020 Jun;47(6):966-976. doi: 10.1111/1440-1681.13284. Epub 2020 Mar 3. Clin Exp Pharmacol Physiol. 2020. PMID: 32064668
-
Human vitreous in proliferative diabetic retinopathy: Characterization and translational implications.Prog Retin Eye Res. 2019 Sep;72:100756. doi: 10.1016/j.preteyeres.2019.03.002. Epub 2019 Apr 2. Prog Retin Eye Res. 2019. PMID: 30951889 Review.
-
Angiogenesis-Inflammation Cross Talk in Diabetic Retinopathy: Novel Insights From the Chick Embryo Chorioallantoic Membrane/Human Vitreous Platform.Front Immunol. 2020 Sep 29;11:581288. doi: 10.3389/fimmu.2020.581288. eCollection 2020. Front Immunol. 2020. PMID: 33117388 Free PMC article. Review.
Cited by
-
Modulation of diabetes-related retinal pathophysiology by PTX3.Proc Natl Acad Sci U S A. 2024 Oct 8;121(41):e2320034121. doi: 10.1073/pnas.2320034121. Epub 2024 Sep 30. Proc Natl Acad Sci U S A. 2024. PMID: 39348530 Free PMC article.
-
miR-27a-3p promotes inflammatory response in infectious endophthalmitis via targeting TSC1.Sci Rep. 2024 Aug 21;14(1):19353. doi: 10.1038/s41598-024-69964-6. Sci Rep. 2024. PMID: 39169069 Free PMC article.
-
Corneal application of SOCS1/3 peptides for the treatment of eye diseases mediated by inflammation and oxidative stress.Front Immunol. 2024 Jul 22;15:1416181. doi: 10.3389/fimmu.2024.1416181. eCollection 2024. Front Immunol. 2024. PMID: 39104531 Free PMC article. Review.
-
Exploring the Associated Genetic Causes of Diabetic Retinopathy as a Model of Inflammation in Retinal Diseases.Int J Mol Sci. 2024 May 17;25(10):5456. doi: 10.3390/ijms25105456. Int J Mol Sci. 2024. PMID: 38791494 Free PMC article.
-
Exploration of potential novel drug targets for diabetic retinopathy by plasma proteome screening.Sci Rep. 2024 May 22;14(1):11726. doi: 10.1038/s41598-024-62069-0. Sci Rep. 2024. PMID: 38778174 Free PMC article.
References
Publication types
MeSH terms
Substances
LinkOut - more resources
Full Text Sources
Medical
Research Materials
Miscellaneous

