. 2020 Jan;22(1):49-59.
doi: 10.1038/s41556-019-0437-8. Epub 2020 Jan 6.

Erythromyeloid progenitors give rise to a population of osteoclasts that contribute to bone homeostasis and repair

Affiliations

Erythromyeloid progenitors give rise to a population of osteoclasts that contribute to bone homeostasis and repair

Yasuhito Yahara et al. Nat Cell Biol. 2020 Jan.

Abstract

Osteoclasts are multinucleated cells of the monocyte/macrophage lineage that degrade bone. Here, we used lineage tracing studies-labelling cells expressing Cx3cr1, Csf1r or Flt3-to identify the precursors of osteoclasts in mice. We identified an erythromyeloid progenitor (EMP)-derived osteoclast precursor population. Yolk-sac macrophages of EMP origin produced neonatal osteoclasts that can create a space for postnatal bone marrow haematopoiesis. Furthermore, EMPs gave rise to long-lasting osteoclast precursors that contributed to postnatal bone remodelling in both physiological and pathological settings. Our single-cell RNA-sequencing data showed that EMP-derived osteoclast precursors arose independently of the haematopoietic stem cell (HSC) lineage and the data from fate tracking of EMP and HSC lineages indicated the possibility of cell-cell fusion between these two lineages. Cx3cr1+ yolk-sac macrophage descendants resided in the adult spleen, and parabiosis experiments showed that these cells migrated through the bloodstream to the remodelled bone after injury.


Conflict of interest statement

Competing financial interests

The authors declare no competing financial interests.

Figures

Extended Data Fig. 1
Non-leakiness of Csf1r-Mer-iCre-Mer mice. (a) Representative image of the postnatal day (P) 0 femur of Csf1r-Mer-iCre-Mer; R26tdTomato mice without 4 hydroxytamoxifen (4OHT) induction (n=3 mice). Scale bars, upper panel; 500 μm. Lower panels; 100 μm.
Extended Data Fig. 2
Cx3cr1+ yolk-sac macrophage descendant in several skeletal elements. (a) Representative image of the postnatal day (P) 3 femur of Cx3cr1CreER; R26tdTomato mice without 4 hydroxytamoxifen (4OHT) induction (n=3 mice). Scale bar, 100 μm. (b) Representative images of tdTomato+ cells in neonatal brain and calvaria of Cx3cr1CreER; R26tdTomato mice treated with 4OHT at E9.5 (n=3 mice). Scale bars, 50 μm. (c) Representative image of tdTomato and F4/80 expression in the scapula of 2-month-old (mo) Cx3cr1CreER; R26tdTomato mice labeled at E9.5 (n=3 mice). Scale bar, 50 μm. (d) Representative image of tdTomato and F4/80 expression in the vertebral body of 2 mo Cx3cr1CreER; R26tdTomato mice labeled at E9.5 (n=3 mice). Scale bars, 50 μm.
Extended Data Fig. 3
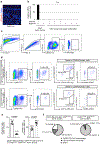
Characterization of HSC- and EMP- derived cells. (a) Representative image of the femur of embryonic day (E) 17.5 R26tdTomato mice (Cre-negative littermate control of Flt3-Cre; R26tdTomato mice, n = 3 mice). Scale bar, 100 μm. (b) Relative mRNA expression levels of Cre were analyzed by quantitative PCR. RNA was isolated from adult bone marrow cells (BMCs) and E8.5 whole body. Flt3-Cre; R26tdTomato mice and their littermate Cre-negative control were used. (c) Gating strategy of CD45+tdTomato+ BMCs. (d) Flow cytometry analysis of tdTomato+ cells from whole-body cell suspension of E14.5 Csf1r-Mer-iCre-Mer; R26tdTomato mice labeled at E8.5 (n = 6 embryos) and Cx3cr1CreER; R26tdTomato mice labeled at E9.5 (n = 5 embryos). 4OHT, 4-hydroxytamoxifen. (e) Quantitative visualization of percentage of tdTomato+ and RANK+ cells from whole-body cell suspension of E14.5 Csf1r-Mer-iCre-Mer; R26tdTomato mice labeled at E8.5 (n = 6 embryos) and Cx3cr1CreER; R26tdTomato mice labeled at E9.5 (n = 5 embryos). Unpaired two-tailed t-test. Error bars denote means ± s.d. (f) Percentage of F4/80highCD11bint macrophage and CD11bhighF4/80int monocyte isolated from E14.5 whole body lysate of Csf1r-Mer-iCre-Mer; R26tdTomato mice labeled at E8.5 (n = 6 embryos) and Cx3cr1CreER; R26tdTomato mice labeled at E9.5 (n = 5 embryos). Statistics source data are provided in Source Data Extended Data Fig. 3.
Extended Data Fig. 4
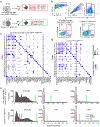
Single cell RNA-sequencing analysis of E14.5 embryo. (a) Schematic representation of sample preparation for the single cell RNA-sequencing. 4OHT, 4-hydroxytamoxifen. (b) Cell sorting strategy for the single cell RNA-sequencing. tdTomato+EGFP-, tdTomato+EGFP+, and tdTomato-EGFP+ (red box) were isolated from whole-body cell suspension of Csf1r-Mer-iCre-Mer; Csf1r-EGFP; R26tdTomato mice labeled at E8.5. tdTomato+CX3CR1-, tdTomato+CX3CR1+, and tdTomato-CX3CR1+ cell populations (green box) were also isolated from E14.5 Cx3cr1CreER; R26tdTomato mice labeled at E9.5. Two biological replicates of each genotype. (c) Dot plot showing expression of the selected marker gene in each cluster of Csf1r-Mer-iCre-Mer; Csf1r-EGFP; R26tdTomato mice. The size of the dot encodes the percentage expression, and its color encodes the average expression level. (d) Dot plot showing expression of the selected marker gene in each cluster of Cx3cr1CreER; R26tdTomato mice. (e) Scaled expression level and frequency (the number of cells) of tdTomato, Myb, and Flt3 were visualized. tdTomato+ cells from Csf1r-Mer-iCre-Mer; Csf1r-EGFP; R26tdTomato (n=10,336 cells) and Cx3cr1CreER; R26tdTomato (n=6,706 cells) mice were evaluated.
Extended Data Fig. 5
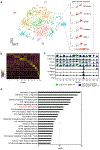
Single cell RNA sequencing identified EMP-derived osteoclast and their precursor populations. (a) t-SNE plot of tdTomato+Tnfrsf11a+Ptprc+ cells (n=3,368 cells) from Csf1r-Mer-iCre-Mer; Csf1r-EGFP; R26tdTomato and Cx3cr1CreER; R26tdTomato mice identifying 13 clusters. The right gray rectangle representing the normalized expression of indicated marker genes visualized onto t-SNE plots. Cells in cluster 9 expressed osteoclast-specific marker genes. EMP, erythromyeloid progenitor. (b) Heatmap representing the top 10 significantly differentially expressed genes in each cluster. (c) Violin plots showing mRNA expression levels of selected marker genes. Green color showing the expression levels of the cells from Cx3cr1CreER; R26tdTomato mice. Blue color showing the expression levels of the cells from Csf1r-Mer-iCre-Mer; Csf1r-EGFP; R26tdTomato mice. The number shows cluster identity, and the number of cells in each cluster is provided in Statistical source data Extended Data Fig 5. (d) Selected pathways significantly enriched in the cells belonging cluster 6 (n=274 cells). Hypergeometric probability mass function was used. Statistics source data are provided in Source Data Extended Data Fig. 5.
Extended Data Fig. 6
The healing process of the bone injury. (a) Representative images of the bone injury site during the healing process. 2-month-old C57BL/6J mice received drill hole injury and were analyzed (n=3 mice per group). Hematoxylin and Eosin staining showing inflammatory cells (day 3), newly synthesized bone (day 7), and regenerated bone tissue (day 21). Scale bars, 100 μm. (b) Immunohistochemical analysis for F4/80 expression. Representative images showing F4/80+ macrophages around the injury site at day 3 (n=3 mice). Scale bars, 100 μm. (c) Representative images of tdTomato+ cells around the injury site. 2-month-old Csf1r-Mer-iCre-Mer; R26tdTomato mice induced with 4OHT at E9.5 received drill hole injury and were analyzed at day 3 (n=3), 7 (n=3), 14 (n=4), and 21 (n=5). n representing independent animals. White dot lines represent the injury site. 4OHT, 4-hydroxytamoxifen. Scale bars, 100 μm. (d) Representative visualization of tdTomato+ and TRAP+ cells showing less contribution of tdTomato+ cells to the bone remodeling at day 14 (n=4 mice). Scale bars, 50 μm. (e) Percentage of tdTomato+TRAP+ to TRAP+ cells around the injury site of Csf1r-Mer-iCre-Mer; R26tdTomato mice at day 3 (n=3), 7 (n=3), 14 (n=4), and 21 (n=5). n representing independent animals. Statistics source data are provided in Source Data Extended Data Fig. 6.
Extended Data Fig. 7
Migration of EMP-derived osteoclast precursors through the blood circulation. (a) Immunohistochemical analysis for Ki67 expression. Representative images showing Ki67+ and tdTomato+ cells around the injury site and adjacent metaphysis at day 14 (n=3 mice per group). Scale bars, 50 μm. (b) The number of single positive cells of Ki67 and tdTomato and double-positive cells per 0.3 mm2 were quantified (n=3 mice per group). Error bars denote means ± s.d. (c) Representative images of the injured femur of Cx3cr1EGFP/+ mice after the parabiotic union. tdTomato+ cells migrated through the blood circulation at the site of a bone injury. Scale bars, 1 mm. Right panels showing enlarged images (n=4 independent parabiotic pairs). Scale bars, 100 μm. (d) Representative images of uninjured side femur of Cx3cr1EGFP/+ mice. Scale bars, 1 mm. Right panels showing enlarged images (n = 4 independent parabiotic pairs). White triangles indicating tdTomato+ cells. Scale bars, 100 μm. (e) The number of tdTomato+ cells around the injury site and contralateral side of the femur. tdTomato+ cells per 1.26 mm2 were counted and visualized by bar chart (n = 4 mice per group). Unpaired two-tailed t-test. Error bars denote means ± s.d. Statistics source data are provided in Source Data Extended Data Fig. 7.
Extended Data Fig. 8
Schematic representation showing the differential origin of osteoclast precursors and their differentiation. Myb-independent early erythromyeloid progenitors (EMPs) appear around E7–7.5 in the yolk-sac and differentiate into Csf1r+ yolk-sac macrophage (YS Mac) at E8.5 without passing through monocyte intermediates. YS Mac differentiates into CX3C chemokine receptor 1 (CX3CR1) positive premacrophage (pMac), resulting in a significant source of yolk-sac-derived macrophages. Late EMPs emerge in the yolk-sac at E8.5 and migrate to the fetal liver to produce Myb-expressing fetal liver (FL) myeloid progenitors (MP), resulting in FL monocyte (FL Mono). Hematopoietic stem cell precursors (pro-HSCs) emerge at E10.5. Pro-HSCs migrate to the fetal liver around E12 and turns to fetal HSCs, which later shift to the bone marrow. Bone marrow HSCs eventually can establish the circulating monocyte-derived macrophages. YS-derived macrophages differentiate into osteoclast (YS-derived Oc) in the neonatal bone with possible cell-cell fusion with HSC-derived Oc precursors. Cx3cr1+ yolk-sac macrophage descendants in the spleen can provide long-lasting Oc that contribute to the postnatal bone remodeling after injury via the bloodstream.
Figure 1.
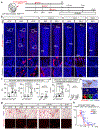
Figure 1.. Csf1r+ yolk-sac macrophages give rise to the neonatal osteoclasts.
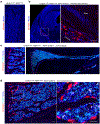
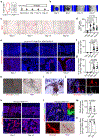
(a) Schematic representation of the fate-mapping analysis of Csf1r-expressing cells and their progenies. E, embryonic day. P, postnatal day. mo, month-old. 4OHT, 4-hydroxytamoxifen. (b) Representative images of tdTomato expressing cells on the postnatal femurs at defined ages and time point of 4OHT induction (P0 (E7.5, n=4; E8.5, n=5; E9.5, n=4), 0.5 mo (E8.5, n=5; E9.5, n=5), 2 mo (E8.5, n=4; E9.5, n=5), and 6 mo (E9.5, n=4)). n representing independent animals. mp, metaphysis. dp, diaphysis. Scale bars, 50 μm. (c) The number of tdTomato+ cells in the metaphysis per 0.32 mm2 at P0 (E7.5, n=4; E8.5, n=5; E9.5, n=4), 0.5 mo (E7.5, n=5; E8.5, n=5; E9.5, n=5), and 2 mo (E8.5, n=4; E9.5, n=5). n representing independent animals. One-way ANOVA (P0, 0.5 mo) and unpaired two-tailed t-test (2 mo). Error bars denote means ± s.d. (d) Percentage of tdTomato+ surface area to the total bone surface area of the endosteum at 0.5 mo (E7.5, n=5; E8.5, n=5; E9.5, n=5) and 2 mo (E8.5, n=4; E9.5, n=5). n representing independent animals. One-way ANOVA (0.5 mo) and unpaired two-tailed t-test (2 mo). Error bars denote means ± s.d. (e) Representative image of immunostaining for tdTomato indicating the multinucleation of tdTomato+ cells from three independent experiments. Scale bar, 50 μm. (f) Representative image of tdTomato expression and antibody staining with Vpp3. Nuclei staining with hoechst showing the multinucleation. Three independent experiments. Scale bar, 50 μm. (g) Representative image of tdTomato+ and TRAP+ cells on the postnatal femur at defined age and time point of 4OHT induction (P0 (E7.5, n=4; E8.5, n=5; E9.5, n=4), 0.5 mo (E8.5, n=5; E9.5, n=5), 2 mo (E9.5, n=5)). n representing independent animals. Scale bars, 50 μm. (h) Percentage of tdTomato+TRAP+ cells to total TRAP+ cells in the metaphysis (P0 (E8.5, n=5; E9.5, n=4), 0.5 mo (E8.5, n=5; E9.5, n=5), 2 mo (E8.5, n=4, E9.5, n=5), 6 mo (E9.5, n=4)). n representing independent animals. Error bars denote means ± s.d. Statistics source data are provided in Source Data Fig. 1.
Figure 2.
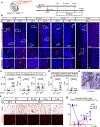
Figure 2.. Cx3cr1+ yolk-sac macrophages give rise to the osteoclasts that survive in adulthood.
(a) Schematic representation of the fate-mapping analysis of Cx3cr1-expressing cells and their progenies. E, embryonic day. P, postnatal day. mo, month-old. 4OHT, 4-hydroxytamoxifen. (b) Representative images of tdTomato expressing cells on the postnatal femur at P0 (E8.5, n=5; E9.5, n=5), 0.5 mo (E8.5, n=4; E9.5, n=5), 2 mo (E8.5, n=3; E9.5, n=5), and 6 mo (E9.5, n=4). n representing independent animals. mp, metaphysis. dp, diaphysis. Scale bars, 50 μm. (c) The number of tdTomato+ cells in the metaphysis per 0.32 mm2 at P0 (E8.5, n=5; E9.5, n=5), 0.5 mo (E8.5, n=4; E9.5, n=5), and 2 mo (E8.5, n=3; E9.5, n=5). n representing independent animals. Unpaired two-tailed t-test. Error bars denote means ± s.d. (d) Percentage of tdTomato+ surface area to the total bone surface area of the endosteum at 0.5 mo (E8.5, n=4; E9.5, n=5) and 2 mo (E8.5, n=3; E9.5, n=5). n representing independent animals. Unpaired two-tailed t-test. Error bars denote means ± s.d. (e) Representative image of immunostaining for tdTomato indicating the multinucleation of tdTomato+ cells from three independent experiments. Scale bar, 50 μm. (f) Representative images of tdTomato+ and TRAP+ cells on the postnatal femur at defined age and time point of 4OHT induction (E8.5; P0, n=5. E9.5; P0, n=5; 0.5 mo, n=5; 2 mo, n=5; 6 mo, n=4). n representing independent animals. Scale bars, 50 μm. (g) Percentage of tdTomato+TRAP+ cells to total TRAP+ cells in the metaphysis (E8.5; P0, n=5; 0.5 mo, n=4; 2 mo, n=3. E9.5; P0, n=5; 0.5 mo, n=5; 2 mo, n=5; 6 mo, n=4). n representing independent animals. Error bars denote means ± s.d. Statistics source data are provided in Source Data Fig. 2.
Figure 3.
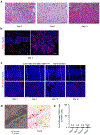
Figure 3.. EMPs and HSCs give rise to the postnatal osteoclast.
(a) Representative images of tdTomato expressing cells on the femur of Flt3-Cre; R26tdTomato mice at defined age (n=3 mice per group). E, embryonic day. P, postnatal day, mo, month-old. mp, metaphysis. dp, diaphysis. Scale bars, 50 μm. (b) Representative images of tdTomato+ and TRAP+ cells of 2 mo Flt3-Cre; R26tdTomato mice femur (n=3 mice). Scale bars, 50 μm. (c) Representative image of tdTomato expression and antibody staining with Vpp3. Nuclei staining with hoechst showing the multinucleation. Three independent experiments. Scale bar, 50 μm. (d) Quantification of the percentage of tdTomato+TRAP+ cells to total TRAP+ cells in the metaphysis of Flt3-Cre; R26tdTomato mice at E17.5 (n=4 mice), P0 (n=3 mice), and 2 mo (n=5 mice) of age. E17.5 R26tdTomato mice (n=3 mice) were used as Cre negative control. One-way ANOVA was used to compare among E17.5, P0, and 2 mo Flt3-Cre; R26tdTomato mice. Error bars denote means ± s.d. (e) Flow cytometry analysis of bone marrow cell (BMC) from 2 mo Csf1r-Mer-iCre-Mer; R26tdTomato and Cx3cr1CreER; R26tdTomato mice treated with 4OHT at E8.5 or E9.5 and Flt3-Cre; R26tdTomato mice (n=4 mice per group). (f) Quantification of percentage of tdTomato+ cells per CD45+ BMCs of 2 mo Csf1r-Mer-iCre-Mer; R26tdTomato, Cx3cr1CreER; R26tdTomato, and Flt3-Cre; R26tdTomato mice (n=4 mice per group). One-way ANOVA. Error bars denote means ± s.d. (g) In vitro osteoclast differentiation of tdTomato+ cells from E14.5 Csf1r-Mer-iCre-Mer; R26tdTomato mice labeled at E8.5 and Cx3cr1CreER; R26tdTomato mice labeled at E9.5 (representative image from three independent experiments). BMCs were isolated from 2 mo Flt3-Cre; R26tdTomato mice and C57BL6/J mice (representative image from two independent experiments) and differentiated into osteoclast. Upper panels showing TRAP staining and lower panels showing tdTomato expression. Scale bars, 100 μm. (h) The number of multinucleated TRAP+ cells per 4.8 mm2. Data were combined from two independent experiments (Csf1r-Mer-iCre-Mer; R26tdTomato, n=4 mice; Cx3cr1CreER; R26tdTomato, n=5 mice; Flt3-Cre; R26tdTomato, n=3 mice). TRAP-positive multinucleated cells with more than three nuclei were counted as osteoclasts. Error bars denote means ± s.d. Statistics source data are provided in Source Data Fig. 3.
Figure 4.
Figure 4.. EMP- and HSC-derived cells specify distinct subpopulations.
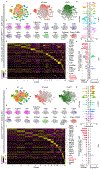
(a) t-distributed stochastic neighbor embedding (t-SNE) plot of 19,598 cells from Csf1r-Mer-iCre-Mer; Csf1r-EGFP; R26tdTomato mice (n=2 mice) identified 29 clusters. (b) Violin plots showing Csf1r and tdTomato expression levels of the cells from Csf1r-Mer-iCre-Mer; Csf1r-EGFP; R26tdTomato mice (n=2 mice). The number in the middle column show cluster identity and the number of cells in each cluster is provided in Statistical source data Fig. 4. (c) Normalized expression of indicated marker genes was visualized onto t-SNE plots of 19,598 cells from Csf1r-Mer-iCre-Mer; Csf1r-EGFP; R26tdTomato mice (n=2 mice). (d) Heatmap representing the top 10 significantly differentially expressed genes in each cluster. (e) The number of tdTomato+ cells in each cluster are shown with the expression level of Flt3. The number in the middle column show cluster identity and the number of cells and tdTomato+ cells in each cluster are provided in Statistical source data Fig. 4. (f) t-SNE plot of 16,169 cells from Cx3cr1CreER; R26tdTomato mice (n=2 mice) provided 21 clusters. (g) Violin plots showing Cx3cr1 and tdTomato expression levels of the cells from Cx3cr1CreER; R26tdTomato mice (n=2 mice). The number in the middle column show cluster identity and the number of cells in each cluster is provided in Statistical source data Fig. 4. (h) Normalized expression of indicated marker genes was visualized onto t-SNE plots of 16,169 cells from Cx3cr1CreER; R26tdTomato mice (n=2 mice). (i) Heatmap representing the top 10 significantly differentially expressed genes in each cluster. (j) The number of tdTomato+ cells in each cluster are shown with the expression level of Flt3. The number in the middle column show cluster identity and the number of cells and tdTomato+ cells in each cluster are provided in Statistical source data Fig. 4. Statistics source data are provided in Source Data Fig. 4.
Figure 5.
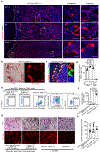
Figure 5.. Cx3cr1+ yolk-sac macrophage descendants provide osteoclasts after bone injury.
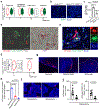
(a) Schematic representation of the experimental procedure. 4OHT, 4-hydroxytamoxifen. (b) μCT of the injury site during bone healing (n=3 mice per group). Scale bars, 0.2 mm. (c) TRAP staining around the injury site at day 3 (n=8), 7 (n=7), 14 (n=11), and 21 (n=8). n representing independent animals. Black dot lines represent the site of the bone injury. Scale bars, 100 μm. (d) Number of TRAP+ cells around the injury site per 1.26 mm2 at day 3 (n=8), 7 (n=7), 14 (n=11), and 21 (n=8). n representing independent animals. One-way ANOVA. Error bars denote means ± s.d. (e) tdTomato+ cells around the injury site at day 3 (n=5), 7 (n=4), 14 (n=7), and 21 (n=5). n representing independent animals. White dot lines represent the injury site. Scale bars, 100 μm. (f) Number of tdTomato+TRAP+ cells and (g) Percentage of tdTomato+TRAP+ cells per TRAP+ cells around the injury site per 1.26 mm2 at day 3 (n=5), 7 (n=4), 14 (n=7), and 21 (n=5). n representing independent animals. One-way ANOVA. Error bars denote means ± s.d. (h) tdTomato+ and TRAP+ cells around the injury site at day 21 (n=5 mice). Scale bars, 100 μm. (i) Multinucleated tdTomato+ cells around the injury site at day 14 (n=3 mice). Scale bar, 10 μm. (j) F4/80 and tdTomato expression around the injury site at day 14 (n=3 mice). Scale bar, 50 μm. (k) tdTomato+ cells of 2-month-old Flt3-Cre; R26tdTomato mice around the injury site. (n=3 mice per group). Lower panels showing magnified view. White dot lines represent the injury site. Scale bars, 100 μm. (l) TRAP staining, tdTomato expression and antibody staining with Vpp3 at day 14. Nuclei staining with hoechst showing the multinucleation (n=3 mice). Scale bar, upper; 100 μm. Lowers; 10 μm. (m) The number of tdTomato+TRAP+ cells and (n) percentage of tdTomato+TRAP+ cells per TRAP+ cells around the injury site per 1.26 mm2 (n=3 mice per group) of Flt3-Cre; R26tdTomato mice. Unpaired two-tailed t-test. Error bars denote means ± s.d. Statistics source data are provided in Source Data Fig. 5.
Figure 6.
Figure 6.. Cx3cr1+ yolk-sac macrophage descendants migrated into bone injury site through blood circulation.
(a) Schematic representation of the experimental procedure. 4OHT, 4-hydroxytamoxifen. (b) Representative images of EGFP expression of the BMCs 5 weeks after parabiotic combination between Cx3cr1EGFP/+ and Cx3cr1CreER; R26tdTomato mice induced with 4OHT at E9.5 (n= 3 mice per group). Scale bars, 50 μm. (c) The number of EGFP+ cells per 1.26 mm2 (n=3 mice per group). Unpaired two-tailed t-test. Error bars denote means ± s.d. (d) Representative images of tdTomato+ and EGFP+ cells around the injury site of Cx3cr1EGFP/+ mice 14 days after surgery. (n=4 independent parabiotic pairs). Left and middle panels showing tdTomato+ and EGFP+ cells. Right panel showing TRAP+ cells around the injury. Scale bars, 50 μm. (e) Representative images of tdTomato and EGFP expression around the injury site of Cx3cr1EGFP/+ mice at day 14 showing coexpression of tdTomato and EGFP. Nuclei staining with hoechst showing the multinucleation. Two of four independent parabiotic pairs showed coexpression of tdTomato and EGFP in injured Cx3cr1EGFP/+ mice. Scale bar, 50 μm. (f) Schematic representation of the experimental procedure. 4OHT, 4-hydroxytamoxifen. (g) Representative images of tdTomato expressing cells in the red pulp, marginal zone, and white pulp of the spleen of 2-month-old Cx3cr1CreER; R26tdTomato mice labeled at E9.5 (n=3 mice per group). White dot lines representing the boundary between the red and white pulps. Scale bars, 50 μm. (h) The number of tdTomato+ cells in the red pulp, marginal zone, and white pulp of the spleen (n=3 per group). One-way ANOVA. Error bars denote means ± s.d. (i) Representative images of tdTomato+ cells around the injury site 14 days after injury with (n=5 mice) or without splenectomy (n=7 mice). Scale bars, 50 μm. (j) Quantitative analysis of tdTomato+ and TRAP+ cells around the injury site 14 days after injury with (n=5 mice) or without splenectomy (n =7 mice). Unpaired two-tailed t-test. Error bars denote means ± s.d. Statistics source data are provided in Source Data Fig. 6.

Similar articles

Cited by

References

    1. Frost HM, Vilanueva AR, Jett S & Eyring E Tetracycline-based analysis of bone remodelling in osteopetrosis. Clinical orthopaedics and related research 65, 203–217 (1969). - PubMed
    1. Chan CKF et al. Identification of the Human Skeletal Stem Cell. Cell 175, 43–56 e21 (2018). - PMC - PubMed
    1. Debnath S et al. Discovery of a periosteal stem cell mediating intramembranous bone formation. Nature 562, 133–139 (2018). - PMC - PubMed
    1. Yue R, Zhou Bo O. Shimada, Issei S, Zhao Z & Morrison Sean J. Leptin Receptor Promotes Adipogenesis and Reduces Osteogenesis by Regulating Mesenchymal Stromal Cells in Adult Bone Marrow. Cell Stem Cell 18, 782–796 (2016). - PubMed
    1. Udagawa N et al. Origin of osteoclasts: mature monocytes and macrophages are capable of differentiating into osteoclasts under a suitable microenvironment prepared by bone marrow-derived stromal cells. Proceedings of the National Academy of Sciences of the United States of America 87, 7260–7264 (1990). - PMC - PubMed

Publication types