

Upregulated Lipid Biosynthesis at the Expense of Starch Production in Potato (Solanum tuberosum) Vegetative Tissues via Simultaneous Downregulation of ADP-Glucose Pyrophosphorylase and Sugar Dependent1 Expressions
- PMID: 31781148
- PMCID: PMC6861213
- DOI: 10.3389/fpls.2019.01444
Upregulated Lipid Biosynthesis at the Expense of Starch Production in Potato (Solanum tuberosum) Vegetative Tissues via Simultaneous Downregulation of ADP-Glucose Pyrophosphorylase and Sugar Dependent1 Expressions
Abstract
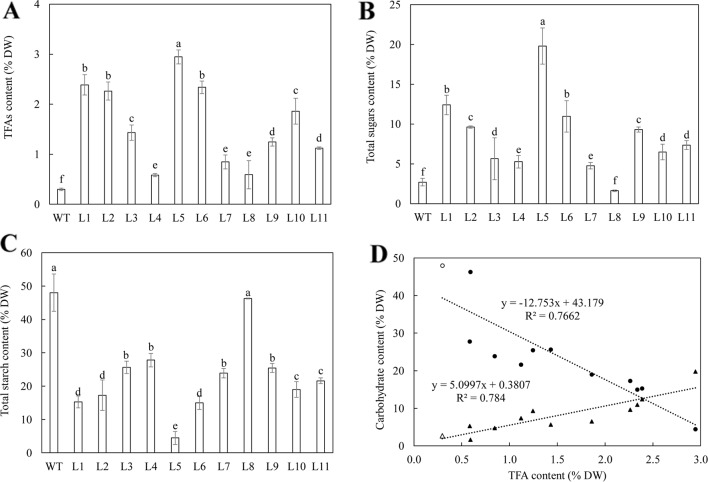
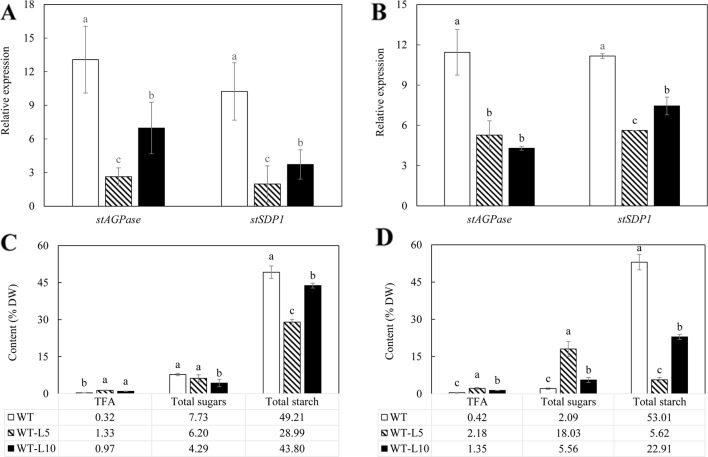
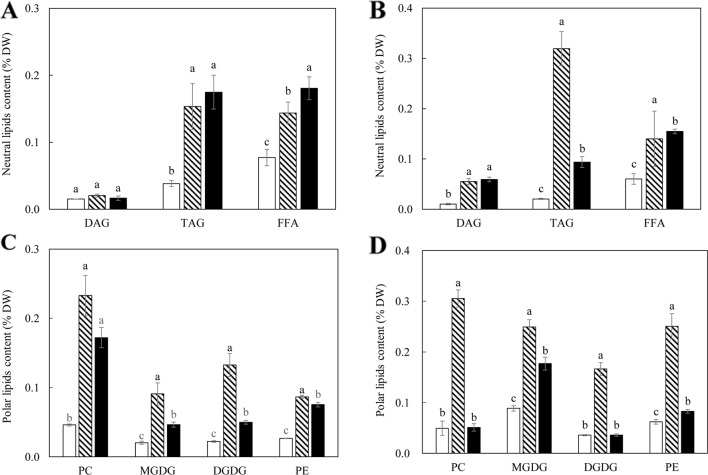
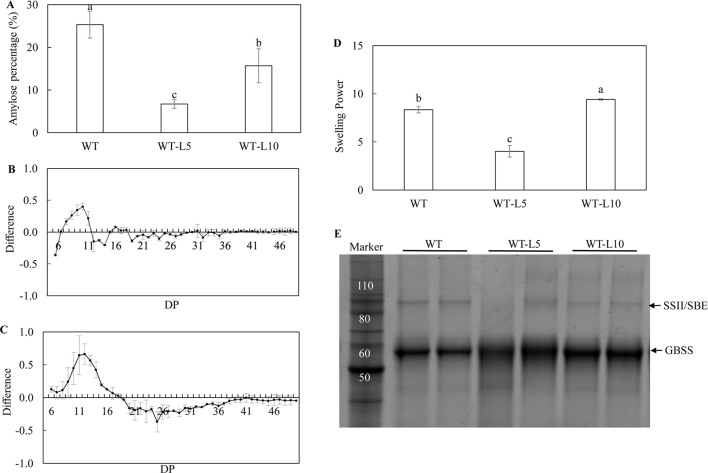
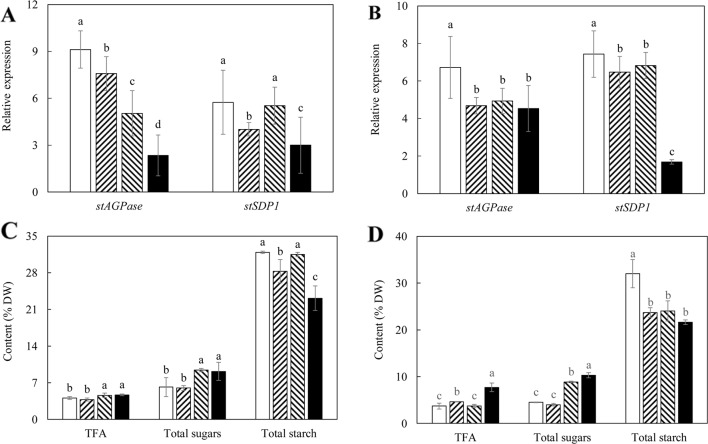
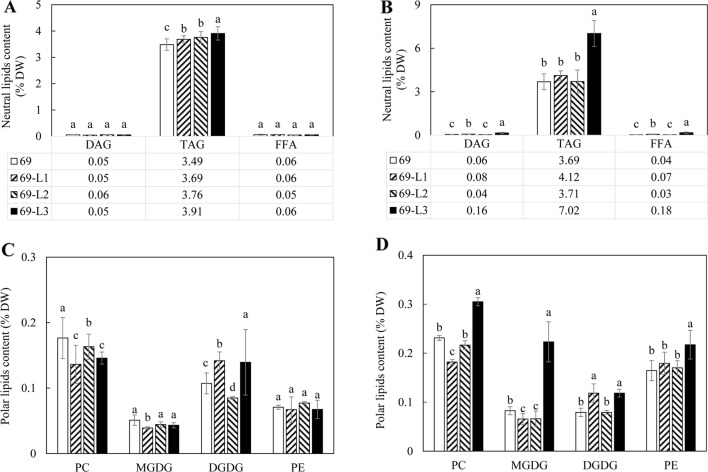
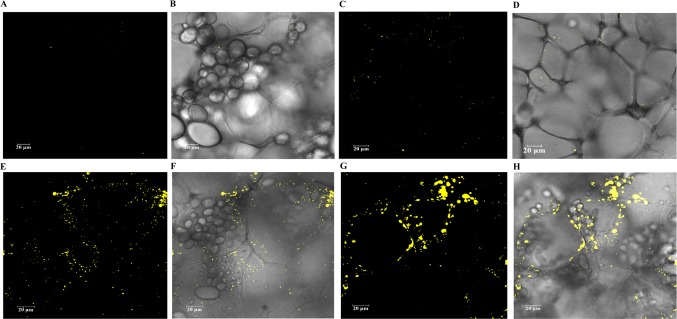
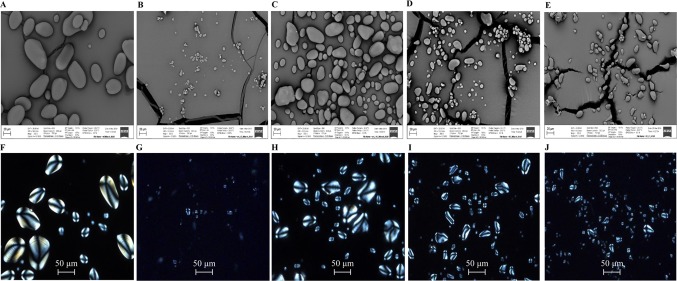
Triacylglycerol is a major component of vegetable oil in seeds and fruits of many plants, but its production in vegetative tissues is rather limited. It would be intriguing and important to explore any possibility to expand current oil production platforms, for example from the plant vegetative tissues. By expressing a suite of transgenes involved in the triacylglycerol biosynthesis, we have previously observed substantial accumulation of triacylglycerol in tobacco (Nicotiana tabacum) leaf and potato (Solanum tuberosum) tuber. In this study, simultaneous RNA interference (RNAi) downregulation of ADP-glucose pyrophosphorylase (AGPase) and Sugar-dependent1 (SDP1), was able to increase the accumulation of triacylglycerol and other lipids in both wild type potato and the previously generated high oil potato line 69. Particularly, a 16-fold enhancement of triacylglycerol production was observed in the mature transgenic tubers derived from the wild type potato, and a two-fold increase in triacylglycerol was observed in the high oil potato line 69, accounting for about 7% of tuber dry weight, which is the highest triacylglycerol accumulation ever reported in potato. In addition to the alterations of lipid content and fatty acid composition, sugar accumulation, starch content of the RNAi potato lines in both tuber and leaf tissues were also substantially changed, as well as the tuber starch properties. Microscopic analysis further revealed variation of lipid droplet distribution and starch granule morphology in the mature transgenic tubers compared to their parent lines. This study reflects that the carbon partitioning between lipid and starch in both leaves and non-photosynthetic tuber tissues, respectively, are highly orchestrated in potato, and it is promising to convert low-energy starch to storage lipids via genetic manipulation of the carbon metabolism pathways.
Keywords: ADP-glucose pyrophosphorylase; RNA interference; Solanum tuberosum; potato; sugar dependent1; triacylglycerol.
Copyright © 2019 Xu, Vanhercke, Shrestha, Luo, Akbar, Konik-Rose, Venugoban, Hussain, Tian, Singh, Li, Sharp and Liu.
Figures

Similar articles
-
Genetic enhancement of oil content in potato tuber (Solanum tuberosum L.) through an integrated metabolic engineering strategy.Plant Biotechnol J. 2017 Jan;15(1):56-67. doi: 10.1111/pbi.12590. Epub 2016 Jul 11. Plant Biotechnol J. 2017. PMID: 27307093 Free PMC article.
-
Inhibition of the ADP-glucose pyrophosphorylase in transgenic potatoes leads to sugar-storing tubers and influences tuber formation and expression of tuber storage protein genes.EMBO J. 1992 Apr;11(4):1229-38. doi: 10.1002/j.1460-2075.1992.tb05167.x. EMBO J. 1992. PMID: 1373373 Free PMC article.
-
The influence of alterations in ADP-glucose pyrophosphorylase activities on starch structure and composition in potato tubers.Planta. 1999 Aug 12;209(2):230-238. doi: 10.1007/s004250050627. Planta. 1999. PMID: 10436226
-
Gene expression during tuber development in potato plants.FEBS Lett. 1990 Aug 1;268(2):334-8. doi: 10.1016/0014-5793(90)81281-r. FEBS Lett. 1990. PMID: 2200713 Review.
-
Sucrose signaling in higher plants.Plant Sci. 2021 Jan;302:110703. doi: 10.1016/j.plantsci.2020.110703. Epub 2020 Oct 4. Plant Sci. 2021. PMID: 33288016 Review.
Cited by
-
Applications and prospects of genome editing in plant fatty acid and triacylglycerol biosynthesis.Front Plant Sci. 2022 Aug 31;13:969844. doi: 10.3389/fpls.2022.969844. eCollection 2022. Front Plant Sci. 2022. PMID: 36119569 Free PMC article. Review.
-
Cassava shrunken-2 homolog MeAPL3 determines storage root starch and dry matter content and modulates storage root postharvest physiological deterioration.Plant Mol Biol. 2022 Jun;109(3):283-299. doi: 10.1007/s11103-020-00995-z. Epub 2020 Oct 6. Plant Mol Biol. 2022. PMID: 32270429 Free PMC article.
-
Recent advances and challenges in potato improvement using CRISPR/Cas genome editing.Planta. 2022 Dec 23;257(1):25. doi: 10.1007/s00425-022-04054-3. Planta. 2022. PMID: 36562862 Free PMC article. Review.
-
Sandbur Drought Tolerance Reflects Phenotypic Plasticity Based on the Accumulation of Sugars, Lipids, and Flavonoid Intermediates and the Scavenging of Reactive Oxygen Species in the Root.Int J Mol Sci. 2021 Nov 23;22(23):12615. doi: 10.3390/ijms222312615. Int J Mol Sci. 2021. PMID: 34884421 Free PMC article.
-
Mutation of TL1, encoding a novel C2H2 zinc finger protein, improves grains eating and cooking quality in rice.Theor Appl Genet. 2022 Oct;135(10):3531-3543. doi: 10.1007/s00122-022-04198-6. Epub 2022 Aug 22. Theor Appl Genet. 2022. PMID: 35994056
References
-
- Barrell P. J., Yongjin S., Cooper P. A., Conner A. J. (2002). Alternative selectable markers for potato transformation using minimal T-DNA vectors. Plant Cell Tiss. Org. 70 (1), 61–68. 10.1023/A:1016013426923 - DOI
LinkOut - more resources
Full Text Sources