. 2020 Jan 22;105(2):260-275.e6.
doi: 10.1016/j.neuron.2019.10.010. Epub 2019 Nov 20.

Amyloid-Beta (Aβ) Plaques Promote Seeding and Spreading of Alpha-Synuclein and Tau in a Mouse Model of Lewy Body Disorders with Aβ Pathology

Affiliations

Amyloid-Beta (Aβ) Plaques Promote Seeding and Spreading of Alpha-Synuclein and Tau in a Mouse Model of Lewy Body Disorders with Aβ Pathology

Fares Bassil et al. Neuron. .

Erratum in

Abstract

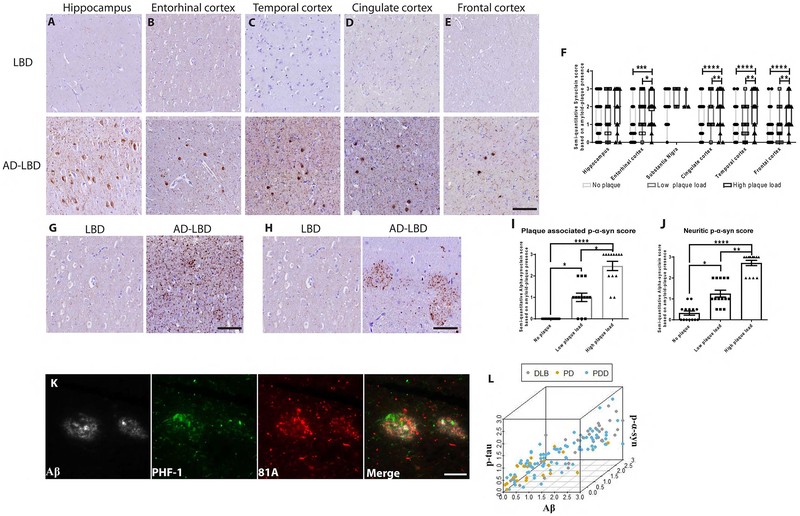
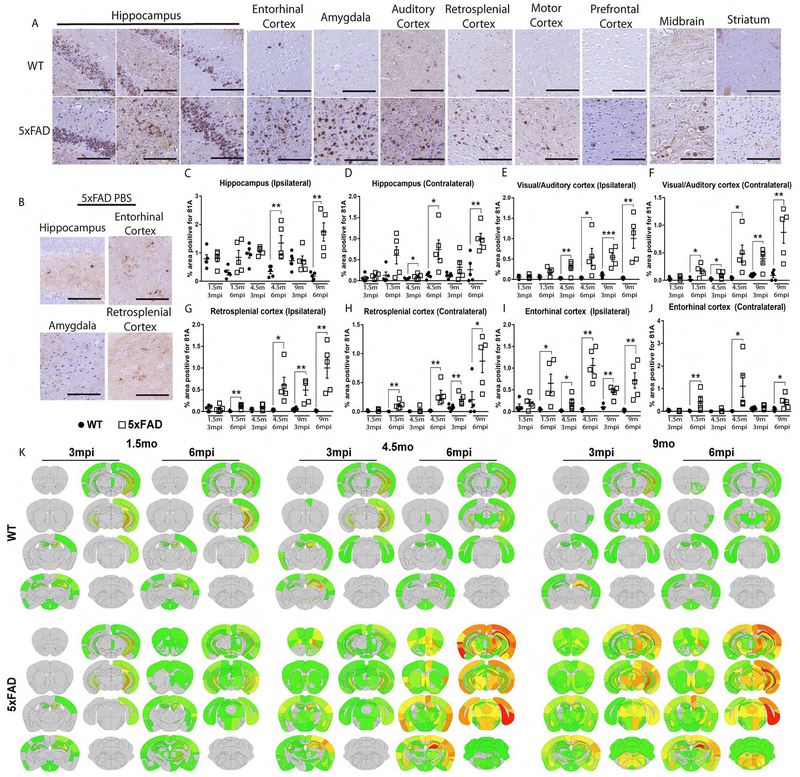
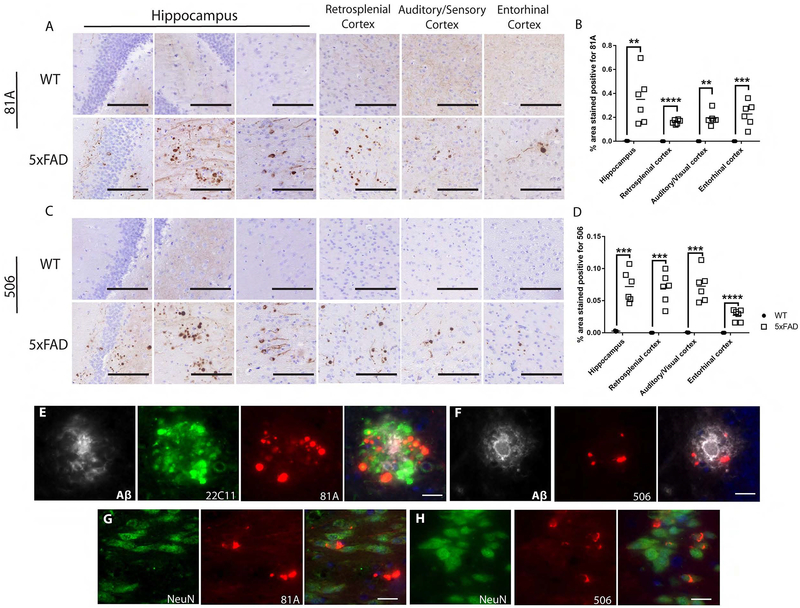
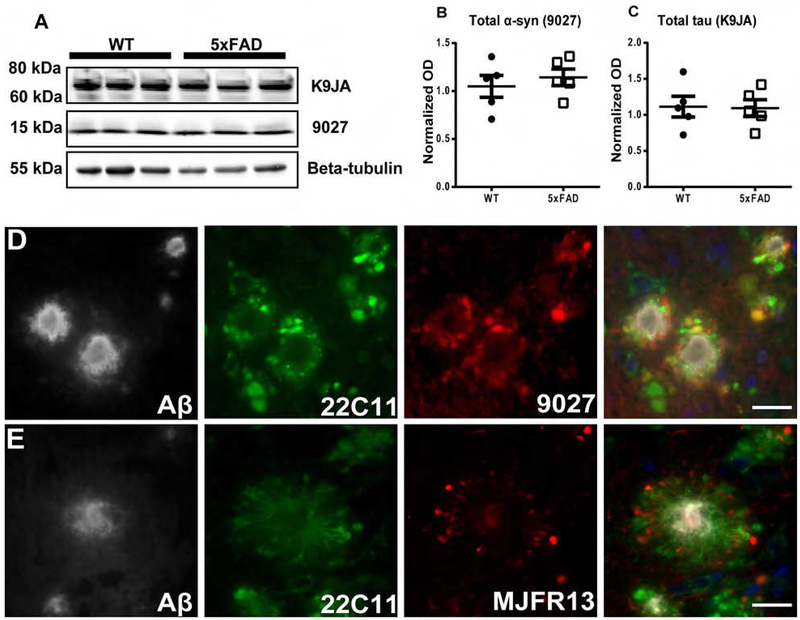
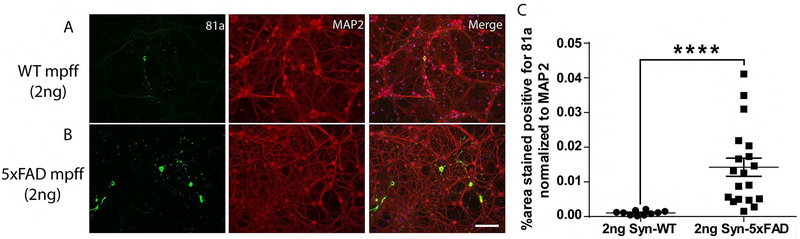
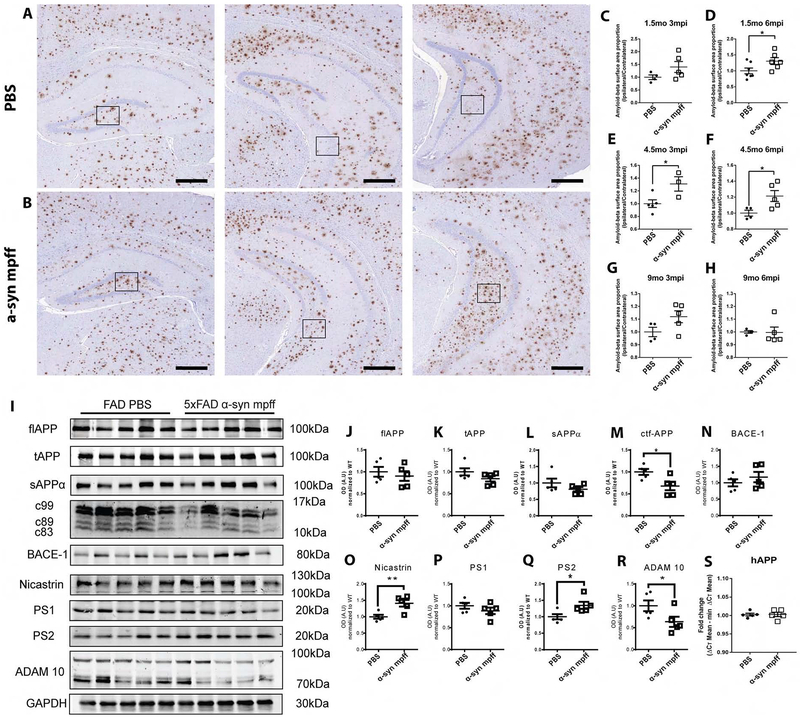
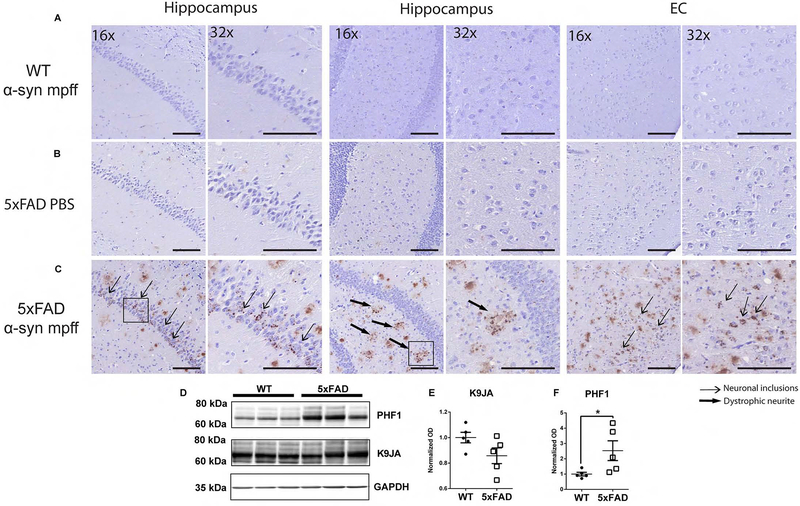
Studies have shown an overlap of Aβ plaques, tau tangles, and α-synuclein (α-syn) pathologies in the brains of Alzheimer's disease (AD) and Parkinson's disease (PD) with dementia (PDD) patients, with increased pathological burden correlating with severity of cognitive and motor symptoms. Despite the observed co-pathology and concomitance of motor and cognitive phenotypes, the consequences of the primary amyloidogenic protein on the secondary pathologies remain poorly understood. To better define the relationship between α-syn and Aβ plaques, we injected α-syn preformed fibrils (α-syn mpffs) into mice with abundant Aβ plaques. Aβ deposits dramatically accelerated α-syn pathogenesis and spread throughout the brain. Remarkably, hyperphosphorylated tau (p-tau) was induced in α-syn mpff-injected 5xFAD mice. Finally, α-syn mpff-injected 5xFAD mice showed neuron loss that correlated with the progressive decline of cognitive and motor performance. Our findings suggest a "feed-forward" mechanism whereby Aβ plaques enhance endogenous α-syn seeding and spreading over time post-injection with mpffs.

Keywords: Lewy bodies; Parkinson’s disease; alpha-synuclein; alzheimer's disease; amyloid-beta plaques; comorbidity; dementia; parkinsonism; tau.


Conflict of interest statement

Declaration of Interests

The authors declare no competing interest.

Figures

Figure 1:
Figure 1:. Aβ plaque burden is positively correlated with plaque associated p-α-syn pathology in human LBD cases with concomitant AD pathology.
Representative images using MAb 81A p-α-syn pathology on tissue sections from the (A) hippocampus, (B) entorhinal cortex, (C) temporal cortex, (D) cingulate cortex and (E) frontal cortex in PD patients (LBD) with only α-syn pathology and LBD patients with concomitant AD pathology (AD-LBD) Scale bar: 20 μm. F) A grouped bar graph shows a positive association between Aβ plaque load and semi-quantitative α-syn score. G, H) IHC conducted on frontal cortex sections using p-α-syn using 81A showing neuritic staining in AD-LBD brains. Scale bar: 20 μm. I, J) A bar graph shows a positive correlation between Aβ plaque burden and the induction of (G) dystrophic neurite and (H) neuritic p-α-syn in LBD and AD-LBD patients. A Kruskal-Wallis test was used for the analysis in (G) and (H) (*p<0.05, **p<0.01, ****p<0.0001). K) IF triple-labeling was conducted for Aβ (grey), p-tau (green), and p-α-syn (red) using NAB228, PHF-1, and 81A, respectively. Scale bar: 20 μm. The spatial organization and close association of each protein are seen when all three channels are merged. L) Three-way correlation between Aβ, p-α-syn, and p-tau semi-quantitative scores ascribed to all PD, PDD, and DLB cases (Spearman correlation; Aβ/α-syn: r=0.82, accounting for tau r=0.62; tau/α-syn: r=0.74, accounting for Aβ r=0.44).
Figure 2:
Figure 2:. α-syn mpff-injected 5xFAD mice display abundant p-α-syn pathology compared to their WT counterparts.
(A) IHC was conducted as described in methods using 81A on sections form α-syn mpff-injected 5xFAD mice and α-syn mpff-injected WT littermates, as well as (B) PBS-injected 5xFAD mice. Grouped bar graphs of 81A-positive p-α-syn pathology as described in the results (C-J) of 5xFAD mice (grey bars) and WT littermates (black bars). A two-tailed t-test was used when the data was normally distributed. If the data was not normally distributed, a Mann-Whitney test was used. (K) Heat maps of p-α-syn (based on 81A staining) as shown in the figure and described in the text of α-syn mpff-injected WT and 5xFAD mice. The increase in α-syn pathology in 5xFAD relative to WT mice is reflected by the color change from grey (no pathology) to red (saturation of pathology). (n=5-6 mice per group). *p<0.05,**p<0.01,***p<0.001. Data are presented as mean ± s.e.m. Scale bar: 100 μm.
Figure 3:
Figure 3:. Human brain-derived pathological α-syn seeds p-α-syn and α-syn pathology in 5xFAD mice.
(A, C, E-H) are representative images from 4.5 mo 3 mpi with LBD brain-derived pathological α-syn in WT and 5xFAD mice. IHC used 81A (A) and Syn-506 (C) sections from LB-α-syn-injected 4.5 mo 3 mpi 5xFAD mice and age- and sex-matched WT littermates 3 mpi. Scatterplots display quantification of 81A-positive (B) and 506-positive (D) α-syn pathology as a percentage of the area occupied in the ipsilateral hippocampus, visual/auditory cortices, retrosplenial cortex and entorhinal cortex of 5xFAD mice (open squares) and WT littermates (black circles). A two-tailed t-test was performed to calculate the difference in 81A and 506 surface area between groups for each structure. If the data was not normally distributed, a Mann-Whitney test was used *p<0.01, ***p<0.001, ****p<0.0001. Data are presented as mean ± s.e.m. E) IF triple-labelling was conducted for p-α-syn (red) in dystrophic neurites (green) around Aβ plaques (grey), using 81A, 22C11, and NAB228, respectively. F) IF double-labelling was conducted for conformationally altered-α-syn pathology (red) around Aβ plaques (grey), using 506 and NAB228, respectively. G) IF double-labelling was conducted for p-α-syn (red) in neurons (green), using 81A and NeuN, respectively. H) IF triple-labelling for conformationally altered-α-syn pathology (red) in neurons (green), using 506 and NeuN. Black scale bar: 100 μm. White scale bar: 20 μm. (n=5-6 mice per group).
Figure 4:
Figure 4:. α-syn is pooled and phosphorylated in dystrophic neurites surrounding Aβ plaques.
A) Immunoblots were conducted on whole brain lysates from 10 mo old non-injected WT and 5xFAD mice as shown in the figure and described in results. Quantification showed similar levels of endogenous mouse α-syn (B) and tau (C) proteins. Scale bar, 40 μm. D) As shown here and described in results, IF triple-labelling showed the re-localization and pooling of endogenous α-syn (red) APP positive neurites (green) around Aβ plaques (grey), using 9027, 22C11, and NAB228, respectively. (E) IF triple-labelling of p-α-syn (red) in dystrophic neurites (green) around Aβ plaques (grey) was conducted using MJFR13, 22C11, and NAB228, respectively. White scale bar: 20 μm. A two-tailed t-test was performed. Data are presented as mean ± s.e.m. (n=5 mice per group).
Figure 5:
Figure 5:. α-syn (2ng) extracted from α-syn mpff-injected 5xFAD mice induces more α-syn pathology than α-syn (2ng) purified from α-syn mpff-injected WT mice.
IF double-labelling showed increased 81A-positive p-α-syn pathology (green) in neurons transduced with α-syn extracted from α-syn mpff-injected 5xFAD mice (B) compared to neurons transduced with α-syn extracted from α-syn mpff-injected WT mice (A). Scale bar: 100 μm. C) A Mann-Whitney test confirmed the significant increase in 81A positive staining (p<0.0001) ****p<0.0001. Data are presented as mean ± s.e.m.
Figure 6:
Figure 6:. α-syn mpff-injected 5xFAD mice showed an increased hippocampal Aβ plaque burden relative to PBS-injected 5xFAD mice.
IHC was conducted as described in methods on hippocampal sections from 10 mo PBS-injected 5xFAD mice (A) and α-syn mpff-injected 5xFAD mice (B). Black scale bar: 400 μm. C-H) A significant increase in Aβ plaques in α-syn mpff-injected 5xFAD mice. For each mouse, an ipsilateral to contralateral ratio was calculated, thereby minimizing inter-mouse variability. I) Immunoblot probing for APP processing mechanism was conducted on the soluble fractions from the hippocampus of 4.5mo6mpi PBS and α-syn mpffs-injected 5xFAD. Comparison was done between PBS and α-syn mpffs injected-5xFAD mice for each structure (J-R). S) hAPP qPCR was done to measure APP mRNA levels. See figure and results for details. A two-tailed t-test was used when the data was normally distributed. If the data was not normally distributed, a Mann-Whitney test was used. Data are presented as mean ± s.e.m.*p < 0.05, **p<0.01. (n=5 mice per group).
Figure 7:
Figure 7:. Brain injections of mpffs in 5xFAD mice leads to accumulations of hyperphosphorylated tau.
IHC was conducted as described in methods on sections from α-syn mpff-injected WT mice (A), PBS-injected 5xFAD (B) and α-syn mpff-injected 5xFAD mice (C). The latter group displays AT8-positive staining in the cytoplasm of neurons (thin arrows) and dystrophic neurites (thick arrows). Scale bar, 100 μm. D) Immunoblots on hippocampus of α-syn mpff-injected WT and 5xFAD mice revealed no change in endogenous mouse tau (K9JA) (E), but a significant increase in p-tau (PHF-1) (F) in α-syn mpff-injected 5xFAD mice relative to α-syn mpff-injected WT. A two-tailed t-test was performed to calculate the difference between groups *p<0.05. Data are presented as mean ± s.e.m (n=5 mice per group).
Figure 8:
Figure 8:. α-syn mpff-injected 5xFAD mice showed significant neuron loss in the hippocampus, VTA and SNpc.
A-D) IHC for NeuN in the mice shown here as described in results. Two-way ANOVA followed by Tukey’s post-hoc analysis were used to analyze the data (E-G). Black scale bar (Large images): 200 μm, black scale bar (small images): 20 μm. H-O) IHC for TH was conducting on SNpc sections from 4.5 mo 6 mpi PBS-injected WT (H, I), α-syn mpff-injected WT (J, K), PBS-injected 5xFAD mice (L, M) and α-syn mpff-injected 5xFAD (N, O) mice. Two-way ANOVA followed by Tukey’s post-hoc analysis were used to analyze the data (P, Q). Black scale bar: 1000 μm. *p < 0.05, **p< 0.01, ***p< 0.001. Data are presented as mean ± s.e.m. (n=4-5 mice per group). R) IF double-labeling was conducted for p-α-syn (red) in surviving dopaminergic neurons (green) using 81A and TH, respectively. White scale bar: 20 μm.

Comment in

  • Aβ Puts the Alpha in Synuclein.
    Cook C, Petrucelli L. Cook C, et al. Neuron. 2020 Jan 22;105(2):205-206. doi: 10.1016/j.neuron.2020.01.001. Neuron. 2020. PMID: 31972141

Similar articles

Cited by

References

    1. Alberdi E, Wyssenbach A, Alberdi M, Sanchez-Gomez MV, Cavaliere F, Rodriguez JJ, Verkhratsky A, and Matute C (2013). Ca(2+) -dependent endoplasmic reticulum stress correlates with astrogliosis in oligomeric amyloid beta-treated astrocytes and in a model of Alzheimer’s disease. Aging cell 12, 292–302. - PubMed
    1. Bachhuber T, Katzmarski N, McCarter JF, Loreth D, Tahirovic S, Kamp F, Abou-Ajram C, Nuscher B, Serrano-Pozo A, Muller A, et al. (2015). Inhibition of amyloid-beta plaque formation by alpha-synuclein. Nature medicine 21, 802–807. - PubMed
    1. Badiola N, de Oliveira RM, Herrera F, Guardia-Laguarta C, Goncalves SA, Pera M, Suarez-Calvet M, Clarimon J, Outeiro TF, and Lleo A (2011). Tau enhances alpha-synuclein aggregation and toxicity in cellular models of synucleinopathy. PloS one 6, e26609. - PMC - PubMed
    1. Bate C, Gentleman S, and Williams A (2010). alpha-synuclein induced synapse damage is enhanced by amyloid-beta1-42. Molecular neurodegeneration 5, 55. - PMC - PubMed
    1. Bennett DA, Buchman AS, Boyle PA, Barnes LL, Wilson RS, and Schneider JA (2018). Religious Orders Study and Rush Memory and Aging Project. Journal of Alzheimer’s disease : JAD 64, S161–S189. - PMC - PubMed

Publication types