. 2019 Oct 29;11(11):1684.
doi: 10.3390/cancers11111684.

NEDD9 Inhibition by miR-25-5p Activation Is Critically Involved in Co-Treatment of Melatonin- and Pterostilbene-Induced Apoptosis in Colorectal Cancer Cells

Affiliations

NEDD9 Inhibition by miR-25-5p Activation Is Critically Involved in Co-Treatment of Melatonin- and Pterostilbene-Induced Apoptosis in Colorectal Cancer Cells

Ji Hoon Jung et al. Cancers (Basel). .

Abstract

The underlying interaction between melatonin (MLT) and daily fruit intake still remains unclear to date, despite multibiological effects of MLT. Herein, the apoptotic mechanism by co-treatment of MLT and pterostilbene (Ptero) contained mainly in grape and blueberries was elucidated in colorectal cancers (CRCs). MLT and Ptero co-treatment (MLT+Ptero) showed synergistic cytotoxicity compared with MLT or Ptero alone, reduced the number of colonies and Ki67 expression, and also increased terminal deoxynucleotidyl transferase dUTP nick end labeling- (TUNEL) positive cells and reactive oxygen species (ROS) production in CRCs. Consistently, MLT+Ptero cleaved caspase 3 and poly (ADP-ribose) polymerase (PARP), activated sex-determining region Y-Box10 (SOX10), and also attenuated the expression of Bcl-xL, neural precursor cell expressed developmentally downregulated protein 9 (NEDD9), and SOX9 in CRCs. Additionally, MLT+Ptero induced differentially expressed microRNAs (upregulation: miR-25-5p, miR-542-5p, miR-711, miR-4725-3p, and miR-4484; downregulation: miR-4504, miR-668-3p, miR-3121-5p, miR-195-3p, and miR-5194) in HT29 cells. Consistently, MLT +Ptero upregulated miR-25-5p at mRNA level and conversely NEDD9 overexpression or miR-25-5p inhibitor reversed the ability of MLT+Ptero to increase cytotoxicity, suppress colony formation, and cleave PARP in CRCs. Furthermore, immunofluorescence confirmed miR-25-5p inhibitor reversed the reduced fluorescence of NEDD9 and increased SOX10 by MLT+Ptero in HT29 cells. Taken together, our findings provided evidence that MLT+Ptero enhances apoptosis via miR-25-5p mediated NEDD9 inhibition in colon cancer cells as a potent strategy for colorectal cancer therapy.

Keywords: MLT; NEDD9; Ptero; apoptosis; miR-25-5p; synergy.


Conflict of interest statement

The authors declare no conflict of interest.

Figures

Figure 1
Figure 1
Synergistic cytotoxicity of melatonin (MLT) and pterostilbene (Ptero) co-treatment (MLT+Ptero) in colon cancer cells. Cytotoxicity of MLT (A), Ptero (B), MLT with or without Ptero (C) in CCD-18Co. Cytotoxicity of MLT (D) or Ptero (E), HT29, SW480, and HCT116 cells by MTT assay. Three colon cancer cell lines were exposed to the indicated concentrations of MLT or Ptero for 24 h and then cell viability was analyzed by MTT assay. (F) Bar graphs indicate cytotoxicity of MLT and/or Ptero in three colon cancer cells by MTT assay. Data represent means ± SD from three separate experiments. (G) Combination index (CI) for cytotoxicity of MLT and Ptero was determined by Chou-Talalay method using the Calcusyn software.
Figure 1
Figure 1
Synergistic cytotoxicity of melatonin (MLT) and pterostilbene (Ptero) co-treatment (MLT+Ptero) in colon cancer cells. Cytotoxicity of MLT (A), Ptero (B), MLT with or without Ptero (C) in CCD-18Co. Cytotoxicity of MLT (D) or Ptero (E), HT29, SW480, and HCT116 cells by MTT assay. Three colon cancer cell lines were exposed to the indicated concentrations of MLT or Ptero for 24 h and then cell viability was analyzed by MTT assay. (F) Bar graphs indicate cytotoxicity of MLT and/or Ptero in three colon cancer cells by MTT assay. Data represent means ± SD from three separate experiments. (G) Combination index (CI) for cytotoxicity of MLT and Ptero was determined by Chou-Talalay method using the Calcusyn software.
Figure 2
Figure 2
Effect of MLT+Ptero on apoptosis-related proteins in colon cancer cells. HCT116, SW480, and HT29 colon cancer cells were exposed to MLT (0.5, 1 mM) and/or Ptero (20, 40 µM) for 24 h and then were subjected to Western blotting for PARP, cleaved caspse-3, Bcl-xL, NEDD9, SOX10, SOX9, and β-actin.
Figure 3
Figure 3
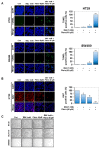
Effect of MLT+Ptero on TUNEL-positive cells, Ki67 expression, and reactive oxygen species (ROS) production in colon cancer cells. (A) Effect of MLT+Ptero on TUNEL-positive cells in HT29 and SW480 cells. HT29 and SW480 cells were exposed to MLT (1 mM) and/or Ptero (40 µM) for TUNEL staining. The fluorescent signals from fragmented DNA (green) and 4′,6-diamidino-2-phenylindole. (DAPI) (blue) were visualized and photographed by a FLUOVIEW FV10i confocal microscopy. Magnification bar = 50 µm. Bar graphs represent quantification of TUNEL-positive cells (%). Data represent means ± SEM of triplicate samples. * p < 0.05, *** p < 0.001 vs. untreated control. (B) Effect of MLT+Ptero on Ki67 expression in HT29 cells. Immunofluorescence staining of proliferation marker Ki67 in HT29 cells. Nuclei were stained by DAPI (blue) stain and anti-rabbit Alexa Fluor 546 (red). ** p < 0.01, *** p < 0.001 vs. untreated control by one-way ANOVA test. (C) Effect of MLT+Ptero on apoptotic morphological changes in HT29, SW480, and HCT116 cells. Following exposure to MLT and/or Ptero in three colon cancer cells for 24 h, apoptotic morphology of the cells was observed in the cells under phase contrast microscope. (D,E) Effect of MLT+Ptero on ROS production in HT29 or SW480 cells. HT29 or SW480 cells were treated with MLT (1 mM) and/or Ptero (40 μM) for 24 h and then 10 μM Dichloro-dihydro-fluorescein diacetate (DCFH-DA) for 30 min at 37 °C. Fluorescence intensity was measured by Dichloro-dihydro-fluorescein diacetate (FACS) Calibur. Bar graphs showed quantification of ROS generation. Data represent means ± SD. * p < 0.05 versus untreated control (n = 2, one-way ANOVA, Tukey’s test).
Figure 3
Figure 3
Effect of MLT+Ptero on TUNEL-positive cells, Ki67 expression, and reactive oxygen species (ROS) production in colon cancer cells. (A) Effect of MLT+Ptero on TUNEL-positive cells in HT29 and SW480 cells. HT29 and SW480 cells were exposed to MLT (1 mM) and/or Ptero (40 µM) for TUNEL staining. The fluorescent signals from fragmented DNA (green) and 4′,6-diamidino-2-phenylindole. (DAPI) (blue) were visualized and photographed by a FLUOVIEW FV10i confocal microscopy. Magnification bar = 50 µm. Bar graphs represent quantification of TUNEL-positive cells (%). Data represent means ± SEM of triplicate samples. * p < 0.05, *** p < 0.001 vs. untreated control. (B) Effect of MLT+Ptero on Ki67 expression in HT29 cells. Immunofluorescence staining of proliferation marker Ki67 in HT29 cells. Nuclei were stained by DAPI (blue) stain and anti-rabbit Alexa Fluor 546 (red). ** p < 0.01, *** p < 0.001 vs. untreated control by one-way ANOVA test. (C) Effect of MLT+Ptero on apoptotic morphological changes in HT29, SW480, and HCT116 cells. Following exposure to MLT and/or Ptero in three colon cancer cells for 24 h, apoptotic morphology of the cells was observed in the cells under phase contrast microscope. (D,E) Effect of MLT+Ptero on ROS production in HT29 or SW480 cells. HT29 or SW480 cells were treated with MLT (1 mM) and/or Ptero (40 μM) for 24 h and then 10 μM Dichloro-dihydro-fluorescein diacetate (DCFH-DA) for 30 min at 37 °C. Fluorescence intensity was measured by Dichloro-dihydro-fluorescein diacetate (FACS) Calibur. Bar graphs showed quantification of ROS generation. Data represent means ± SD. * p < 0.05 versus untreated control (n = 2, one-way ANOVA, Tukey’s test).
Figure 4
Figure 4
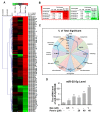
Differential profiles of microRNAs in HT29 cells treated with MLT and/or Ptero by microarray analysis. (A) Heat map and summary of microRNAs (miRNAs) enriched in MLT- (1 mM) and/or Ptero- (40 µM) treated HT29 cells. Red and green indicate upregulation and downregulation of miRNAs, respectively. (B) The miRNAs differentially upregulated by over 2 folds or downregulated by below 0.5 fold by MLT and Ptero co-treatment in HT29 cells. (C) Kyoto Encyclopedia of Genes and Genomes (KEGG) signaling pathways in MLT- and/or Ptero-treated HT29 cells. (D) Effect of MLT and/or Ptero treatment on miR-25-5p in HT29 cells by quantitative RT-PCR (qRT-PCR) analysis.
Figure 5
Figure 5
NEDD9 overexpression reversed the ability of MLT+Ptero to exert cytotoxicity, reduce NEDD9 expression, and induce cleavage of PARP and caspase 3 in colon cancer cells. (A) MLT+Ptero completely reduced fluorescence of GFP NEDD9 in HT29 cells transfected with NEDD overexpression plasmid. Stable expression of GFP NEDD was observed in HT29 cells transfected with NEDD9 overexpression plasmid under inverted fluorescence. Time-lapse microscopy images are the maximum intensity with projection of the z-stack in a time course. (B) Effect of MLT+Ptero on NEDD9, Pro-PARP, and cleaved caspase-3 in HT29 and SW480 cells. Cell lysates were prepared and subjected to Western blotting for NEDD9, Pro-PARP, and cleaved caspase-3 in HT29 and SW480 cells. (C) Effect of NEDD9 overexpression on the cytotoxicity of MLT+Ptero in HT29, SW480, and HCT116 cells. Three colon cancer cells were transfected with the pcDNA-3.1 vector or NEDD9 overexpression plasmid for 48h and exposed to the indicated concentrations of MLT (1 mM) and/or Ptero (40 μM) for 24 h. Cytotoxicity by MLT+Ptero was evaluated by MTT assay in NEDD9 overexpressed HT29, SW480, and HCT116 cells.
Figure 5
Figure 5
NEDD9 overexpression reversed the ability of MLT+Ptero to exert cytotoxicity, reduce NEDD9 expression, and induce cleavage of PARP and caspase 3 in colon cancer cells. (A) MLT+Ptero completely reduced fluorescence of GFP NEDD9 in HT29 cells transfected with NEDD overexpression plasmid. Stable expression of GFP NEDD was observed in HT29 cells transfected with NEDD9 overexpression plasmid under inverted fluorescence. Time-lapse microscopy images are the maximum intensity with projection of the z-stack in a time course. (B) Effect of MLT+Ptero on NEDD9, Pro-PARP, and cleaved caspase-3 in HT29 and SW480 cells. Cell lysates were prepared and subjected to Western blotting for NEDD9, Pro-PARP, and cleaved caspase-3 in HT29 and SW480 cells. (C) Effect of NEDD9 overexpression on the cytotoxicity of MLT+Ptero in HT29, SW480, and HCT116 cells. Three colon cancer cells were transfected with the pcDNA-3.1 vector or NEDD9 overexpression plasmid for 48h and exposed to the indicated concentrations of MLT (1 mM) and/or Ptero (40 μM) for 24 h. Cytotoxicity by MLT+Ptero was evaluated by MTT assay in NEDD9 overexpressed HT29, SW480, and HCT116 cells.
Figure 6
Figure 6
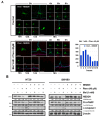
Critical role of miR-25-5p inhibitor in MLT+Ptero-treated colon cancer cells. (A) The binding sequences (red highlighted seed sequence) between 3′-UTR NEDD9 and hsa-miR-25-5p target genes by using miRWalk software. (B) Effect of miR-25-5p inhibitor on NEDD9 or SOX10 expression in MLT+Ptero-treated HT29 and SW480 cells. Expression levels of NEDD9 and SOX10 were analyzed by a Delta Vision Imaging System (Applied Precision). The nuclei were stained with DAPI (scale bar, 15 μm). (C) Effect of MLT+Ptero on NEDD9 in HT29 cells by qRT-PCR. After MLT+Ptero co-treatment for 24 h in HT29 cells, qRT-PCR was performed with total RNA isolated from HT29 cells. ** p < 0.01, *** p < 0.001 vs. miRNA inhibitor negative control. Data represent means ± SEM of triplicate samples.
Figure 6
Figure 6
Critical role of miR-25-5p inhibitor in MLT+Ptero-treated colon cancer cells. (A) The binding sequences (red highlighted seed sequence) between 3′-UTR NEDD9 and hsa-miR-25-5p target genes by using miRWalk software. (B) Effect of miR-25-5p inhibitor on NEDD9 or SOX10 expression in MLT+Ptero-treated HT29 and SW480 cells. Expression levels of NEDD9 and SOX10 were analyzed by a Delta Vision Imaging System (Applied Precision). The nuclei were stained with DAPI (scale bar, 15 μm). (C) Effect of MLT+Ptero on NEDD9 in HT29 cells by qRT-PCR. After MLT+Ptero co-treatment for 24 h in HT29 cells, qRT-PCR was performed with total RNA isolated from HT29 cells. ** p < 0.01, *** p < 0.001 vs. miRNA inhibitor negative control. Data represent means ± SEM of triplicate samples.
Figure 7
Figure 7
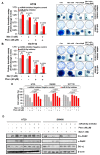
Effect of miR-25-5p inhibitor on colony formation, cell viability, and apoptosis-related proteins in MLT- and/or Ptero-treated colon cancer cells. Effect of miR-25-5p inhibitor on the colony formation of HT29 (A) and HCT116 (B) cells treated with MLT (1mM) and/or Ptero (40µM). Colony formation assay was conducted in HT29 and HCT116 cells transfected with miR-25-5p inhibitor plasmid compared to intact control cells for 2 weeks. (C) Effect of miR-25-5p inhibitor on the cytotoxicity of MLT+Ptero in HT29, SW480, and HCT116 cells. The miRNA inhibitor control and miR-25-5p inhibitor plasmids were transfected into three colon cancer cells for 48h and then exposed to MLT and/or Ptero for 24 h. Cell viability was determined by MTT assay. ** p < 0.01, *** p < 0.001 vs. miRNA inhibitor negative control. Data represent means ± SEM of triplicate samples. (D) Effect of miR-25-5p inhibitor on PARP cleavage and Bcl-xL in HT29 and SW480 cells treated with MLT and/or Ptero.

Similar articles

Cited by

References

    1. Reiter R.J. Pineal MLT: Cell biology of its synthesis and of its physiological interactions. Endocr. Rev. 1991;12:151–180. doi: 10.1210/edrv-12-2-151. - DOI - PubMed
    1. Reiter R.J., Paredes S.D., Manchester L.C., Tan D.X. Reducing oxidative/nitrosative stress: A newly-discovered genre for MLT. Crit. Rev. Biochem. Mol. Biol. 2009;44:175–200. doi: 10.1080/10409230903044914. - DOI - PubMed
    1. Acuna-Castroviejo D., Escames G., Venegas C., Diaz-Casado M.E., Lima-Cabello E., Lopez L.C., Rosales-Corral S., Tan D.X., Reiter R.J. Extrapineal MLT: Sources, regulation, and potential functions. Cell Mol. Life Sci. 2014;71:2997–3025. doi: 10.1007/s00018-014-1579-2. - DOI - PMC - PubMed
    1. Blask D.E., Wilson S.T., Zalatan F. Physiological MLT inhibition of human breast cancer cell growth in vitro: Evidence for a glutathione-mediated pathway. Cancer Res. 1997;57:1909–1914. - PubMed
    1. Sanchez-Barcelo E.J., Cos S., Mediavilla D., Martinez-Campa C., Gonzalez A., Alonso-Gonzalez C. MLT-estrogen interactions in breast cancer. J. Pineal. Res. 2005;38:217–222. doi: 10.1111/j.1600-079X.2004.00207.x. - DOI - PubMed