. 2019 Jul 28;9(19):5497-5516.
doi: 10.7150/thno.33800. eCollection 2019.

The miR-26a/AP-2α/Nanog signaling axis mediates stem cell self-renewal and temozolomide resistance in glioma

Affiliations

The miR-26a/AP-2α/Nanog signaling axis mediates stem cell self-renewal and temozolomide resistance in glioma

Wenhuan Huang et al. Theranostics. .

Abstract

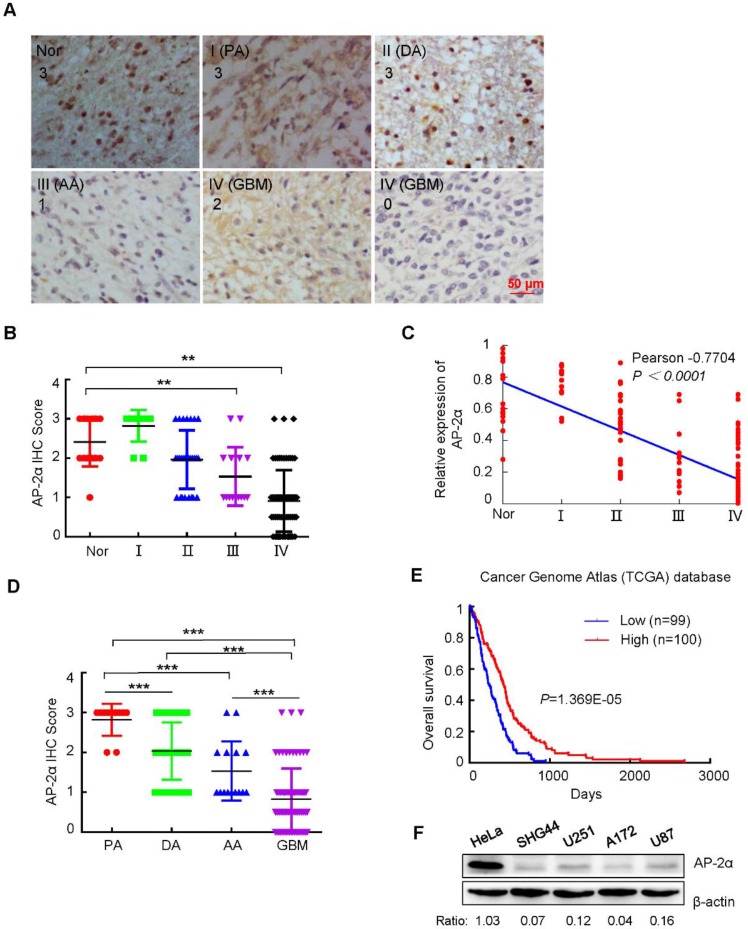
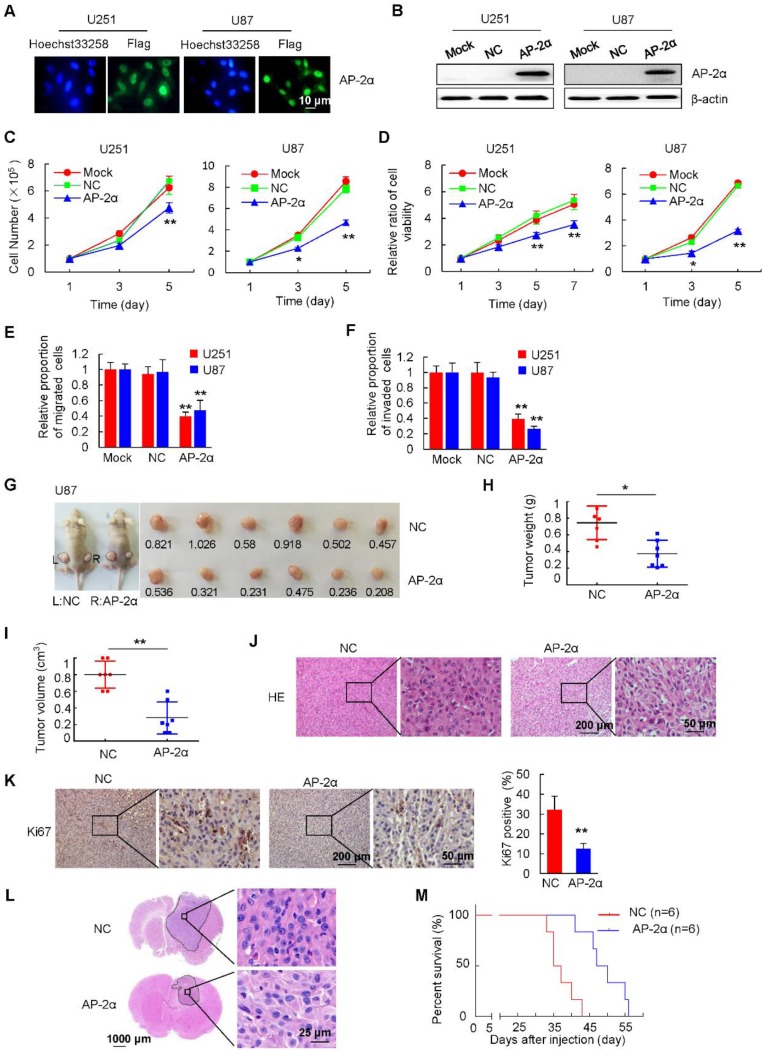
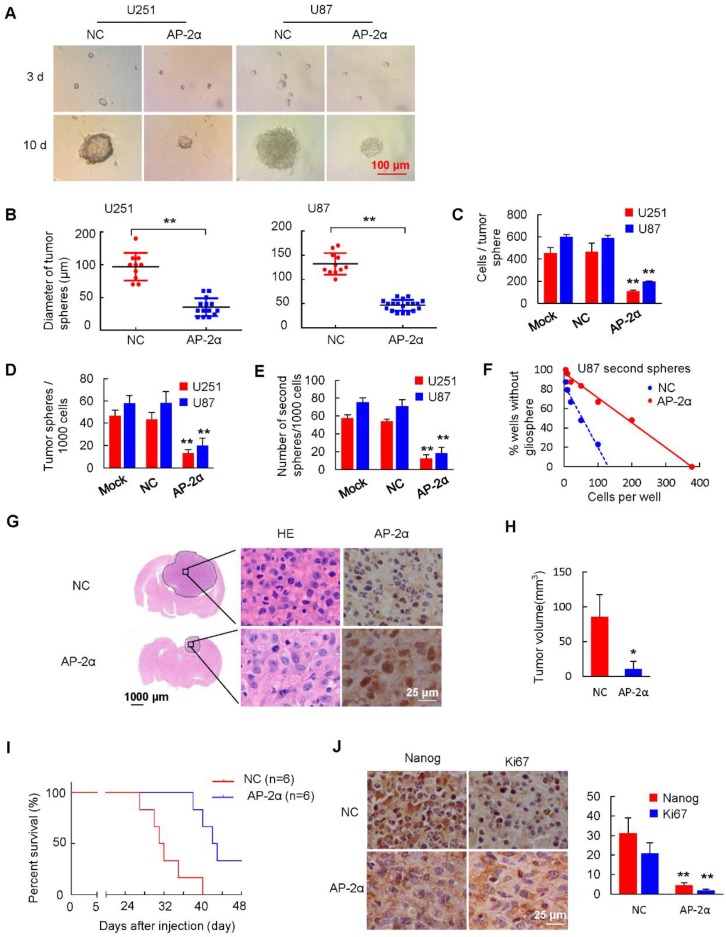
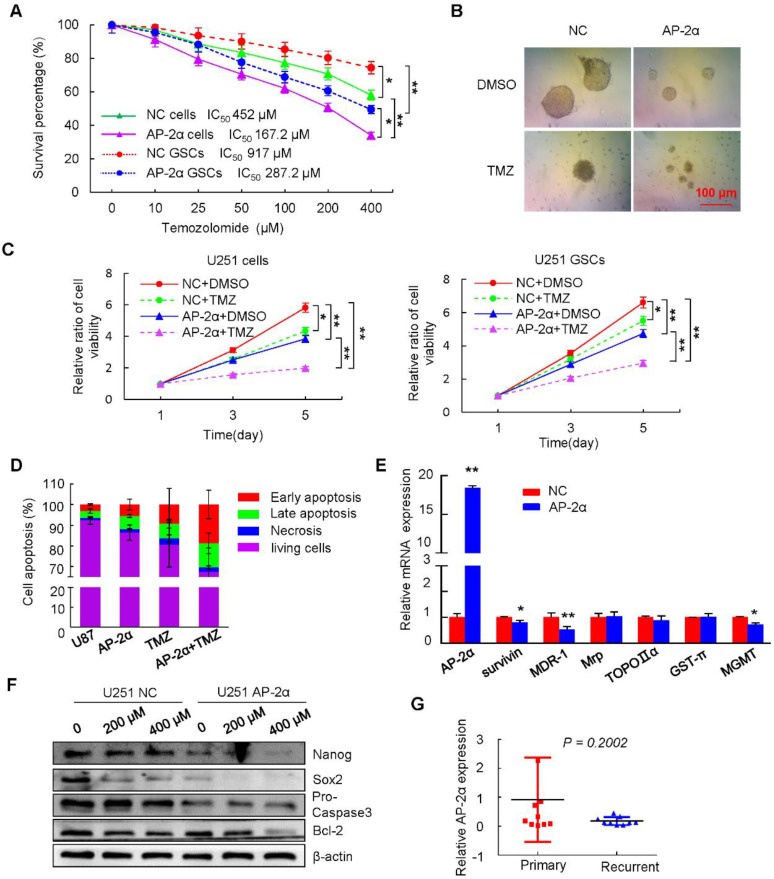
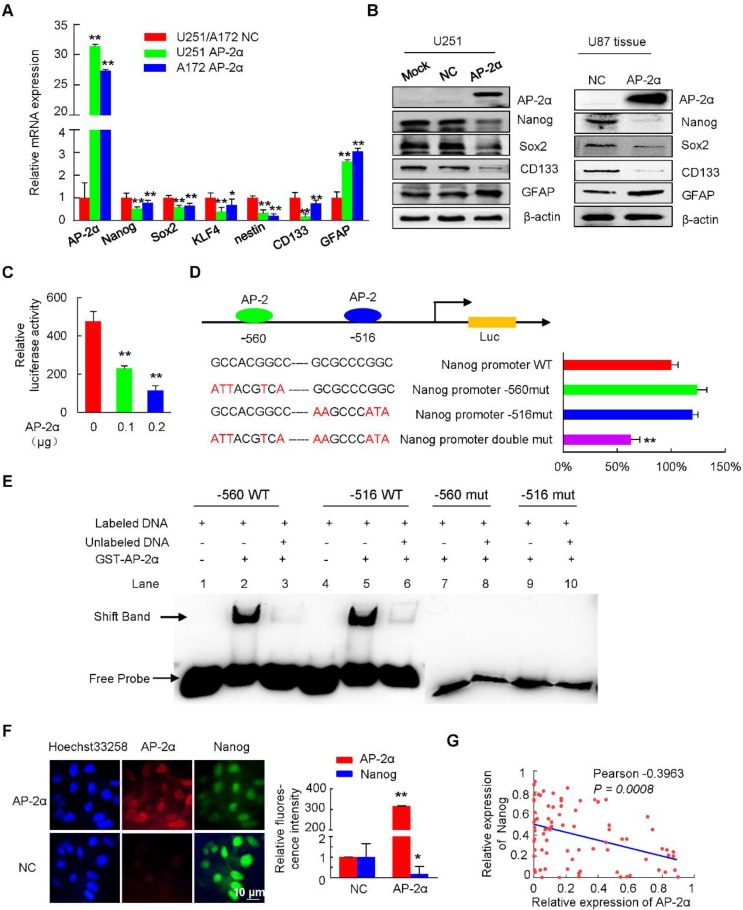
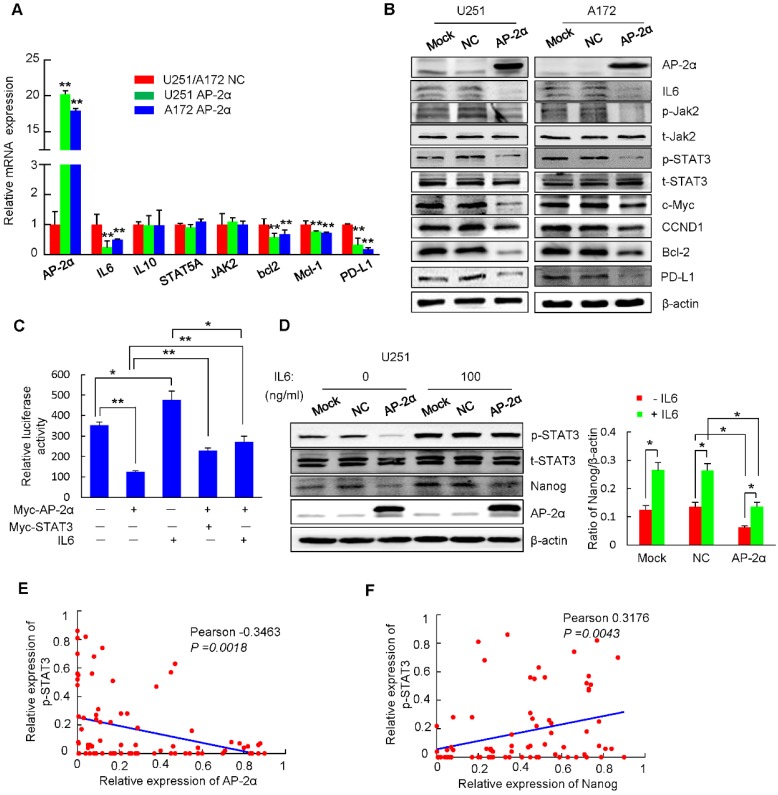
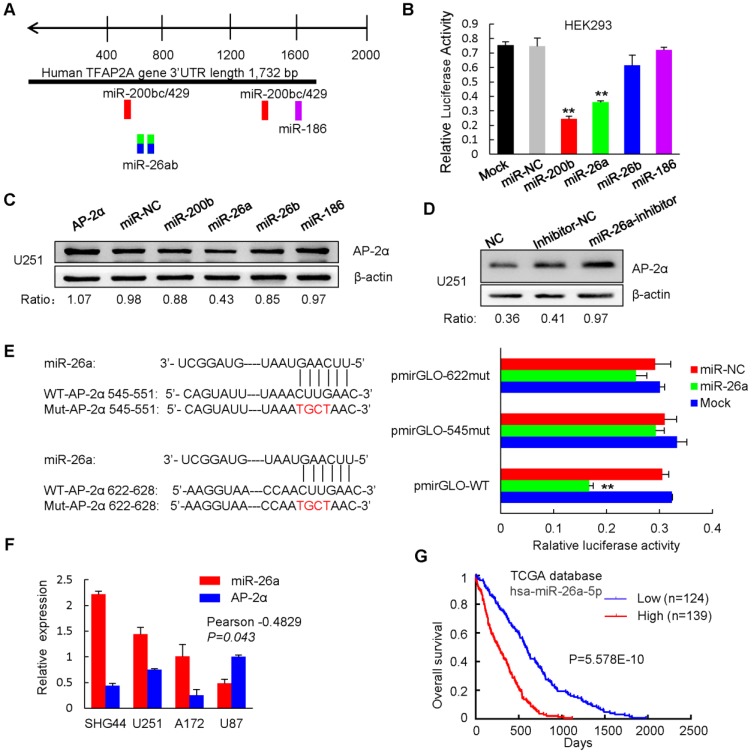
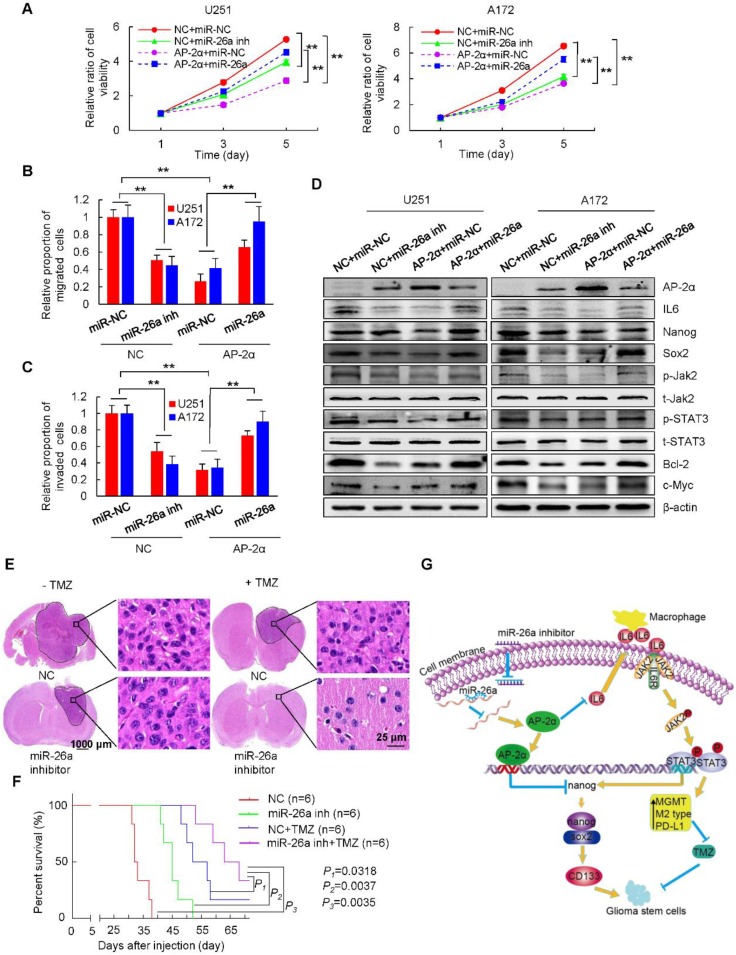
Aberrant expression of transcription factor AP-2α has been functionally associated with various cancers, but its clinical significance and molecular mechanisms in human glioma are largely elusive. Methods: AP-2α expression was analyzed in human glioma tissues by immunohistochemistry (IHC) and in glioma cell lines by Western blot. The effects of AP-2α on glioma cell proliferation, migration, invasion and tumor formation were evaluated by the 3-(4,5-dimethyNCthiazol-2-yl)-25-diphenyltetrazolium bromide (MTT) and transwell assays in vitro and in nude mouse models in vivo. The influence of AP-2α on glioma cell stemness was analyzed by sphere-formation, self-renewal and limiting dilution assays in vitro and in intracranial mouse models in vivo. The effects of AP-2α on temozolomide (TMZ) resistance were detected by the MTT assay, cell apoptosis, real-time PCR analysis, western blotting and mouse experiments. The correlation between AP-2α expression and the expression of miR-26a, Nanog was determined by luciferase reporter assays, electrophoretic mobility shift assay (EMSA) and expression analysis. Results: AP-2α expression was downregulated in 58.5% of glioma tissues and in 4 glioma cell lines. AP-2α overexpression not only reduced the proliferation, migration and invasion of glioma cell lines but also suppressed the sphere-formation and self-renewal abilities of glioma stem cells in vitro. Moreover, AP-2α overexpression inhibited subcutaneous and intracranial xenograft tumor growth in vivo. Furthermore, AP-2α enhanced the sensitivity of glioma cells to TMZ. Finally, AP-2α directly bound to the regulatory region of the Nanog gene, reduced Nanog, Sox2 and CD133 expression. Meanwhile, AP-2α indirectly downregulated Nanog expression by inhibiting the interleukin 6/janus kinase 2/signal transducer and activator of transcription 3 (IL6/JAK2/STAT3) signaling pathway, consequently decreasing O6-methylguanine methyltransferase (MGMT) and programmed death-ligand 1 (PD-L1) expression. In addition, miR-26a decreased AP-2α expression by binding to the 3' untranslated region (UTR) of AP-2α and reversed the tumor suppressive role of AP-2α in glioma, which was rescued by a miR-26a inhibitor. TMZ and the miR-26a inhibitor synergistically suppressed intracranial GSC growth. Conclusion: These results suggest that AP-2α reduces the stemness and TMZ resistance of glioma by inhibiting the Nanog/Sox2/CD133 axis and IL6/STAT3 signaling pathways. Therefore, AP-2α and miR-26a inhibition might represent a new target for developing new therapeutic strategies in TMZ resistance and recurrent glioma patients.

Keywords: AP-2α; Nanog; STAT3; TMZ resistance; glioblastoma stem cells (GSCs); glioma; miR-26a.


Conflict of interest statement

Competing Interests: The authors have declared that no competing interest exists.

Figures

Figure 1
Figure 1
The expression levels of AP-2α in glioma tissues and cell lines. (A) AP-2α expression was examined by immunohistochemical analysis in 130 glioma tissues and 17 adjacent normal tissues. Strong nucleic expression of AP-2α (brown staining) was detected in normal tissues and stage I/II glioma cells, and the nucleus was stained blue with hematoxylin. The staining intensity was scored with grades 0-3. Nor, Normal; PA, pilocytic astrocytoma; DA, diffuse astrocytoma; AA, anaplastic astrocytoma; GBM, glioblastoma multiform. (B) Immunohistochemical scores of glioma and normal tissues stained with monoclonal anti-AP-2α antibody. Each symbol represents an individual sample. Statistical comparisons of AP-2α expression between glioma and normal tissues were performed according to the SPSS software. **, p<0.01. (C) The correlation of AP-2α expression and glioma grade was analyzed by Graphpad Prism. (D) Immunohistochemical scores of AP-2α expression in various histological types of glioma. ***, p<0.001. (E) The correlation of AP-2α expression and overall survival of glioma patients was determined from the Cancer Genome Atlas (TCGA) data. n: sample number. (F) AP-2α expression in glioma cell lines was detected by Western blotting. Relative AP-2α expression was quantified by Image J software using β-actin as an internal control.
Figure 2
Figure 2
Effects of AP-2α overexpression on glioma progression in vitro and in vivo. (A) Immunofluorescence staining of Flag-AP-2α overexpression in lentiviral-infected glioma cells. (B) Flag-AP-2α expression in glioma cells was detected by Western blot using anti-Flag antibodies. β-actin was served as a loading control. (C) Cell survival assays of lentiviral-infected glioma cells and parental cells. Cells (100,000) were plated into 6-well plates in triplicate, grown in DMEM with 10% FBS for 1-5 days, cell numbers were counted with a hemocytometer. (D) MTT assays of lentiviral-infected glioma cells and parental cells. Cells (5,000) were plated in octuplicate in 48-well plates and grown in DMEM with 10% FBS. The absorbance at 490 nm was analyzed for 1, 3, 5 and 7 days. (E) Effect of AP-2α overexpression on cell migration as determined by transwell assays. Examples of cells migrated through the PET-membrane (pore size: 8 μm) and relative migration proportion of cells are shown. The proportion of migrated cells is based on total number of cells at the end of the assay relative to initial number of cells, which was set to 1 in the Mock group. (F) Effect of AP-2α overexpression on cell invasion through Matrigel matrix. Examples of cells migrated through Matrigel-coated transwell inserts and relative invasion proportion of cells are shown. The proportion of invaded cells is based on total number of cells at the end of the assay relative to initial number of cells, which was set to 1 in the Mock group. (G) AP-2α overexpression decreased the proliferation of U87 cells in vivo. About 2×10⁷ of lentivirus-infected cells were injected subcutaneously into the left and right back of female nude mice (BALb/c) (n =6 per group). After 25 days, tumors were excised, photographed, and measured. The weight and volume of the tumors excised (H and I) are mean ± SD in three independent experiments. (J) H&E staining was performed on serial sections of mouse tumors generated from glioma cells. (K) IHC analysis of Ki67 expression and quantification of Ki67-positive cells in mouse tumors are shown. (L) U87 cells (5×10⁵) were injected stereotactically into the brain of BALB/c nude mice using a 5 μL Hamilton syringe. Cell were injected in the middle of the craniotomy open window to a depth of 3 mm. H&E staining of brain tissues from the control and AP-2α overexpressing groups was shown. (M) Kaplan-Meier survival curves of nude mice bearing intracranial tumors of U87 cells in control group and AP-2α overexpressing group. n: mice number. These data represent at least three independent experiments with similar results. *, p<0.05, **, p<0.01, compared with controls. NC, negative control.
Figure 3
Figure 3
AP-2α overexpression attenuates the self-renewal ability of GSCs. Representative images (A) and diameter (B) of spheroid cells are shown. (C) Quantification of cell numbers per spheroid. Tumor spheres were collected and dissociated with trypsin for single cell suspension. (D) Evaluation of the number of spheres from 1000 cells. The number of primary spheres formed on day 9 is shown. (E) Evaluation of the number of secondary spheres from 1000 cells. Primary tumor spheres were dissociated, replated, and cultured. The number of secondary tumor spheres was quantified after 7 days. (F) Tumor sphere formation was measured through a limiting dilution assay. Cells from U87 secondary spheres were plated at 200, 100, 50, 20, 10, or 5 cells/well and cultured in stem cell-conditioned medium (n=48 wells/condition, p = 0.012). (G) U87 sphere cells (3×10⁵) were injected stereotactically into the brain of athymic mice (BALB/c nu/nu) using a 5 μL Hamilton syringe. H&E staining of brain tissues from the control and AP-2α overexpression groups and IHC analysis of AP-2α expression in mouse brain tissues were performed. (H) The volume of the intracranial tumors was measured and indicated as mean ± SD. (I) Kaplan-Meier survival curves of nude mice bearing intracranial tumors of U87 sphere cells in control group and AP-2α overexpression group. n: sample number. (J) IHC analysis of Nanog and Ki67 expression in mouse brain tissues was performed. All data are presented as the mean ± SD of three independent experiments. *, P < 0.05, **, p<0.01, compared with the NC group.
Figure 4
Figure 4
AP-2α increases the sensitivity of glioma cells to TMZ. (A) The survival percentage was determined by MTT assays at 490 nm. U251 cells or U251 GSCs stably expressing NC or AP-2α were exposed to TMZ over the range of 0-400 μM for 48 h followed by cell viability analysis. (B) Gliosphere formation assays were performed on AP-2α-overexpressing U251 cells exposed to 200 μM of TMZ or DMSO for 10 days. (C) MTT assays of the effects of TMZ on glioma cells and GSCs at different time points. U251 cells or U251 GSCs with NC or AP-2α expression were treated with 200 μM of TMZ or DMSO for the indicated time, cell viability was analyzed by MTT assays. (D) Cell apoptosis assays were performed by FACS analysis. The control and AP-2α-infected cells were treated with 400 μM of TMZ or DMSO for 48 h, cell apoptosis was then evaluated using flow cytometry. All results are expressed as the mean ± SD of three independent experiments. (E) qRT-PCR analysis of the effects of AP-2α on the expression of these resistance genes in U251 cells. (F) Western blots were performed to detect the effect of TMZ on protein levels of AP-2α downstream genes in U251 cells. (G) qRT-PCR analysis of AP-2α expression in 9 primary and recurrent glioma samples. *, P < 0.05, **, p<0.01.
Figure 5
Figure 5
AP-2α inhibits Nanog expression. (A) qRT-PCR was performed to elucidate the effect of AP-2α on the expression of stem cell markers. The relative expression of each gene in the U251 AP-2α and A172 AP-2α groups was normalized to that in the U251 NC and A172 NC groups, which were set to 1 as the control. (B) Western blots were performed to detect the expression of stem cell markers in AP-2α-overexpressing U251 cells (left) and subcutaneous mouse tumor tissues from U87 cells (right). (C, D) Luciferase assays were performed to detect the effects of AP-2α on the transcriptional activities of Nanog regulatory regions, including wild-type and mutated AP-2 binding sites. (C) Luciferase activity was normalized to β-galactosidase activity and the results were presented as the mean ± SD of three independent transfection experiments in triplicate. (D) Data are presented as the fold change relative to Nanog wild-type reporter activity inhibited by AP-2α, which is considered 100%. (E) Electrophoretic gel mobility shift assays of AP-2α direct binding to the Nanog regulatory region in vitro. GST-AP-2α fusion protein was incubated with biotin-labeled AP-2 binding oligonucleotides from Nanog regulatory region. Shift band indicates protein-DNA complexes. (F) Immunofluorescent staining confirmed the decreased expression of Nanog in AP-2α-overexpressing U251 cells. Relative fluorescence intensity was quantified using ImageJ software. (G) The correlation of AP-2α and Nanog expression in glioma tissues was analyzed using GraphPad Prism. WT, wild-type. *, p<0.05, **, p<0.01, compared with controls.
Figure 6
Figure 6
AP-2α inhibits the IL6/STAT3 signaling pathway. (A) qRT-PCR was performed to elucidate the effect of AP-2α on the expression of STAT3 signaling pathway-related genes. The relative expression levels of individual genes in the U251 AP-2α and A172 AP-2α groups were normalized to those in the U251 NC and A172 NC groups, which were set to 1 as the controls. (B) Western blots were performed to detect the expression of STAT3 signaling pathway members and STAT3 downstream genes in AP-2α-overexpressing glioma cells. (C) Luciferase assays were performed to detect the effects of AP-2α on the transcriptional activity of Nanog regulatory regions with or without 100 ng/mL IL6 stimulation for 8 h. Relative luciferase activity was presented as the mean ± SD of three independent transfection experiments in triplicate. (D) Western blots were used to detect the expression of STAT3 and Nanog in U251 cells treated or untreated with IL6 for 8 h. Relative Nanog expression was quantified by Image J software using β-actin as an internal control. (E) The correlation of AP-2α and p-STAT3 expression in glioma tissues was analyzed using GraphPad Prism. (F) The correlation of Nanog and p-STAT3 expression in glioma tissues was analyzed using GraphPad Prism. *, p<0.05, **, p<0.01, compared with controls.
Figure 7
Figure 7
miR-26a targets AP-2α by binding to its 3' UTR. (A) Putative binding sites of miR-26a in the AP-2α 3'-UTR region analyzed by TargetScan. (B) miR-26a regulates the luciferase activity of the AP-2α 3'-UTR in HEK293 cells. Relative firefly luciferase reporter activity was significantly reduced when pmirGLO-AP-2α vector was cotransfected together with miR-26a mimics. Firefly luciferase activity was normalized based on Renilla luciferase activity. (C, D) Western blot analysis of AP-2α expression in miR-26a transfected AP-2α-overexpressing U251 cell line (C) and miR-26a inhibitor transfected U251 NC cells (D). U251 cells were collected 48 h after miRNA transfection. AP-2α expression was quantified by Image J software using β-actin as an internal control. (E) AP-2α 3'-UTRs with wild-type or mutated miR-26a binding sites were cotransfected with miR-26a mimics. The luciferase activity was detected. Statistical analysis was performed using SPSS software. **, p<0.01. (F) qRT-PCR analysis of the expression of miR-26a in glioma cell lines. The correlation between miR-26a expression and AP-2α expression in glioma cell lines was shown. (G) The correlation of miR-26a expression and overall survival of glioma patients was determined from The Cancer Genome Atlas (TCGA) data. n, sample number.
Figure 8
Figure 8
miR-26a reverses the inhibitory effects of AP-2α on glioma cells. (A) Glioma cells were infected with lentiviruses to overexpress AP-2α, antisense miR-26a inhibitor (miR-26a inh) or in combination with miR-26a mimics and AP-2α, and cell viability was analyzed by MTT assays. (B, C) Glioma cells overexpressing AP-2α or miR-26a inhibitor or with miR-26a mimics and AP-2α in combination were subjected to transwell migration and invasion assays. (D) Western blots were performed to detect the effect of miR-26a on the expression of AP-2α downstream genes in glioma cell lines. (E) U87 GSCs (3×10⁵) were injected stereotactically into the brain of BALB/c nude mice. H&E staining of brain tissues was shown in four groups, including the control, miR-26a inhibitor group, TMZ group and both miR-26a inhibitor and TMZ group. The volume of the intracranial tumors was measured as mean ± SD. (F) Kaplan-Meier survival curves of nude mice bearing intracranial tumors of U87 GSCs in four groups. All data are presented as the mean ± SD of three independent experiments. **, p<0.01, compared with the control group. (G) Schematic presentation of the mechanism underlying AP-2α-suppressed glioma stemness and TMZ resistance.

Similar articles

Cited by

References

    1. Jue TR, Mcdonald KL. The challenges associated with molecular targeted therapies for glioblastoma. J Neurooncol. 2016;127:427–434. - PubMed
    1. McNamara MG, Lwin Z, Jiang H, Chung C, Millar BA, Sahgal A. et al. Conditional probability of survival and post-progression survival in patients with glioblastoma in the temozolomide treatment era. J Neurooncol. 2014;117:153–160. - PubMed
    1. Fan CH, Liu WL, Cao H, Wen C, Chen L, Jiang G. O6-methylguanine DNA methyltransferase as a promising target for the treatment of temozolomide-resistant gliomas. Cell Death Dis. 2013;4:e876. - PMC - PubMed
    1. Auffinger B, Spencer D, Pytel P, Ahmed AU, Lesniak MS. The role of glioma stem cells in chemotherapy resistance and glioblastoma multiforme recurrence. Expert Rev Neurother. 2015;15:741–752. - PMC - PubMed
    1. Bradshaw A, Wickremesekera A, Brasch HD, Chibnall AM, Davis PF, Tan ST. et al. Cancer Stem Cells in Glioblastoma Multiforme. Front Surg. 2016;3:48. - PMC - PubMed

Publication types

MeSH terms