. 2019 Sep;573(7774):430-433.
doi: 10.1038/s41586-019-1546-z. Epub 2019 Sep 11.

Targeting cardiac fibrosis with engineered T cells

Affiliations

Targeting cardiac fibrosis with engineered T cells

Haig Aghajanian et al. Nature. 2019 Sep.

Erratum in

  • Author Correction: Targeting cardiac fibrosis with engineered T cells.
    Aghajanian H, Kimura T, Rurik JG, Hancock AS, Leibowitz MS, Li L, Scholler J, Monslow J, Lo A, Han W, Wang T, Bedi K, Morley MP, Saldana RAL, Bolar NA, McDaid K, Assenmacher CA, Smith CL, Wirth D, June CH, Margulies KB, Jain R, Puré E, Albelda SM, Epstein JA. Aghajanian H, et al. Nature. 2019 Dec;576(7785):E2. doi: 10.1038/s41586-019-1761-7. Nature. 2019. PMID: 31723271

Abstract

Fibrosis is observed in nearly every form of myocardial disease1. Upon injury, cardiac fibroblasts in the heart begin to remodel the myocardium by depositing excess extracellular matrix, resulting in increased stiffness and reduced compliance of the tissue. Excessive cardiac fibrosis is an important factor in the progression of various forms of cardiac disease and heart failure2. However, clinical interventions and therapies that target fibrosis remain limited3. Here we demonstrate the efficacy of redirected T cell immunotherapy to specifically target pathological cardiac fibrosis in mice. We find that cardiac fibroblasts that express a xenogeneic antigen can be effectively targeted and ablated by adoptive transfer of antigen-specific CD8+ T cells. Through expression analysis of the gene signatures of cardiac fibroblasts obtained from healthy and diseased human hearts, we identify an endogenous target of cardiac fibroblasts-fibroblast activation protein. Adoptive transfer of T cells that express a chimeric antigen receptor against fibroblast activation protein results in a significant reduction in cardiac fibrosis and restoration of function after injury in mice. These results provide proof-of-principle for the development of immunotherapeutic drugs for the treatment of cardiac disease.


Figures
Extended Data Fig. 1.
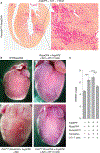
Cardiac fibrosis and hypertrophy. (a) Pircro-Sirius Red staining for cardiac fibrosis (red) in a heart coronal section from a PeriostinMCM;RosaOVA mouse treated with AngII/PE and tamoxifen for 1 week. High powered field of left ventricular free-wall (right). Representative image of 3 biologically independent animals with similar results. (b) Control and experimental hearts were measured (weight, mg) and images captured. (c) Quantification of heart weight to body weight (HW/BW) ratio of indicated genotypes and conditions (mean ± SEM). ****P < 0.0001 (one-way ANOVA between groups P < 0.0001; post-hoc multiple comparisons, Tukey’s test, n = 10, 7, 6, 8 biologically independent animals, respectively). Scale bars = 100μm.
Extended Data Fig. 2.
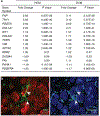
Markers of activated cardiac fibroblasts in human disease. (a) Fold change and P values of cardiac fibroblast-specific gene expression from patients with hypertrophic cardiomyopathy (HCM) and dilated cardiomyopathy (DCM) as compared with non-failing hearts. (n = 122 (non-failing), 27 (HCM), 89 (DCM)) Differential gene expression was performed using a linear model. (b) Immunohistochemistry co-staining cardiac Troponin (red) and FAP (green; left) and Vimentin (green; right) in adjacent sections from the left ventricle of a human patient with cardiomyopathy. FAP and Vimentin are seen on the same fibroblasts (arrowheads). Representative image of 2 independent experiments with similar results. HCM= Hypertrophic cardiomyopathy, DCM = Dilated cardiomyopathy. Scale bars = 100μm.
Extended Data Fig. 3.
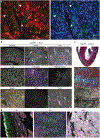
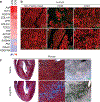
Fap is expression in mouse cardiac fibroblasts after injury. (a) Immunohistochemistry co-staining cardiac Troponin (red) and FAP (green; left) and Vimentin (green; right) in adjacent sections from the left ventricle of a mouse treated with AngII/PE for 2 weeks. Fap and Vimentin are seen on the same fibroblasts (arrowheads). Representative images from 2 independent experiments with similar results (n=7 biologically independent animals). (b) Immunohistochemistry for Fap (green) in various organs/tissues after 1 week of AngII/PE treatment. Representative image of 3 biologically independent animals with similar results. (c) Masson’s trichrome stain for fibrosis (blue; top, center) and immunohistochemistry for Fap (green; bottom) in WT coronal heart sections 2 week after continuous AngII/PE treatment. Staining and immunohistochemistry performed in adjacent sections. Bottom insets: higher magnification of left ventricular free-wall. Representative image from 2 independent experiments with similar results (n=7 biologically independent animals). (d) Immunohistochemistry for Fap (green) in mouse models of cardiac injury. MI: myocardial infarction, TAC: transverse aortic constriction, DMD: Duchenne’s muscular dystrophy (mdx/mTRKO G2 mice). Scale bars = 100μm.
Extended Data Fig. 4.
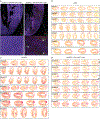
FAP CAR T cells infiltrate the heart and reduce cardiac fibrosis. (a) Immunohistochemistry for Fap (red) and GFP (green) on the left ventricular free wall of mouse heart coronal sections. WT C57Bl/6 mice were treated with (right) or without (left) AngII/PE for 1 week, injected with FAP-GFP CAR T cells and sacrificed 1 day later. FAP-GFP CAR T cells co-localize with FAP expressing cells (arrowheads, bottom). (b-d) Picro-Sirus Red staining of hearts from 21 individual mice (#1–21) treated for 4 weeks with either saline (b), AngII/PE (c), or AngII/PE + FAP CAR T cells (d) to assess for fibrosis (red). Representative images of 2 independent experiments with similar results. Scale bars = 100μm.
Extended Data Fig. 5.
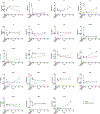
Echocardiography after injury and treatment. Results from echocardiogram examination of C57Bl/6 mice treated for 4 weeks with either saline, AngII/PE, or AngII/PE + FAP CAR T cells. (n = 12, 10, and 7 biologically independent animals, respectively) FS = Fractional shortening; HR = heart rate; BW = body weight; LVAEpid = Left ventricular epicardial area (diastole); LVAENDd = Left ventricular endocardial area (diastole); LVAENDs = Left ventricular endocardial area (systole); LVLd = Left ventricular endocardial length (diastole); LVLs = Left ventricular endocardial length (systole); EDV = End diastolic volume; ESV = End systolic volume; SV = Stroke volume; CO = Cardiac output; IVSd = Interventricular septal end diastole; IVSs = Interventricular septal end systole; LVIDd = Left ventricular internal diameter end diastole; LVIDs = Left ventricular internal diameter end systole; MV E = Early ventricular filling velocity; E/E’ = ratio of mitral peak velocity of early filling (E) to early diastolic mitral annular velocity (E’). All graphs display mean ± SEM.
Extended Data Fig. 6.
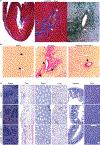
FAP CAR T treatment does not affect perivascular fibrosis or other organs. (a) Masson’s trichrome stain (blue; left, center) and FAP immunohistochemistry (green; right) on adjacent heart coronal sections 1 week after commencement of continuous AngII/PE treatment. FAP expression in present in interstitial, but not perivascular fibroblast (white arrowheads). Centered on vessel from Fig. 2c. Representative images of 2 independent experiments with similar results. (b) Picro-Sirius Red staining for perivascular fibrosis (black arrowheads, red) on heart coronal sections from mice treated for 4 weeks with either saline, AngII/PE, or AngII/PE + FAP CAR T cells. Representative images of 2 independent experiments with similar results. (c) H&E staining of various tissue sections from mice treated for 4 weeks with either saline, AngII/PE, or AngII/PE + FAP CAR T cells. Representative images of 3 independent experiments with similar results. Scale bars = 100μm.
Extended Data Fig. 7.
Long term serum cytokine levels after FAP CAR T cell treatment. Serum cytokine levels in mice treated with either AngII/PE or AngII/PE + FAP CAR T cells over 12 weeks. FAP CAR T cells were injected at 1 and 2 weeks as indicated. Levels were assessed at 10 days, 2 weeks, 4 weeks, and 12 weeks. Basal levels were determined by the average cytokine levels of 3 untreated mice. Infg and il-4 were below the detection limit in all conditions. *P = 0.019, #P = 0.035, †P = 0.045 (Two-tailed unpaired t-test, n=3 biologically independent animals per condition).
Extended Data Fig. 8.
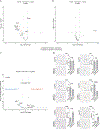
Cardiotoxicity, inflammation, and immune assessments after FAP CAR T cell transfer. (a) Volcano plot showing the differential expression of genes known to be modified in cardiotoxicity in the hearts of mice treated with either AngII/PE + FAP CAR T cells or a saline control at 4 weeks. Statistically significant changes are marked to indicate if genes are expected to increase (orange) or decrease (blue) in the setting of cardiotoxicity. (b) Differential expression of the same conditions in (a) at 8 weeks. (a, b – Welch’s two-sided test, n=3 biologically independent animals per condition) (c) Volcano plot showing the differential expression of 1659 immune- and inflammation-related genes from hearts of mice treated with AngII/PE +FAP CAR T cells or AngII/PE at 4 weeks. 22 genes were differentially expressed between the conditions. (n = 3 mice per condition) (d) Photomicrographs and quantification (mean ± SEM) of immune cell (arrowheads) residency of the left ventricle at 4 weeks with either AngII/PE or AngII/PE + FAP CAR T cell treatment. (Two-tailed unpaired t-test, n = 3, 4 biologically independent animals, respectively). Scale bars = 100μm.
Extended Data Fig. 9.
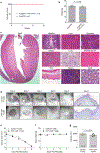
Assessment of safety and toxicity following FAP CAR T cell transfer. (a) Kaplan-Meier survival curve of mice either treated with AngII/PE or AngII/PE + FAP CAR T cells out to 12 weeks. (b) Body weight measurements at 12 weeks. (Two-tailed unpaired t-test) (c) H&E of sections of heart and organs/tissue at 12 weeks from a mouse treated with AngII/PE + FAP CAR T cells. Representative images of 3 independent animals with similar results. Scale bars = 100μm. (d) Photomicrographs and H&E sections of a healing wound over 8 days in mice treated with either FAP CAR or control T cells immediately and 3 days after wounding. (e) Quantification of wound area and measurements of body weight (f). (g) Serum levels of amylase at day 8 to test pancreatic toxicity. Scale bars = 1mm (wounds) and 250μm (H&E sections). All graphs display mean ± SEM.
Fig. 1.
Fig. 1.
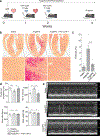
Redirected T cell can ablate cardiac fibroblasts. (a) Schematic representation of cardiac injury and T cell mediated cardiac fibroblast ablation. Mice were continuously administered angiotensin II and phenylephrine via osmotic pump to induce cardiac injury and fibrosis, and injected with tamoxifen to trigger Cre-mediated OVA expression in the CFs. CD8+ OT-I T cells were adoptively transferred 1 week after pump implantation when fibrosis was already established, and mice were sacrificed 4 weeks post-implantation for analysis. (b) Picro-Sirius Red staining of heart coronal sections to evaluate the level of fibrosis (red). Higher magnification of left ventricular fibrosis (bottom). (c) Quantification of ventricular fibrosis (mean ± SEM). *P = 0.0492, #P = 0.0157, (one-way ANOVA between groups P = 0.0001; post-hoc multiple comparisons, Tukey’s test, n = 10, 7, 6, 8 biologically independent animals, respectively). Scale bars = 100μm.
Fig. 2.
Fig. 2.
Human cardiac fibroblast targets in disease. (a) Heat map of cardiac fibroblast gene expression changes (fold change) in patients with hypertrophic cardiomyopathy (HCM) and dilated cardiomyopathy (DCM) when compared with non-failing hearts (NF). (n = 122 (NF), 27 (HCM), 89 (DCM)) Differential gene expression was performed using a linear model. (b) Immunohistochemistry for FAP (green) and cardiac Troponin (cardiomyocytes, red) expression in left ventricular free-wall sections from 6 individual human samples of NF (#1,2), HCM (#3,4), and DCM (#5,6). Representative images of 2 independent experiments with similar results. (c) Masson’s trichrome stain for fibrosis (blue; left, center) and immunohistochemistry for Fap (green; right) in adjacent WT mouse coronal heart sections 1 week after continuous saline (top) or angiotensin II/phenylephrine (bottom) treatment. Representative images of 2 independent experiments with similar results (n=7 biologically independent animals) (inset; left ventricle). Scale bars = 100μm.
Fig. 3.
Fig. 3.
FAP CAR T cells can target cardiac fibrosis. (a) Schematic diagram of experiments for FAP CAR T-cell targeting of cardiac fibroblast. C57BL/6 mice were continuously administered angiotensin II and phenylephrine via osmotic pump to induce cardiac injury and fibrosis. FAP CAR T cells were adoptively transferred 1 and 2 weeks after pump implantation when fibrosis had already been established. Mice were evaluated and sacrificed at 4 weeks to asses for fibrosis. (b) Picro-Sirius Red staining of heart coronal sections in mice treated with saline (left), angiotensin II/phenylephrine (center), or angiotensin II/phenylephrine + FAP CAR T cells (right) to evaluate fibrosis (red). Magnification of left ventricular fibrosis (bottom). (c) Quantification of cardiac fibrosis. ****P < 0.0001 (one-way ANOVA between groups P < 0.0001; post-hoc multiple comparisons, Tukey’s test, n = 10, 9, 7 biologically independent animals, respectively). (d) Comparison of cardiac functional parameters and body weight between experimental and control groups. **P < 0.01, *P < 0.05, ns = not significant (one-way ANOVA between groups; post-hoc multiple comparisons on significant (P < 0.05) ANOVA, Tukey’s test, n = 10, 9, 7 biologically independent animals, respectively). Specific P values can be found in the source data. MV E: Mitral valve early (E) inflow velocity (e) M mode echocardiography of mice treated with saline (top), angiotensin II/phenylephrine (center), or angiotensin II/phenylephrine + FAP CAR T cells (bottom), (arrows; systole, diastole). Representative images of 2 independent experiments with similar results. All graphs display mean ± SEM. Scale bars = 100μm.

Comment in

  • CAR T cells combat cardiac fibrosis.
    Crunkhorn S. Crunkhorn S. Nat Rev Immunol. 2019 Nov;19(11):659. doi: 10.1038/s41577-019-0226-4. Nat Rev Immunol. 2019. PMID: 31551571 No abstract available.
  • CAR T cells combat cardiac fibrosis.
    Crunkhorn S. Crunkhorn S. Nat Rev Cardiol. 2019 Dec;16(12):699. doi: 10.1038/s41569-019-0287-x. Nat Rev Cardiol. 2019. PMID: 31554926 No abstract available.
  • CAR-T cells combat cardiac fibrosis.
    Crunkhorn S. Crunkhorn S. Nat Rev Drug Discov. 2019 Oct;18(11):823. doi: 10.1038/d41573-019-00162-0. Nat Rev Drug Discov. 2019. PMID: 31673127 No abstract available.

Similar articles

Cited by

References

    1. Travers JG, Kamal FA, Robbins J, Yutzey KE & Blaxall BC Cardiac Fibrosis: The Fibroblast Awakens. Circ Res 118, 1021–1040, doi:10.1161/CIRCRESAHA.115.306565 (2016). - DOI - PMC - PubMed
    1. Kong P, Christia P & Frangogiannis NG The pathogenesis of cardiac fibrosis. Cell Mol Life Sci 71, 549–574, doi:10.1007/s00018-013-1349-6 (2014). - DOI - PMC - PubMed
    1. Fang L, Murphy AJ & Dart AM A Clinical Perspective of Anti-Fibrotic Therapies for Cardiovascular Disease. Front Pharmacol 8, 186, doi:10.3389/fphar.2017.00186 (2017). - DOI - PMC - PubMed
    1. Ottaviano FG & Yee KO Communication signals between cardiac fibroblasts and cardiac myocytes. J Cardiovasc Pharmacol 57, 513–521, doi:10.1097/FJC.0b013e31821209ee (2011). - DOI - PubMed
    1. Fan Z & Guan J Antifibrotic therapies to control cardiac fibrosis. Biomater Res 20, 13, doi:10.1186/s40824-016-0060-8 (2016). - DOI - PMC - PubMed

Methods References

    1. Kanisicak O et al. Genetic lineage tracing defines myofibroblast origin and function in the injured heart. Nat Commun 7, 12260, doi:10.1038/ncomms12260 (2016). - DOI - PMC - PubMed
    1. Sandhu U et al. Strict control of transgene expression in a mouse model for sensitive biological applications based on RMCE compatible ES cells. Nucleic Acids Res 39, e1, doi:10.1093/nar/gkq868 (2011). - DOI - PMC - PubMed
    1. Cebula M et al. An inducible transgenic mouse model for immune mediated hepatitis showing clearance of antigen expressing hepatocytes by CD8+ T cells. PLoS One 8, e68720, doi:10.1371/journal.pone.0068720 (2013). - DOI - PMC - PubMed
    1. Ochel A et al. Effective intrahepatic CD8+ T-cell immune responses are induced by low but not high numbers of antigen-expressing hepatocytes. Cell Mol Immunol 13, 805–815, doi:10.1038/cmi.2015.80 (2016). - DOI - PMC - PubMed
    1. Mourkioti F et al. Role of telomere dysfunction in cardiac failure in Duchenne muscular dystrophy. Nat Cell Biol 15, 895–904, doi:10.1038/ncb2790 (2013). - DOI - PMC - PubMed

Publication types