. 2019 Oct 1;33(19-20):1367-1380.
doi: 10.1101/gad.328955.119. Epub 2019 Sep 5.

miR-26 suppresses adipocyte progenitor differentiation and fat production by targeting Fbxl19

Affiliations

miR-26 suppresses adipocyte progenitor differentiation and fat production by targeting Fbxl19

Asha Acharya et al. Genes Dev. .

Abstract

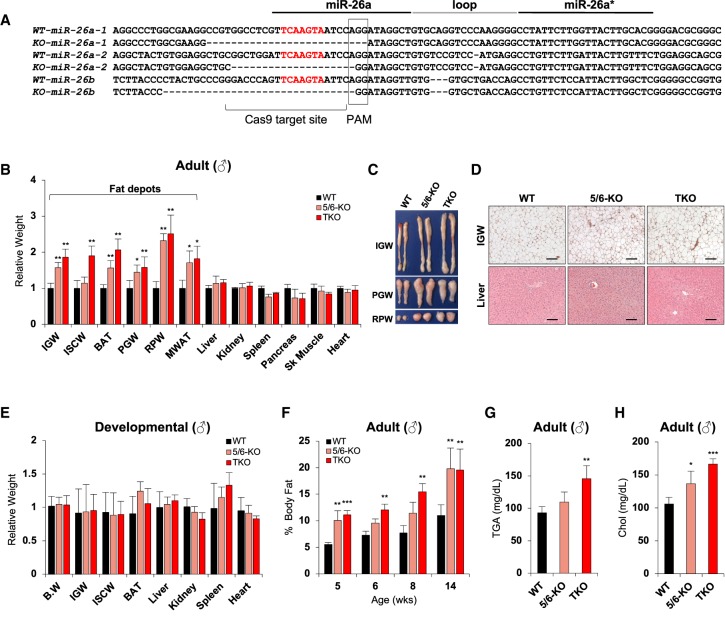
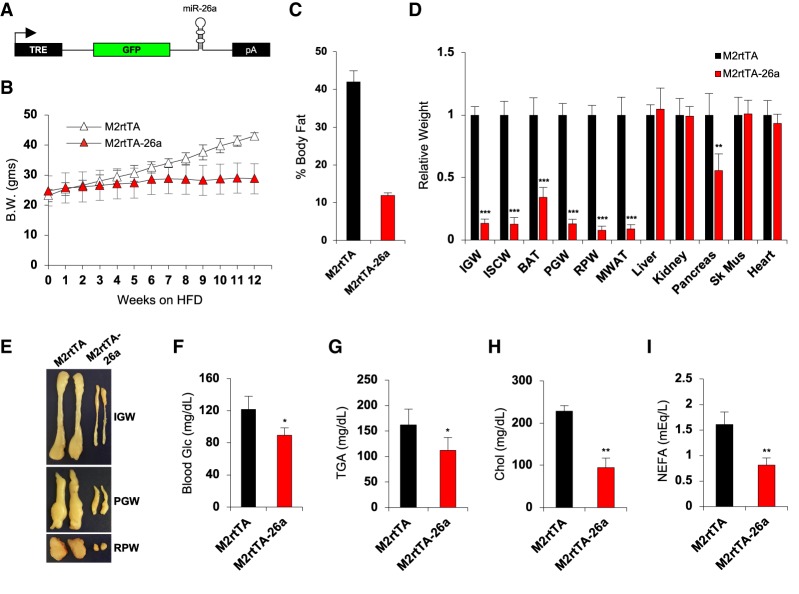
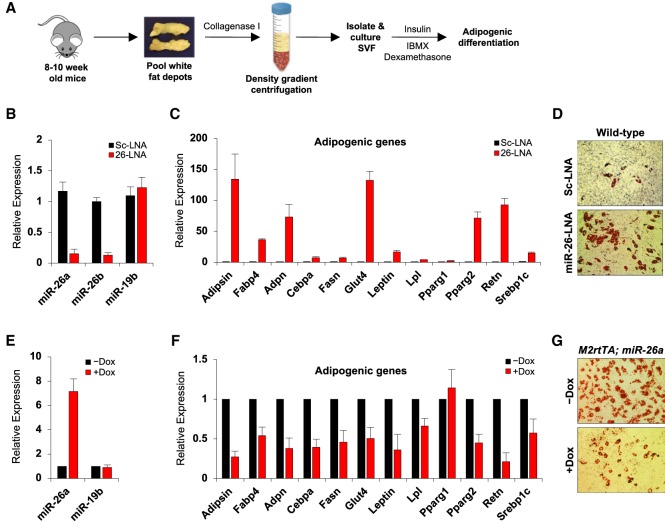
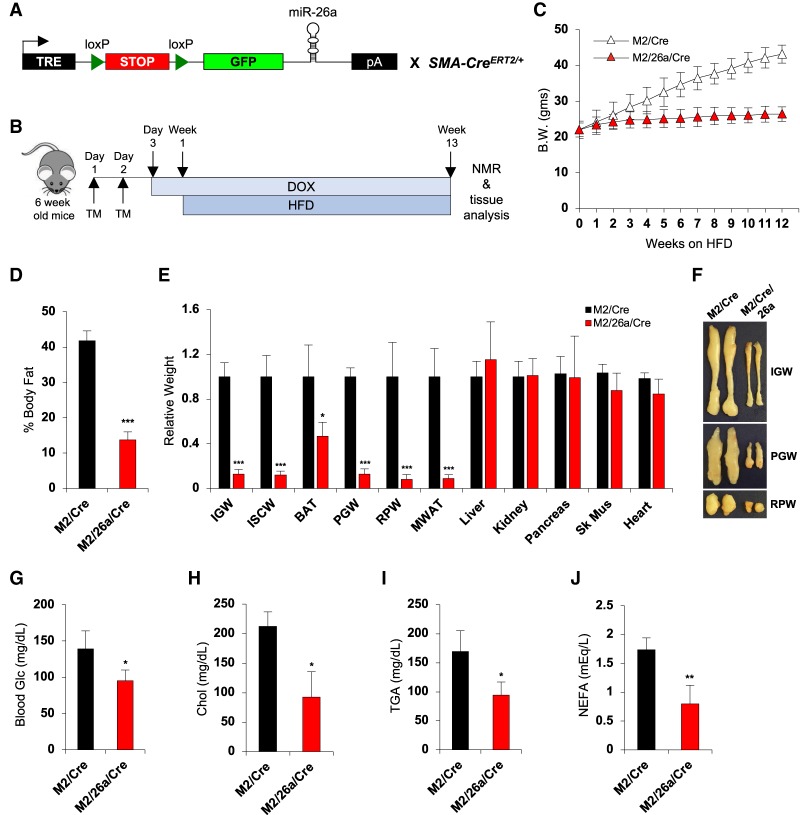
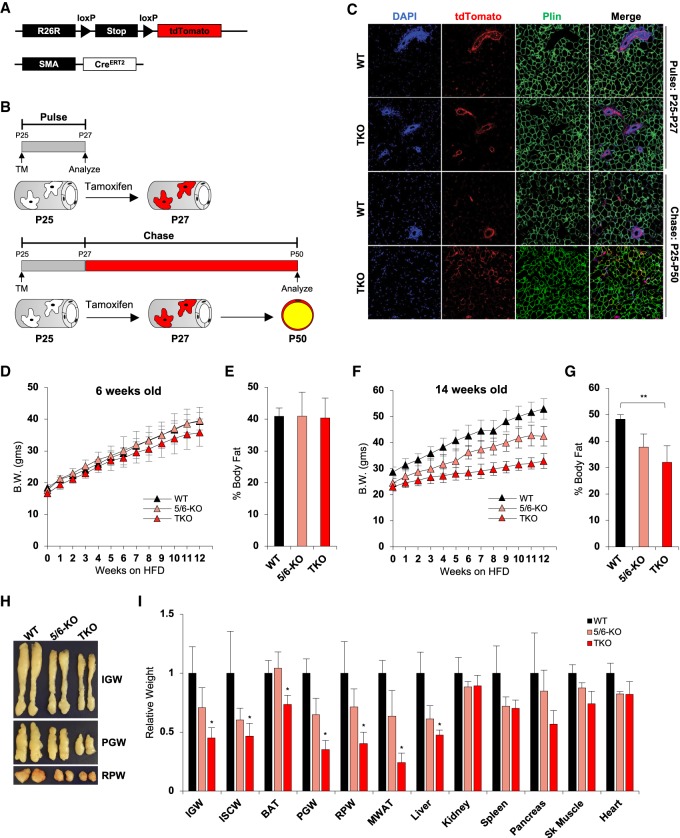
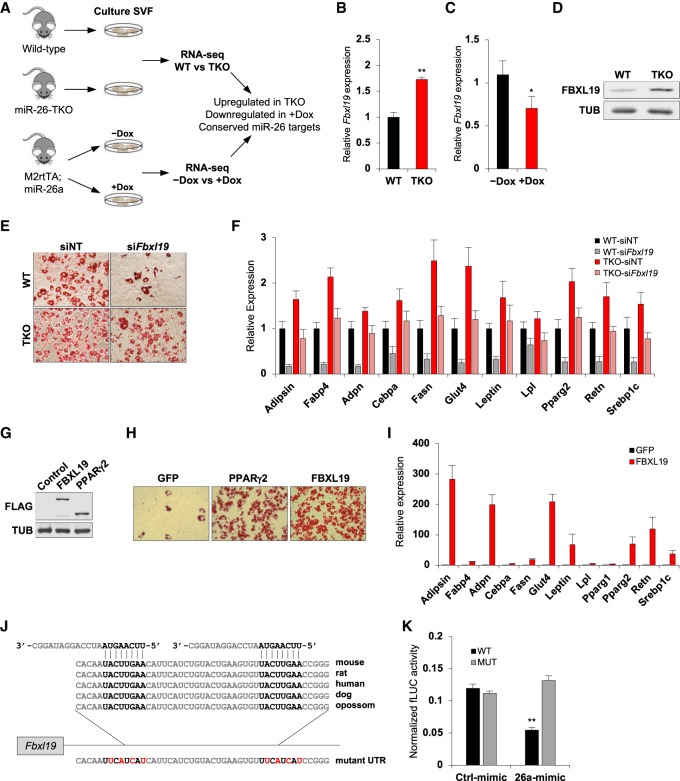
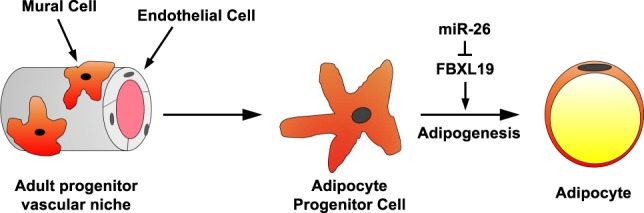
Fat storage in adult mammals is a highly regulated process that involves the mobilization of adipocyte progenitor cells (APCs) that differentiate to produce new adipocytes. Here we report a role for the broadly conserved miR-26 family of microRNAs (miR-26a-1, miR-26a-2, and miR-26b) as major regulators of APC differentiation and adipose tissue mass. Deletion of all miR-26-encoding loci in mice resulted in a dramatic expansion of adipose tissue in adult animals fed normal chow. Conversely, transgenic overexpression of miR-26a protected mice from high-fat diet-induced obesity. These effects were attributable to a cell-autonomous function of miR-26 as a potent inhibitor of APC differentiation. miR-26 blocks adipogenesis, at least in part, by repressing expression of Fbxl19, a conserved miR-26 target without a previously known role in adipocyte biology that encodes a component of SCF-type E3 ubiquitin ligase complexes. These findings have therefore revealed a novel pathway that plays a critical role in regulating adipose tissue formation in vivo and suggest new potential therapeutic targets for obesity and related disorders.

Keywords: Fbxl19; adipocyte progenitor cell; adipogenesis; miR-26; microRNA; obesity; white adipose tissue.


Figures

Figure 1.
Figure 1.
miR-26-TKO mice have excess body fat and dyslipidemia. (A) Sequences of mouse miR-26a-1, miR-26a-2, and miR-26b genomic loci and deletion alleles generated using CRISPR/Cas9. Protospacer adjacent motif (boxed rectangle), miRNA seed region (red) and sgRNA sequence used for targeting (Cas9 targeting site) are shown. (B) Relative weights of isolated fat depots and major organs from 3-mo-old male mice of the indicated genotypes fed standard chow, normalized to wild type (n = 6 mice per genotype). 5/6-KO denotes mice with five of the six miR-26 alleles knocked out with only one wild-type copy of miR-26a-2 intact. (TKO) Triple knockout mice. Fat depots: (IGW) Iguinal; (ISCW) interscapular; (PGW) perigonadal; (RPW) retroperitoneal; (MWAT) mesenteric; (BAT) brown adipose tissue. (C) Representative whole-mount images of subcutaneous and visceral white fat depots of mice from B. (D) Representative H&E stained sections of IGW (top panels) and liver (bottom panels) from mice of the indicated genotypes. Scale bars, 100 µM. (E) Relative weights of isolated fat depots and major organs from postnatal day 10 male mice (n = 4–6 mice per genotype). No significant differences were noted at this time point. (F) Fat content of male mice at indicated ages measured by whole body NMR (n = 6 mice per genotype, per timepoint). (G,H) Serum triglycerides (G) and cholesterol (H) in 3-mo-old male mice (n = 6 mice per genotype). For panels B and EH, data are represented as mean ± SD. (*) P < 0.05; (**) P < 0.01; (***) P < 0.001, calculated using two-tailed t-test.
Figure 2.
Figure 2.
Global overexpression of miR-26a protects mice from HFD-induced obesity. (A) Schematic of the dox-inducible mR-26a transgene (eGFP.miR-26a) (Zeitels et al. 2014). TRE, Tetracycline-response element; pA, poly(A) signal. (B) Body weight of double transgenic (M2rtTA; eGFP.miR-26a, abbreviated M2rtTA-26a) and control (M2rtTA only, abbreviated M2rtTA) male mice (n = 6–8 per genotype) on dox and HFD for 12 wk. M2rtTA-26a and M2rtTA male transgenic mice were switched to dox-containing water (2 mg/mL) at 6 wk of age. Two weeks later, HFD was initiated and body weight was recorded weekly. (C) Whole body fat content of mice in B after 12 wk on HFD analyzed by NMR. (D) Relative weights of isolated fat depots and major organs from mice from B after 12 wk on HFD. (E) Representative images of isolated subcutaneous (IGW) and visceral (PGW and RPW) fat depots from mice of the indicated genotypes from B. (F–I) Blood glucose (F), serum triglycerides (G), cholesterol (H), and nonesterified free fatty acids (I) in mice from B after 12 wk on HFD. Data presented in BI are part of the same experiment and representative of three independent experiments. Data represented as mean ± SD. (*) P < 0.05; (**) P < 0.01; (***) P < 0.001, calculated using two-tailed t-test.
Figure 3.
Figure 3.
miR-26 regulates adipogenesis in vitro. (A) Schematic of isolation and in vitro differentiation of stromal vascular fraction (SVF) from pooled fat depots of adult mice. (B) qRT-PCR analysis of mature miR-26a, miR-26b, and miR-19b (an unrelated control miRNA) in wild-type SVF cultures transfected with miR-26 LNA antisense inhibitors (26-LNA) or scrambled control LNA oligonucleotides (Sc-LNA). n = 3 biological replicates per condition. (C) qRT-PCR analysis of adipogenic gene expression following in vitro differentiation of miR-26 LNA-transfected SVF cultures from B, relative to scrambled control transfected SVFs. (D) Representative images of Oil Red O-stained SVF cultures from B. (E) qRT-PCR analysis of miR-26a or miR-19b levels in SVFs derived from M2rtTA; eGFP.miR-26a transgenic mice, cultured with or without dox (1 μg/mL) for 4 d prior to induction of differentiation. n = 3 biological replicates per condition. (F) qRT-PCR analysis of adipogenic gene expression following in vitro differentiation of dox-treated SVF cultures from E, relative to untreated cultures. (G) Representative images of Oil Red O-stained SVF cultures from E. Data represented as mean ± SD.
Figure 4.
Figure 4.
Overexpression of miR-26a in adult APCs prevents HFD-induced obesity. (A) Schematic of the dox- and Cre-inducible miR-26a transgene (LSL.eGFP.miR-26a) crossed to tamoxifen-inducible SMA-CreERT2/+ for overexpression of miR-26a in adult APCs. (B) Experimental time course. Tamoxifen (TM) was administered to 6-wk-old M2rtTA; LSL.eGFP.miR-26a; SMA-CreERT2/+ (M2/26a/Cre) and control M2rtTA; SMA-CreERT2/+ (M2/Cre) mice, followed by administration of dox to activate miR-26 expression in the APC lineage. Mice were then fed a HFD for 12 wk. (C) Body weight of control (M2/Cre) and transgenic (M2/Cre/26a) mice on HFD (n = 6–8 mice per genotype) recorded weekly. (D) Whole body fat content of mice from C measured by NMR after 12 wk on HFD. (E) Relative weights of isolated fat depots and major organs of mice from C after 12 wk on HFD. (F) Representative whole-mount images of subcutaneous IGW and visceral PGW and RPW fat depots from mice from C after 12 wk on HFD. (G–J) Blood glucose (G), serum cholesterol (H), triglycerides (I), and nonesterified fatty acids (J) from mice from C after 12 wk on HFD. Data represented as mean ± SD. (*) P < 0.05; (**) P < 0.01; (***) P < 0.001 calculated using two-tailed t-test.
Figure 5.
Figure 5.
Loss of miR-26 results in precocious differentiation and depletion of APCs. (A) Schematic of transgenes used for lineage tracing of adult APCs in wild-type and miR-26-TKO mice. (B) Experimental time course. Adult wild-type and miR-26-TKO mice were pulsed with tamoxifen (TM) at postnatal day 25 (P25) to label the APCs with tdTomato using SMA-CreERT2/+ and R26RtdT/+. One-half of the animals from both genotypes were sacrificed on P27 to ensure efficient labeling. Reporter expression in the remaining mice was analyzed at P50 to assess adipocyte labeling. (C) Representative stained sections of IGW fat depots from mice of the indicated genotypes, induced with tamoxifen at P25 and analyzed at P27 (Pulse, top half) or P50 (Chase, bottom half). R26RtdT/+ expression was detected by antibody staining for tdTomato (red) on FFPE sections. Nuclei are marked with DAPI (blue) and Perilipin (Plin) marks mature adipocytes (green). These data are representative of two independent experimental cohorts of animals. (D) Body weight of mice of indicated genotypes fed HFD starting at 6 wk of age (n = 10–12 mice per genotype) recorded weekly. (E) Whole-body fat content of mice in D measured by NMR after 12 wk on HFD. (F) Body weight of mice of indicated genotypes fed HFD starting at 14 wk of age (n = 10–12 per genotype) recorded weekly. (G) Whole-body fat content of mice in F measured by NMR after 12 wk on HFD. (H) Representative whole-mount images of subcutaneous (IGW) and visceral (PGW and RPW) fat depots from mice in F after 12 wk on HFD. (I) Relative weights of isolated fat depots and major organs of mice in F after 12 wk on HFD. Data represented as mean ± SD. (*) P < 0.05; (**) P < 0.01, calculated using two-tailed t-test.
Figure 6.
Figure 6.
Fbxl19 is a conserved miR-26 target that promotes adipogenesis. (A) Experimental design to identify candidate miR-26 targets that regulate adipogenesis. RNA-seq was used to identify (1) genes up-regulated in miR-26-TKO vs. wild-type SVF cultures and (2) genes down-regulated in dox-treated versus untreated SVF cultures from miR-26a transgenic mice (M2rtTA; miR-26a). Genes were further filtered for Targetscan7.2-predicted miR-26 targets (http://www.targetscan.org). (B,C) qRT-PCR analysis of Fbxl19 expression in wild-type and miR-26-TKO SVFs (B) and miR-26a transgenic SVFs with or without dox treatment (C). n = 3 biological replicates. (D) Western blot of FBXL19 protein levels in wild-type and miR-26-TKO SVFs. Data are representative of three independent experiments. α-tubulin (TUB) represents a loading control. (E) Representative images of Oil Red O-stained in vitro differentiated wild-type or miR-26-TKO SVF cultures following siRNA knockdown of Fbxl19. siNT, nontargeting control siRNA. (F) qRT-PCR analysis of adipogenic gene expression in SVF cultures in E. (G) Western blot of Flag-tagged mouse FBXL19 or PPARγ2 in transfected wild-type SVF cultures. (H) Representative images of Oil Red O-stained SVF cultures after overexpression of the indicated proteins. (I) qRT-PCR analysis of adipogenic gene expression in SVF cultures with GFP or FBXL19 overexpression. (J) Schematic representation of conserved miR-26 binding sites in the 3′ UTR of Fbxl19. Mutations introduced to disrupt miR-26-binding are shown below the alignment and highlighted in red. (K) Relative firefly luciferase activity of reporter constructs containing wild-type or mutant miR-26-binding sites from the Fbxl19 3′ UTR following cotransfection with control or miR-26a mimics. Data represent the average of three independent experiments, each performed with technical triplicates. Data represented as mean ± SD (*) P < 0.05; (**) P < 0.01, calculated using two-tailed t-test.
Figure 7.
Figure 7.
miR-26 suppresses adipocyte progenitor cell differentiation. miR-26 functions within the APC lineage to inhibit mobilization and subsequent adipocyte production by down-regulating FBXL19, a novel driver of adipogenesis.

Similar articles

Cited by

References

    1. Agarwal V, Bell GW, Nam JW, Bartel DP. 2015. Predicting effective microRNA target sites in mammalian mRNAs. Elife 4: e05005 10.7554/eLife.05005 - DOI - PMC - PubMed
    1. Bartel DP. 2009. MicroRNAs: target recognition and regulatory functions. Cell 136: 215–233. 10.1016/j.cell.2009.01.002 - DOI - PMC - PubMed
    1. Bartel DP. 2018. Metazoan MicroRNAs. Cell 173: 20–51. 10.1016/j.cell.2018.03.006 - DOI - PMC - PubMed
    1. Berry R, Rodeheffer MS. 2013. Characterization of the adipocyte cellular lineage in vivo. Nat Cell Biol 15: 302–308. 10.1038/ncb2696 - DOI - PMC - PubMed
    1. Berry DC, Stenesen D, Zeve D, Graff JM. 2013. The developmental origins of adipose tissue. Development 140: 3939–3949. 10.1242/dev.080549 - DOI - PMC - PubMed

Publication types