. 2019 Sep;573(7774):439-444.
doi: 10.1038/s41586-019-1526-3. Epub 2019 Sep 4.

E-cadherin is required for metastasis in multiple models of breast cancer

Affiliations

E-cadherin is required for metastasis in multiple models of breast cancer

Veena Padmanaban et al. Nature. 2019 Sep.

Abstract

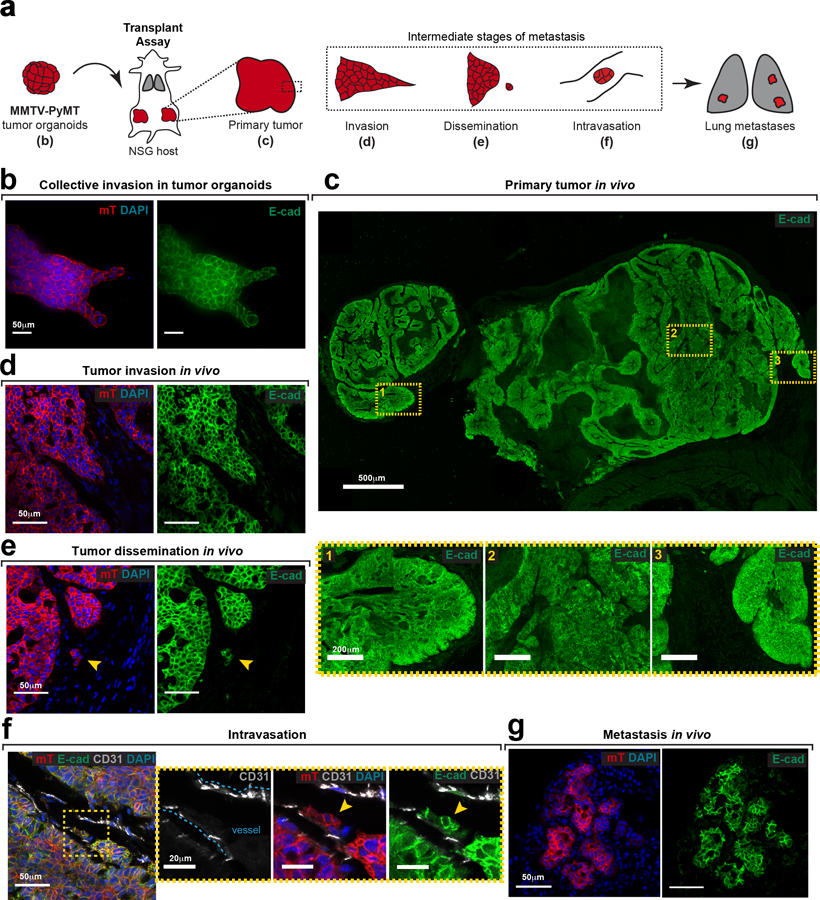
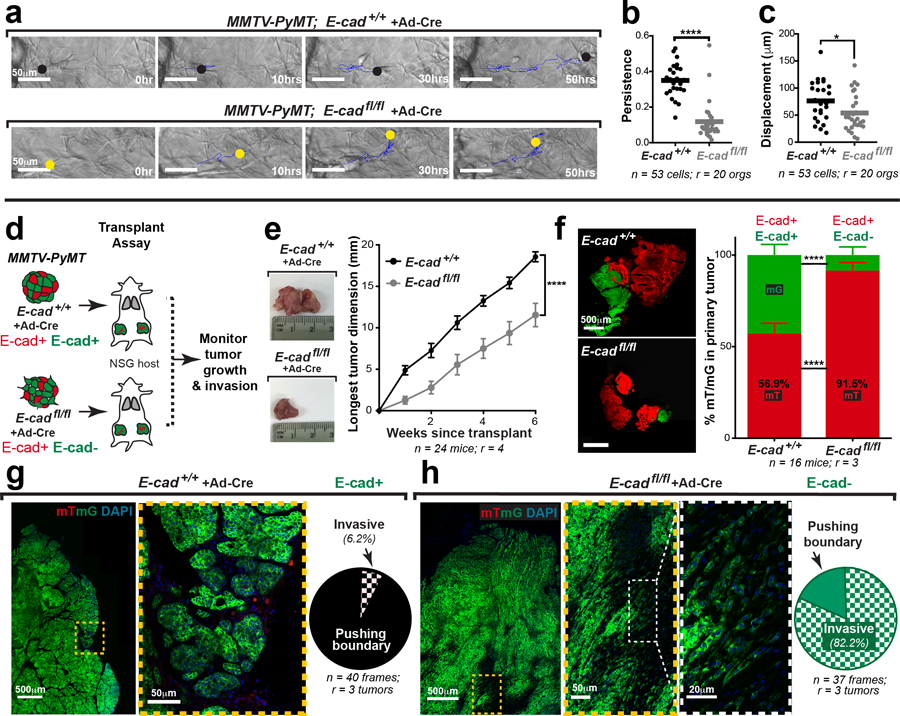
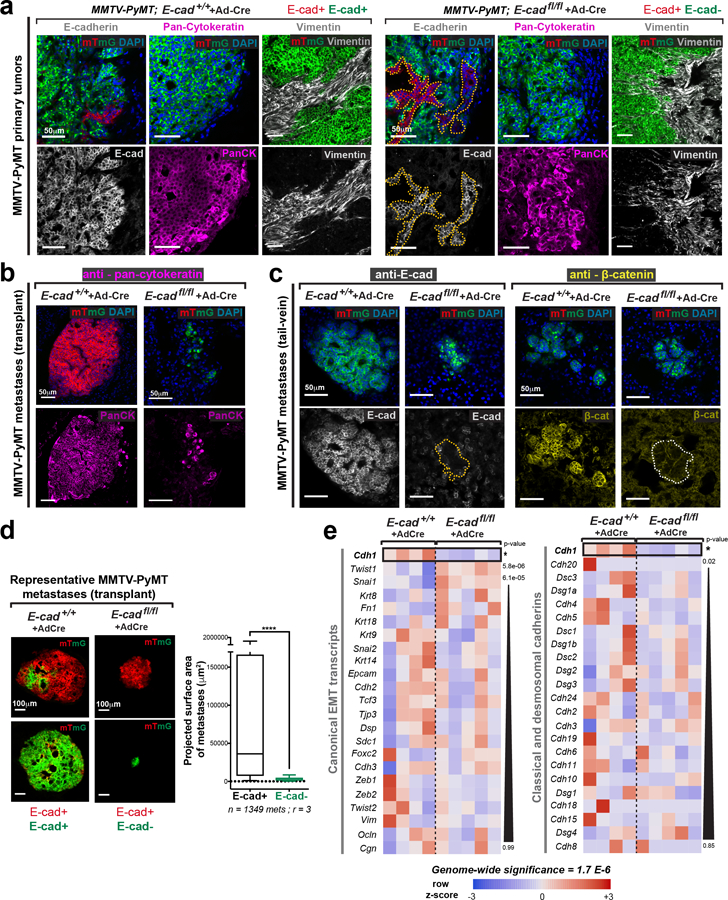
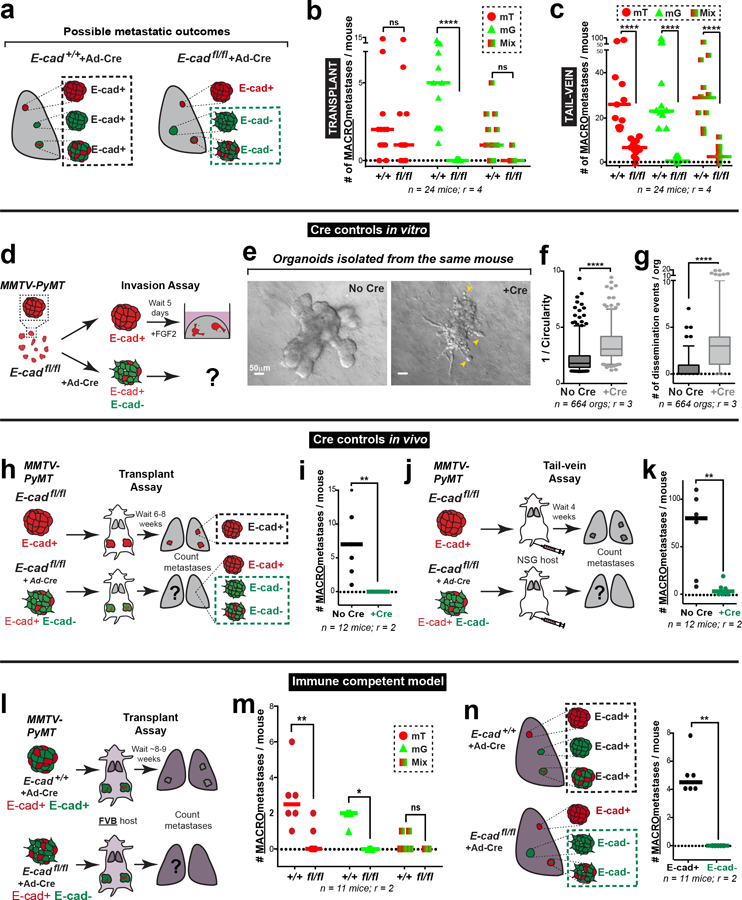
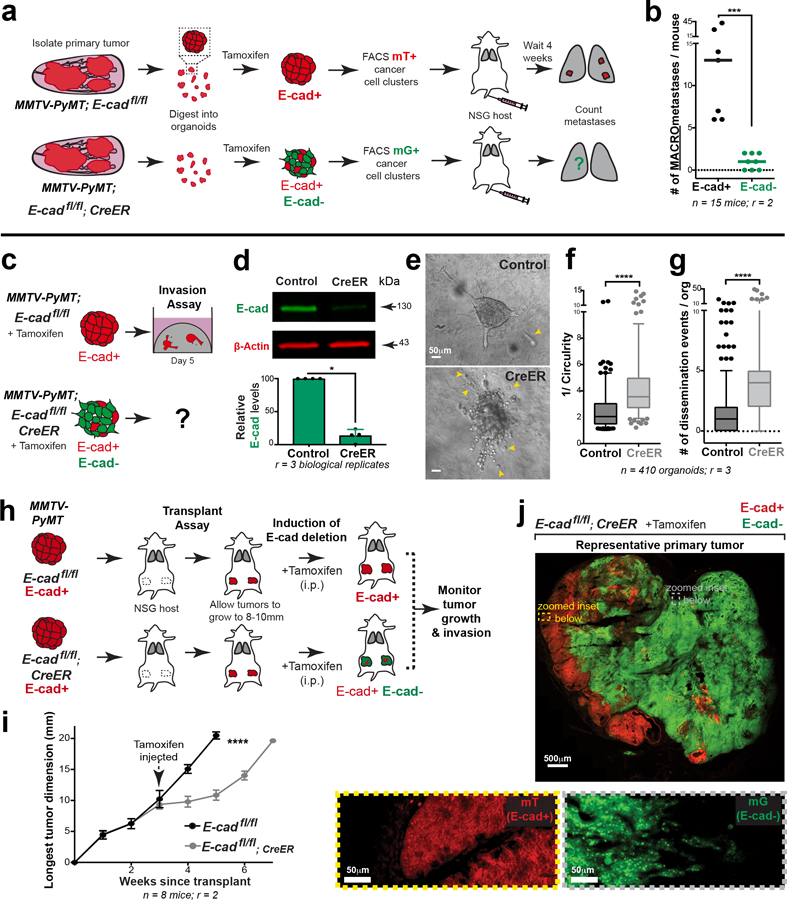
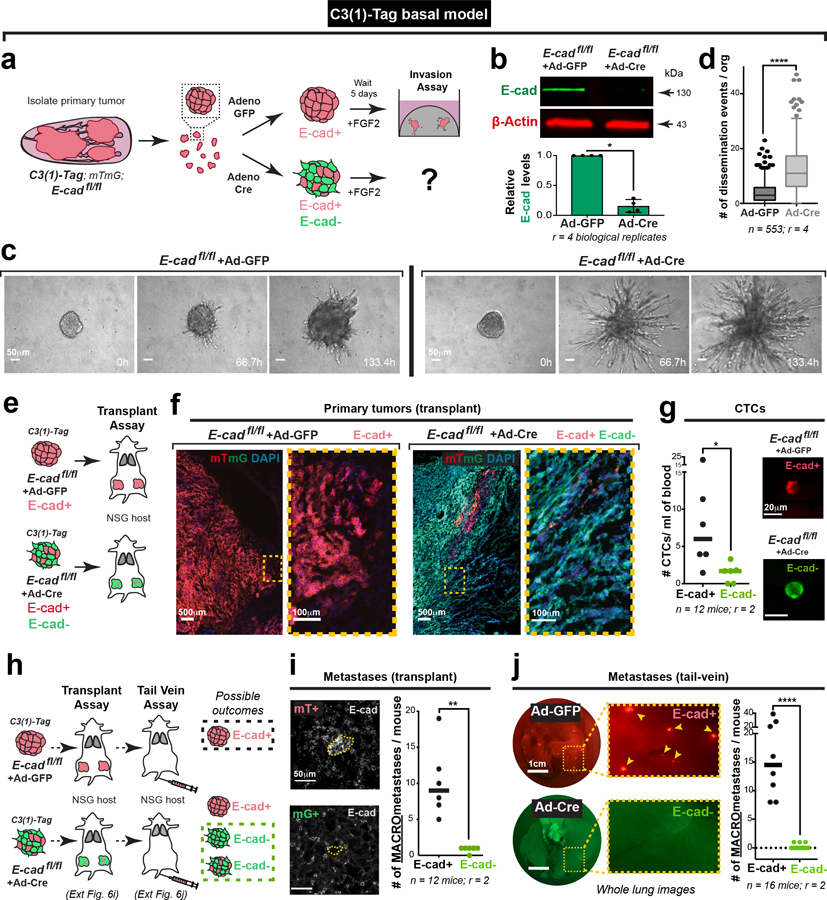
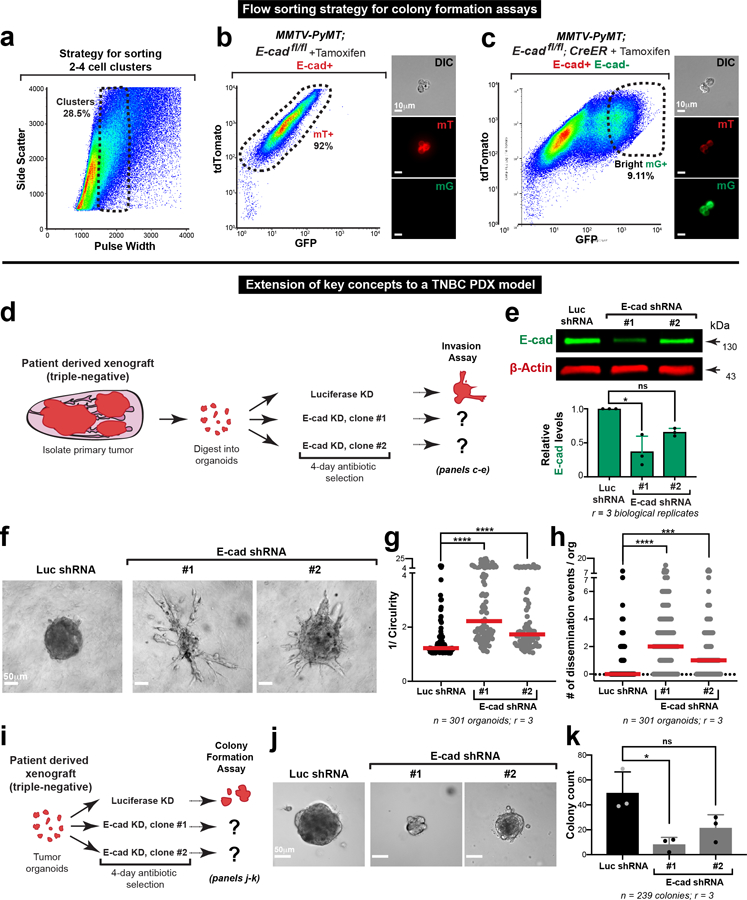
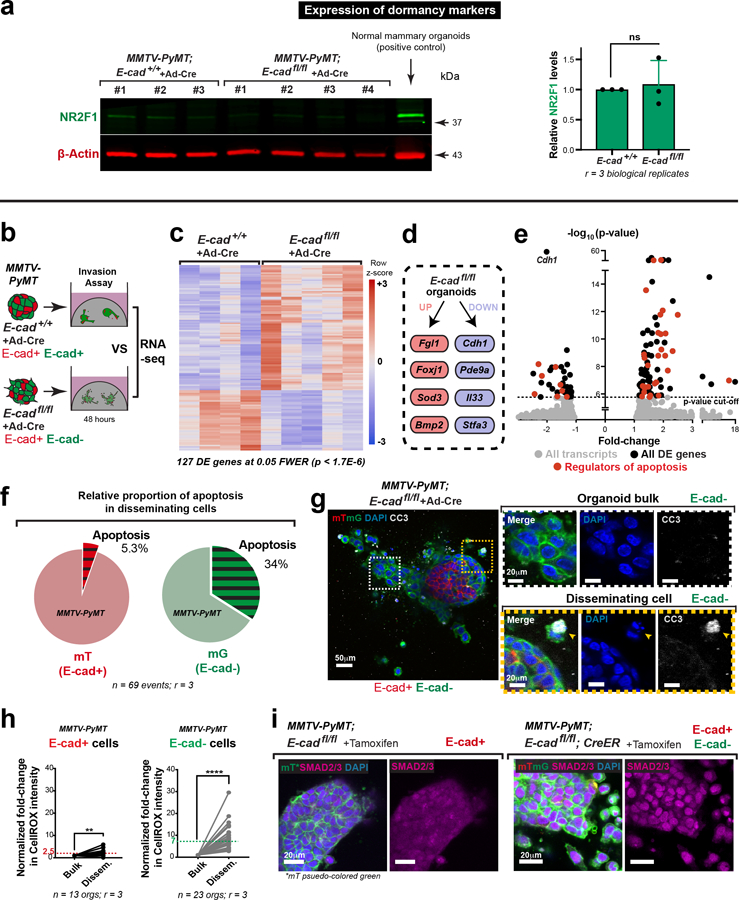
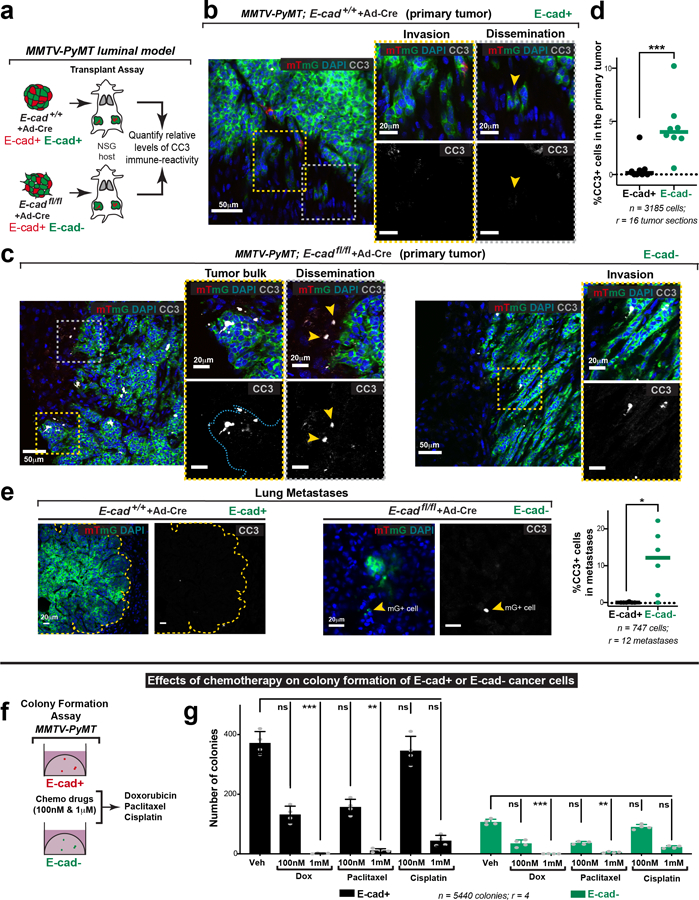
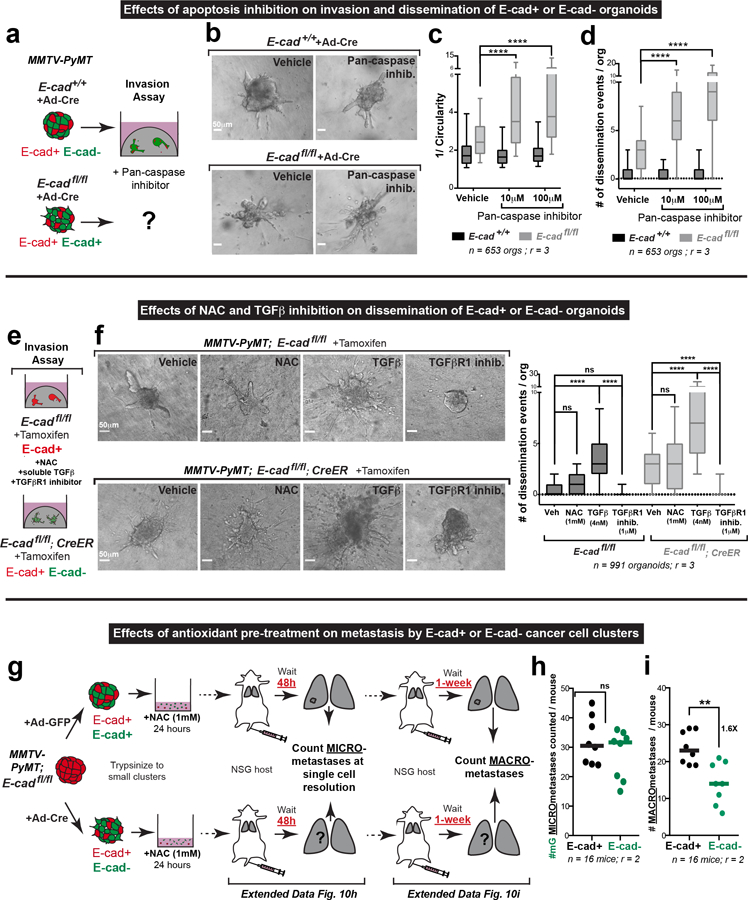
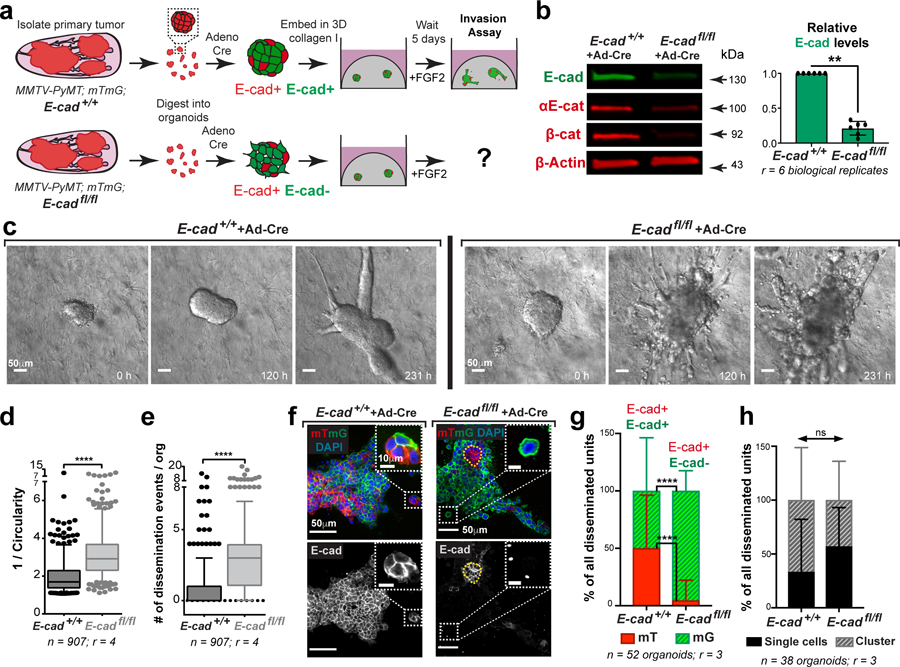
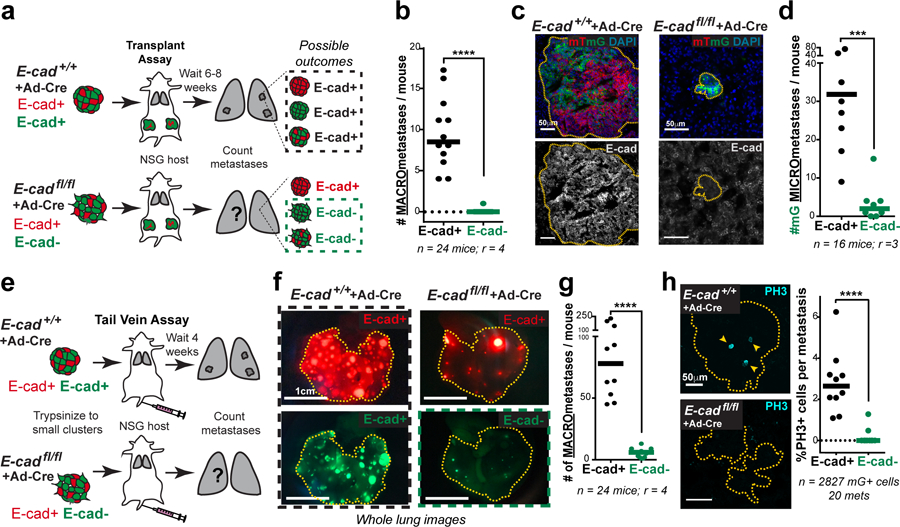
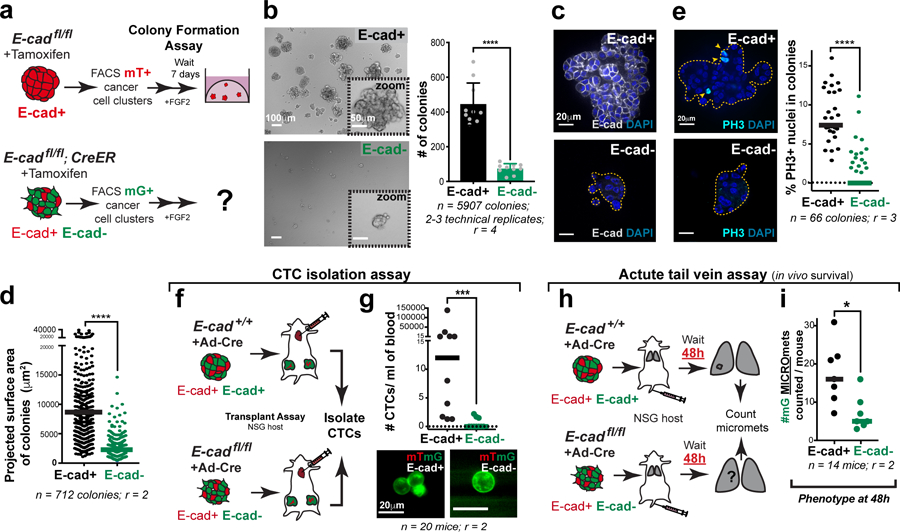
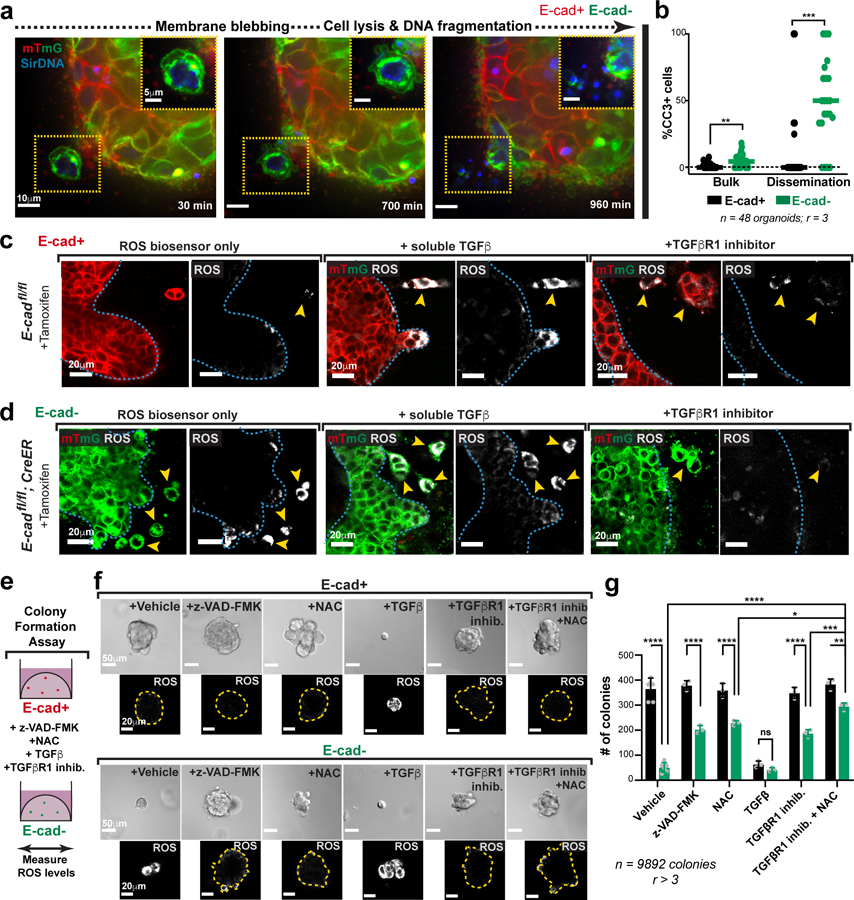
Metastasis is the major driver of death in patients with cancer. Invasion of surrounding tissues and metastasis have been proposed to initiate following loss of the intercellular adhesion protein, E-cadherin1,2, on the basis of inverse correlations between in vitro migration and E-cadherin levels3. However, this hypothesis is inconsistent with the observation that most breast cancers are invasive ductal carcinomas and express E-cadherin in primary tumours and metastases4. To resolve this discrepancy, we tested the genetic requirement for E-cadherin in metastasis using mouse and human models of both luminal and basal invasive ductal carcinomas. Here we show that E-cadherin promotes metastasis in diverse models of invasive ductal carcinomas. While loss of E-cadherin increased invasion, it also reduced cancer cell proliferation and survival, circulating tumour cell number, seeding of cancer cells in distant organs and metastasis outgrowth. Transcriptionally, loss of E-cadherin was associated with upregulation of genes involved in transforming growth factor-β (TGFβ), reactive oxygen species and apoptosis signalling pathways. At the cellular level, disseminating E-cadherin-negative cells exhibited nuclear enrichment of SMAD2/3, oxidative stress and increased apoptosis. Colony formation of E-cadherin-negative cells was rescued by inhibition of TGFβ-receptor signalling, reactive oxygen accumulation or apoptosis. Our results reveal that E-cadherin acts as a survival factor in invasive ductal carcinomas during the detachment, systemic dissemination and seeding phases of metastasis by limiting reactive oxygen-mediated apoptosis. Identifying molecular strategies to inhibit E-cadherin-mediated survival in metastatic breast cancer cells may have potential as a therapeutic approach for breast cancer.


Conflict of interest statement

Competing Interests (online only) A.J.E. and V.P. are listed as inventors on a patent application related to the use of antibodies as cancer therapeutics. A.J.E. is listed as an inventor on a patent application related to the use of keratin-14 as a prognostic indicator for breast cancer outcomes. A.J.E.’s spouse is an employee of ImmunoCore. J.S.B. is a founder and director of Neochromosome, Inc., and is a member of the scientific advisory board of AI Therapeutics, Inc. I.K., B.M.S. and N.A. are listed as inventors in patent applications related to CTCs and cancer treatment. N.A. is a paid consultant for pharmaceutical and insurance companies with an interest in liquid biopsy.

The authors declare competing financial interests: details are available in the online version of the paper.

Figures

Extended Data Fig. 1:
Extended Data Fig. 1:. E-cad expression is retained during several intermediate stages of metastasis
a) E-cad expression is determined by immunofluorescence at various stages of metastasis following orthotopic transplantation of MMTV-PyMT; mTmG tumor organoids into NSG host mice. Observations described in this figure were made across at least 3 independent MMTV-PyMT tumors. b) Tumor organoids embedded in Collagen I express membrane-localized E-cad. Scale bar, 50 μm. c) Representative tile-scan showing E-cad expression within a tumor section. Scale bar, 500 μm. Three selected regions within the tumor (yellow boxes; scale bar, 20 μm) express high levels of membrane-localized E-cad. d–g) E-cad is also expressed in invasion strands (d), locally disseminated units (e), intravasated units (f), and distant metastases (g) in vivo. Scale bar, 50 μm. Arrowhead – disseminated unit (e) or intravasated unit (f). Yellow box in panel (f) marked a zoomed inset.
Extended Data Fig. 2:
Extended Data Fig. 2:. E-cad loss decreases migratory persistence ex vivo and increases invasion in vivo
a) E-cad+ or E-cad- cells from adeno-Cre treated MMTV-PyMT; E-cad+/+ or E-cadfl/fl organoids respectively were manually tracked as they migrated within collagen I. Cell tracks – blue lines; circles – last tracked position of the cell at that time-point. Scale bar, 50 μm. b–c) Disseminating E-cad- cancer cells exhibit decreased migratory persistence (b) and displacement (c) relative to E-cad+ cells. Bar – median. ****p <0.0001, *p = 0.027 (Mann-Whitney test, two-sided). d) Adeno-Cre transduced MMTV-PyMT; E-cad+/+ or E-cadfl/fl organoids were transplanted into cleared mammary fat pads of immunocompromised NSG mice. Tumors sizes were monitored bi-weekly and harvested after ~6 weeks. e) Tumors arising from E-cadfl/fl organoids were smaller than those arising from control organoids. Mean +/− SEM. ****p <0.0001 (regression analysis). f) Representative micrographs of primary tumors arising from E-cad+/+ or E-cadfl/fl donor tissue. Scale bar, 500 μm. Control tumors have relatively similar amounts of mT+ and mG+ cancer cells. In contrast, mG+ (Cre+, E-cad-) cancer cells constitute <10% of E-cadfl/fl tumors. Mean +/− SEM. ****p <0.0001 (Kruskal-Wallis test). g) Left: Representative tile-scan of a primary tumor arising from control organoids. Right: ~94% of the tumor border exhibits a pushing boundary (scale bar, 500 μm), with zoomed insets for the tumor-stroma border (scale bar, 50 μm). h) Left: Representative tile-scan of a mG+ (E-cad-) region of a primary tumor arising from E-cadfl/fl organoids. Right: Over 80% of the E-cad-negative tumor edge has an invasive morphology (scale bar, 500 μm), with zoomed insets for the tumor-stroma border (scale bar, 50 μm and 20 μm).
Extended Data Fig. 3:
Extended Data Fig. 3:. E-cad- cancer cells retain epithelial gene expression
a) Control adeno-Cre transduced MMTV-PyMT; E-cad+/+ tumors are E-cad+, keratin+, vimentin-. mG+ (Cre+) cells in adeno-Cre transduced MMTV-PyMT; E-cadfl/fl tumors are E-cad-, keratin+, and vimentin-. Dotted lines define mT+, E-cad+ regions within E-cadfl/fl tumors. Adjacent host derived stroma serves as a positive control for vimentin expression. Scale bar, 50 μm. Repeated across at least 3 independent E-cad+/+ and E-cadfl/fl tumors. b) Metastases in control transplant mice are keratin+. mG+ (Cre+) metastases arising in adeno-Cre transduced MMTV-PyMT; E-cadfl/fl transplant mice are keratin+. Scale bar, 50 μm. Repeated across sections from at least 3 independent E-cad+/+ and E-cadfl/fl mice. c) Lung metastases in control tail-vein mice are E-cad+ and have membrane localized β-catenin. In contrast, mG+ metastases in mice injected with adeno-Cre transduced MMTV-PyMT; E-cadfl/fl clusters are E-cad- and β-catenin-. Scale bar, 50 μm. Repeated across sections from at least 3 independent E-cad+/+ and E-cadfl/fl mice. d) Left: Representative micrographs of metastases arising in adeno-Cre transduced MMTV-PyMT; E-cad+/+ or E-cadfl/fl transplant mice. Scale bar, 100 μm. Right: Projected surface area of metastases arising in adeno-Cre transduced MMTV-PyMT E-cad+/+ and E-cadfl/fl transplant mice is represented. 5–95 percentile. ****p<0.0001 (Mann-Whitney test, two-sided). e) Heatmap of canonical EMT transcripts (left) and cadherin family members (right). RNA-seq was performed by comparing transcriptomes of 4 adeno-Cre treated MMTV-PyMT; E-cad+/+ organoids to 5 adeno-Cre treated MMTV-PyMT; E-cadfl/fl organoids. p-values were calculated for the Wald test. Genome-wide significance = 1.7 E-6 (FWER = 0.05).
Extended Data Fig. 4:
Extended Data Fig. 4:. Alternate controls – E-cad loss increases invasion & dissemination but prevents metastasis across several assays
a) All metastases arising from adeno-Cre transduced MMTV-PyMT; E-cad+/+ organoids are E-cad+. Only mG+ metastases arising from adeno-Cre transduced MMTV-PyMT; E-cadfl/fl organoids are E-cad-negative. b) Number of macro-metastases in mice transplanted with adeno-Cre transduced MMTV-PyMT E-cad+/+ or E-cadfl/fl tumor organoids, as sorted by the color of the metastasis (mT, mG, or mT/mG mixed). Bar – median. ****p<0.0001 (Kruskal-Wallis test). c) Number of macro-metastases per mouse after tail vein injections of adeno-Cre transduced MMTV-PyMT E-cad+/+ or E-cadfl/fl clusters, as sorted by the color of the metastasis (mT, mG, or mT/mG mixed) is represented. Bar – median. ****p<0.0001 (two-way ANOVA). d) Schematic of 3D invasion assays using organoids from the same MMTV-PyMT; E-cadfl/fl tumor with or without adeno-Cre transduction. e) Representative DIC images of MMTV-PyMT; E-cadfl/fl organoids with or with adeno-Cre. Arrowheads – dissemination events. Scale bar, 50 μm. f–g) There is an increase in invasion (f) and dissemination (g) in E-cadfl/fl organoids treated with adeno-Cre, relative to uninfected controls. 5–95 percentile. ****p<0.0001 (Mann-Whitney test, two-sided). h–i) Schematic of the transplant assay using MMTV-PyMT; E-cadfl/fl organoids with or without adeno-Cre (h). There are no observable E-cad- macro-metastases (i). Bar – median. **p = 0.0022 (Mann-Whitney test, two-sided). j–k) Schematic of the tail vein assay using MMTV-PyMT; E-cadfl/fl organoids with or without adeno-Cre (j). E-cad- cancer cells are defective at tumor cell seeding (k). Bar - median. **p = 0.0087 (Mann-Whitney test, two-sided). l) Schematic of orthotopic transplantation of adeno-Cre transduced MMTV-PyMT; E-cad+/+ or E-cadfl/fl MMTV-PyMT tumor organoids into immunocompetent FVB host mice. Lungs from these mice were harvested after ~8 weeks and the number of metastases counted. m) Number of observed macro-metastases in mice (FVB) transplanted with adeno-Cre transduced MMTV-PyMT; E-cad+/+ or E-cadfl/fl tumor organoids, sorted by the color of the metastasis. Bar – median. **p = 0.0033, *p = 0.024 (two-way ANOVA). n) Left: All metastases arising in control mice are E-cad+. Only mG+ cell containing metastases in adeno-Cre transduced MMTV-PyMT; E-cadfl/fl transplant mice are E-cad-negative. Right: E-cad- cancer cells do not contribute to observable macro-metastases in adeno-Cre transduced MMTV-PyMT; E-cadfl/fl (FVB) transplant mice. Bar – median. ****p <0.0001 (Mann-Whitney test, two-sided).
Extended Data Fig. 5:
Extended Data Fig. 5:. Tamoxifen-inducible E-cad deletion increases invasion and decreases metastasis ex vivo and in vivo
a) Schema for tail vein injections using FACS sorted populations of purely E-cad+ or E-cad- cancer clusters. b) E-cad- cancer cell clusters form significantly fewer metastatic colonies compared to E-cad+ clusters. ***p = 0.0002 (Mann-Whitney test, two-sided). c) Schema for invasion assay using tamoxifen-treated MMTV-PyMT; E-cadfl/fl; CreER organoids. Control organoids were also tamoxifen-treated and were isolated from MMTV-PyMT; E-cadfl/fl tumors. d) Representative Western blot depicting E-cad protein levels (loading control on same gel; 3 replicates of E-cad were quantified for summary graph). Mean +/− SD. *p = 0.029 (Mann-Whitney test, two-sided). e) Representative DIC micrographs of collagen-embedded, tamoxifen-treated control and CreER expressing organoids. Arrowheads – dissemination events. Scale bar, 50 μm. f–g) Tamoxifen-treated organoids isolated from CreER expressing tumors are more invasive (f) and disseminative (g) than control organoids. 5–95 percentile. ****p<0.0001 (Mann-Whitney test, two-sided). h) Schematic of in-situ E-cad deletion. Organoids isolated from MMTV-PyMT; E-cadfl/fl and E-cadfl/fl; CreER tumors were transplanted into immunocompromised NSG mice. Once these mice developed tumors of up to 8–10mm, tamoxifen was injected intraperitoneally, and tumor growth was monitored bi-weekly. Tumors were harvested ~6-weeks post-transplantation. i) There is a decrease in tumor growth rates after E-cad deletion relative to control tumors. Mean +/− SEM. ****p<0.0001 by regression analysis. j) Representative tile-scan of a MMTV-PyMT; E-cadfl/fl; CreER primary tumor. Tamoxifen was injected to delete E-cad. mT+ cells did not express Cre and are E-cad+; mG+ cancer cells are E-cad-. Scale bar, 500 μm. Zoomed insets for E-cad+ (yellow box; scale bar, 50 μm) and E-cad- (grey box; scale bar, 50 μm) regions of the tumor boundary.
Extended Data Fig. 6:
Extended Data Fig. 6:. E-cad loss promotes invasion and suppresses metastasis in a basal model of IDC
a) Schematic of 3D invasion assay using C3(1)-Tag tumor organoids. E-cad deletion is induced by adeno-Cre. Control organoids are treated with adeno-GFP. b) Representative Western blot depicting protein levels of E-cad in adeno-GFP and adeno-Cre transduced C3(1)-Tag; E-cadfl/fl organoids (loading control on same gel; 4 replicates of E-cad were quantified for summary graph). Mean +/− SD, *p = 0.029 (Mann-Whitney test, two-sided). c) Representative timelapse DIC images of adeno-GFP and adeno-Cre transduced C3(1)-Tag; E-cadfl/fl tumor organoids. Scale bar, 50 μm. d) There is a significant increase in dissemination in adeno-Cre transduced C3(1)-Tag; E-cadfl/fl organoids relative to control organoids. 5–95 percentile; ****p <0.0001 (Mann-Whitney test, two-sided). e) Adeno-GFP or adeno-Cre transduced C31(1)-Tag; E-cadfl/fl organoids were transplanted into the cleared mammary fat pads of NSG mice. The tumor boundary was examined for invasive morphology. f) Left: Control C3(1)-Tag tumors typically organize and invade collectively. Right: Loss of E-cad causes an increase in invasion and dissemination at the tumor-stroma interface. Scale bar, 500μm. Zoomed insets of invasive borders. Scale bar, 100 μm. g) CTCs were isolated via cardiac puncture performed on NSG mice transplanted with adeno-GFP or adeno-Cre transduced C3(1)-Tag E-cadfl/fl organoids. There is a significant decrease in the number CTCs arising from E-cad- cancer cells. Representative images of E-cad+ and E-cad- CTCs. Scale bar, 20 μm. Bar – Median. *p = 0.026 (Mann-Whitney test, two-sided). h) Schema for transplant and tail vein assays using adeno-GFP or adeno-Cre transduced C3(1)-Tag E-cadfl/fl tumor organoids. All metastases in control mice are E-cad+ while only metastases containing mG+ cancer cells are E-cad-. i) Left: Representative micrographs of E-cad+ and E-cad- metastases arising in adeno-GFP and adeno-Cre transduced C3(1)-Tag; E-cadfl/fl transplant mice respectively. Scale bar, 50 μm. Right: E-cad- cancer cells rarely contribute to macro-metastases. Bar – median. **p = 0.002 (Mann-Whitney test, two-sided). j) Left: Whole lung images of metastases arising after tail-vein injections of adeno-GFP or adeno-Cre transduced cancer cell clusters isolated from C3(1)-Tag; E-cadfl/fl tumors (scale bar, 1cm), with zoomed insets for smaller lung areas. Arrowheads - metastases. Right: E-cad- cancer cells rarely contribute to metastases in tail vein assay. Bar – median. ****p<0.0001 (Mann-Whitney test, two-sided).
Extended Data Fig. 7:
Extended Data Fig. 7:. Loss of E-cad in a TNBC PDX increases invasion and dissemination but decreases colony formation
a) Gating strategy to isolate tumor cell clusters (2–4 cells each). b–c) Flow sorting strategy to isolate mT+ (E-cad+) tumor cell clusters from tamoxifen treated MMTV-PyMT; E-cadfl/fl organoids (b) or mG+ (E-cad-) tumor cell clusters from tamoxifen treated MMTV-PyMT; E-cadfl/fl; CreER organoids (c). Scale bar, 10μm. d) Organoids were isolated from a triple negative PDX tumor and were divided into three groups for treatment with lentiviral shRNA against luciferase or E-cad (two shRNA clones). Puromycin was used to positively select transduced cells. Organoids were embedded in 3D collagen I to assay their invasive phenotype. e) Representative Western blot depicting decreased levels of E-cad protein when treated with E-cad shRNA (loading control on same gel; 3 replicates of E-cad were quantified for summary graph). Mean +/− SD. *p = 0.02 (Kruskal Wallis test). f) Representative micrographs of PDX tumor organoids embedded in collagen I. Scale bar, 50 μm. g–h) Knockdown of E-cad in PDX organoids significantly increases invasion (g) and dissemination (h). Bar – median. ****p<0.0001, ***p = 0.0002 (Kruskal Wallis test). i) Schema for colony formation assay after E-cad knockdown in a triple-negative PDX model. j) Representative micrographs of colonies arising from Luc shRNA or E-cad shRNA (two shRNA clones) treated PDX-derived cancer cell clusters. Scale bar, 50 μm. k) Knockdown of E-cad in PDX-derived cancer cells decreases colony formation. *p = 0.034 (Kruskal Wallis test).
Extended Data Fig. 8:
Extended Data Fig. 8:. Loss of E-cad causes an increase in apoptosis and TGFβ signaling
a) Representative Western blot depicting no significant changes in total protein levels of the dormancy maker, COUP-TF1, in adeno-Cre transduced MMTV-PyMT; E-cad+/+ or E-cadfl/fl organoids (loading control on same gel; 3 replicates of NR2F1 were quantified for summary graph). Mean +/− SD. ****p <0.0001 (Mann-Whitney test, two-sided). b) RNA-seq was used to compare gene expression changes in adeno-Cre transduced MMTV-PyMT E-cad+/+ and E-cadfl/fl organoids. c) Heatmap of differentially expressed transcripts in adeno-Cre transduced MMTV-PyMT; E-cad+/+ and E-cadfl/fl tumor organoids RNA-seq was performed by comparing transcriptomes of 4 adeno-Cre treated MMTV-PyMT; E-cad+/+ organoids to 5 adeno-Cre treated MMTV-PyMT; E-cadfl/fl organoids. p-values were calculated for the Wald test. Genome-wide significance = 1.7 E-6 (FWER = 0.05). d) Schema of transcripts known to be involved in metastasis that are upregulated (red boxes) or downregulated (blue boxes) as a consequence of E-cad loss in MMTV-PyMT tumor organoids. e) Differentially expressed transcripts that have previously been shown to regulate apoptosis are highlighted (red) among all differential transcripts (black). All transcripts are represented in grey. RNA-seq was performed by comparing transcriptomes of 4 adeno-Cre treated MMTV-PyMT; E-cad+/+ organoids to 5 adeno-Cre treated MMTV-PyMT; E-cadfl/fl organoids. Raw p-values are reported without multiple testing correction. Fold change is reported as experimental/control for experimental > control and as -control/experimental for control > experimental. Genome wide significance = 1.7 E-6 (FWER = 0.05). Genome wide significance = 1.7 E-6 (FWER = 0.05).s f) Proportion of disseminating E-cad+ or E-cad- cancer cells displaying apoptotic morphologies. g) CC3 is localized to E-cad- disseminating cells in adeno-Cre transduced MMTV-PyMT; E-cadfl/fl tumor organoids (scale bar, 50 μm), with zoomed insets for the organoid bulk and disseminated cell (scale bar, 20 μm). Arrows – disseminated cell. h) Mean intensity of ROS in E-cad+ or E-cad- disseminated cells relative to the organoid bulk. ****p <0.0001, **p-value = 0.002 (Mann-Whitney test, two-sided). i) SMAD2/3 is diffusely expressed within E-cad+, MMTV-PyMT cancer cells, while it is nuclear localized after E-cad deletion. Scale bar, 20 μm. Observations were made across at least 3 independent tumors.
Extended Data Fig. 9:
Extended Data Fig. 9:. E-cad loss is associated with increased apoptosis at several stages of metastasis in vivo
a) CC3 immunoreactivity was used to detect the relative abundance of apoptosis in transplanted adeno-Cre transduced MMTV-PyMT; E-cad+/+ or E-cadfl/fl tumors. b) Representative micrographs of E-cad+ primary tumors depicting the rarity of CC3+ cancer cells within the tumor bulk, invasion, or dissemination events (zoomed insets; scale bar, 20 μm). Scale bar, 50 μm. c) Representative micrographs of E-cad- primary tumors depicting a significant proportion of CC3+ cancer cells within the tumor bulk, dissemination events, and invasion (zoomed insets; scale bar, 20 μm). Scale bar, 50 μm. d) The number of CC3+ cancer cells within E-cad- primary tumors increases significantly relative to E-cad+ primary tumors. Bar – median. ***p = 0.0008 (Mann-Whitney test, two-sided). e) Left: Representative micrographs marking CC3+ cancer cells within E-cad+ or E-cad- metastases. Scale bar, 20 μm. Arrowhead – CC3+, E-cad- metastasis. Right: There is a significant increase in the amount of apoptosis in E-cad- metastases relative to E-cad+ metastases. Bar – median. *p = 0.015 (Mann-Whitney test, two-sided). f) Schema of colony formation assay using MMTV-PyMT; E-cad+ or E-cad- cancer cells in the presence of 100 nM or 1 μM of doxorubicin, paclitaxel, and cisplatin. g) E-cad- cancer cells are no more or less sensitive to chemotherapies compared to E-cad+ cancer cells. Mean +/− SD. **p = 0.0065 (E-cad+), 0.0044 (E-cad-) and ***p = 0.0005 (Ecad+), 0.0003 (E-cad-) (Kruskal-Wallis test).
Extended Data Fig. 10:
Extended Data Fig. 10:. Effects of apoptosis, oxidative stress, and TGFβ inhibition on dissemination of E-cad+ or E-cad- MMTV-PyMT organoids
a) Schema of invasion assay in the presence of a pan-caspase inhibitor (z-VAD-FMK). b) Representative micrographs of adeno-Cre transduced MMTV-PyMT; E-cad+/+ or E-cadfl/fl organoids in the presence of z-VAD-FMK. Scale bar, 50 μm. c–d) There is a dose-dependent increase in invasion (c) and dissemination (d) of E-cadfl/fl organoids relative to control organoids in the presence of z-VAD-FMK. 5–95 percentile. ****p <0.0001 (Kruskal-Wallis test). e) Schema of invasion assay in the presence of NAC, soluble TGFβ, or TGFβR1 inhibitor. f) Representative images of tamoxifen treated MMTV-PyMT; E-cadfl/fl or E-cadfl/fl; CreER organoids in the presence of these inhibitors. Treatment with soluble TGFβ increases dissemination of E-cad+ and E-cad- organoids while inhibition of TGFβR1 decreases dissemination. Treatment with NAC does not change dissemination of E-cad+ or E-cad- organoids. Scale bar, 50 μm. 5–95 percentile. ****p<0.0001 (Kruskal-Wallis test). g) Schema of tail vein assays using NAC pre-treated E-cad+ or E-cad- cancer cell clusters. MMTV-PyMT; E-cadfl/fl organoids were treated with adeno-GFP or adeno-Cre, trypsinized into small clusters, incubated with NAC for 24 hours, and injected via the tail vein of NSG host mice. Lungs from these mice were harvested 48h or 1 week after injection and number of micro- and macro- metastases counted respectively. h) There is no significant difference in the number of micro-metastases arising from E-cad+ or E-cad- cancer cells after NAC pre-treatment. Bar – median. (Mann-Whitney test, two-sided). i) NAC pre-treatment partially rescued the ability of E-cad- cancer cells to form macro-metastases relative to E-cad+ cancer cells. Bar – median. **p = (Mann-Whitney test, two-sided).
Fig. 1:
Fig. 1:. E-cad loss increases invasion and dissemination into 3D collagen I
a) Schematic of 3D collagen I invasion assay using adeno-Cre treated organoids isolated from either MMTV-PyMT; E-cad+/+ or E-cadfl/fl tumors. b) Representative Western blot depicting reduced protein levels of E-cad, β-catenin, and αE-catenin in adeno-Cre transduced E-cadfl/fl organoids relative to control (loading control on same gel; 6 replicates of E-cad were quantified for summary graph). Mean +/− SD. **p = 0.0022 (Mann-Whitney test, two-sided). c) Representative timelapse DIC micrographs of adeno-Cre transduced E-cad+/+ and E-cadfl/fl organoids. Scale bar, 50 μm. d-e) There is a significant increase in (d) invasion and (e) dissemination of adeno-Cre transduced E-cadfl/fl organoids, relative to control organoids. 5–95 percentile; ****p <0.0001 (Mann-Whitney test, two-sided). f) Representative confocal images of adeno-Cre transduced E-cad+/+ and E-cadfl/fl organoids (scale bar, 50 μm) with zoomed insets for disseminated units (scale bar, 10 μm). g) Relative proportion of mT vs mG dissemination units in adeno-Cre treated E-cad+/+ and E-cadfl/fl organoids. Graph depicts mean +/− SD. nsp = 0.324 (two-way ANOVA). h) Relative proportion of single cell vs cluster dissemination in adeno-Cre treated E-cad+/+ and E-cadfl/fl organoids. Graph depicts mean +/− SD. ****p <0.0001 (two-way ANOVA).
Fig. 2:
Fig. 2:. E-cad loss inhibits metastasis
a) Adeno-Cre transduced MMTV-PyMT E-cad+/+ or E-cadfl/fl tumor organoids were transplanted into NSG mice. Lungs were harvested 6–8 weeks later, and metastases counted. All metastases arising in control mice are E-cad+. Only mG+ containing metastases in E-cadfl/fl transplant mice are E-cad-. b) E-cad- cancer cells rarely contribute to macro-metastases in E-cadfl/fl transplant mice. Bar – median. ****p-value<0.0001 (Mann-Whitney test, two-sided). c) As seen by immunofluorescence, metastases in control mice are E-cad+. mG+ metastases arising in E-cadfl/fl transplant mice are E-cad-. Scale bar, 50 μm. d) The number of mG+ micro-metastases is greatly reduced in E-cadfl/fl mice relative to control mice. Bar – median. ***p = 0.0003 (Mann-Whitney test, two-sided). e) Adeno-Cre transduced MMTV-PyMT; E-cad+/+ or E-cadfl/fl organoids were trypsinized into small clusters and injected via the tail vein of NSG mice. Lungs were harvested after 4 weeks and examined for macro-metastases. f) Whole lung micrographs of mT (Cre-) and mG (Cre+) metastases. Black box represents E-cad+ metastases in control mice. Green box represents E-cad- metastases in mice injected with adeno-Cre treated E-cadfl/fl cells. Scale bar, 1 cm. g) E-cad negative cancer cells rarely contribute to metastases in a tail-vein assay. Bar – median. ****p<0.0001 (Mann-Whitney test, two-sided). h) Left: Representative confocal images of PH3+ nuclei within mG+ (E-cad+) metastasis in control mice and mG+ (E-cad-) metastases in mice injected with adeno-Cre transduced E-cadfl/fl cell clusters. Arrowheads – PH3+ nuclei. Scale bar, 50 μm. Right: %PH3+ nuclei per metastasis is represented. Bar – median. ****p<0.0001 (Mann-Whitney test, two-sided).
Fig. 3:
Fig. 3:. E-cad loss decreases colony formation
a) Flow sorting strategy to isolate E-cad+ (mT+) or E-cad- (mG+) cancer cell clusters from MMTV-PyMT tumor mice. Colony formation potential was assessed after 7 days of culture in 3D Matrigel. b) Left: Representative DIC micrographs of colonies arising from E-cad+ and E-cad- cancer cell clusters (scale bar, 100 μm), with zoomed insets for individual colonies (scale bar, 50 μm). Right: E-cad- cancer cell clusters have decreased colony forming potential. Mean +/− SD. ****p<0.0001 (Mann-Whitney test, two-sided). c) Representative colonies stained for E-cad and DAPI. Scale bar, 20 μm. d) Colonies arising from E-cad- cancer cell clusters are smaller than control colonies. Bar – median. ****p<0.0001 (Mann-Whitney, two-sided). e) Left: Representative colonies stained for PH3 and DAPI. Arrowheads – PH3+ nuclei. Scale bar, 20 μm. Right: E-cad- colonies have a significantly lower %PH3+ nuclei. Bar – median. ****p <0.0001 (Mann-Whitney test, two-sided). f) CTCs were isolated via cardiac puncture performed on NSG mice transplanted with adeno-Cre treated MMTV-PyMT E-cad+/+ or E-cadfl/fl organoids. CTC enumeration was performed based on the mT/mG reporting of E-cad status. g) Top: There is a significant decrease in the number CTCs arising from E-cad- cancer cells. Bar – Median. ***p = 0.0005 (Mann-Whitney test, two-sided). Bottom: Representative images of E-cad+ and E-cad- CTCs. Scale bar, 20 μm. h) Adeno-Cre transduced E-cad+/+ or E-cadfl/fl organoids isolated from MMTV-PyMT tumor mice were trypsinized into small clusters and injected via the tail vein of NSG mice. Lungs from these mice were harvested after 48 hours, sectioned, and examined for micro-metastases. i) The number of mG+ micro-metastases in mice injected with adeno-Cre transduced E-cadfl/fl cancer cells were significantly lower than control, 48 hours post-injection. Bar – median. *p = 0.011 (Mann-Whitney test).
Fig. 4:
Fig. 4:. Disseminated E-cad- cells frequently undergo TGFβ-dependent ROS-mediated apoptosis
a) An E-cad-negative cancer cell disseminating from an adeno-Cre transduced MMTV-PyMT; E-cadfl/fl organoid exhibits classical morphological features of apoptosis (scale bar, 10 μm), with zoomed insets for the disseminating cell (scale bar, 5 μm). b) Relative proportions of apoptosis in E-cad+ or E-cad- cancer cells within the organoid bulk or disseminated cells. Bar – median; **p = 0.0016, ***p = 0.0004 (Mann-Whitney test, two-sided). c–d) Representative images depicting ROS levels within tamoxifen-treated organoids isolated from MMTV-PyMT E-cadfl/fl (c) or E-cadfl/fl; CreER (d) tumors (scale bar, 20 μm). From left to right: organoids were treated with ROS biosensor only, biosensor in addition to soluble TGFβ (4nM) or TGFβR1 inhibitor (SB525334; 1μM). Observations were made across at least 3 independent E-cadfl/fl or E-cadfl/fl; CreER tumors. e) The colony formation potential of E-cad+ or E-cad- cancer cells was tested in the presence of an apoptosis inhibitor (z-VAD-FMK), antioxidant (NAC), soluble TGFβ, or a TGFβ inhibitor. f) Top: Representative DIC micrographs of colonies arising from E-cad+ or E-cad- cancer cells in the presence of z-VAD-FMK (100μm), NAC (1mM), TGFβ (4nM), TGFβR1 inhibitor (1μM), or combination of TGFβR1 and NAC. Scale bar, 50 μm. Bottom: Representative images depicting relative ROS levels within colonies (distinct from the corresponding top row). Yellow lines – colony boundaries. Scale bar, 20 μm. g) Colony formation by E-cad- cancer cells is rescued by treatment with z-VAD-FMK, NAC or TGFβR1 inhibitor alone. NAC and TGFβR1 inhibitor also act together to provide a more complete rescue. Mean +/− SD. ****p<0.0001, ***p = 0.0003, **p = 0.002, *p = 0.046 by two-way ANOVA.

Comment in

Similar articles

Cited by

References

    1. Bogenrieder T & Herlyn M Axis of evil: molecular mechanisms of cancer metastasis. Oncogene 22, 6524–6536, (2003). - PubMed
    1. Berx G et al. E-cadherin is a tumour/invasion suppressor gene mutated in human lobular breast cancers. The EMBO journal 14, 6107–6115, (1995). - PMC - PubMed
    1. Frixen UH et al. E-cadherin-mediated cell-cell adhesion prevents invasiveness of human carcinoma cells. J Cell Biol 113, 173–185, (1991). - PMC - PubMed
    1. Li CI, Anderson BO, Daling JR & Moe RE Trends in incidence rates of invasive lobular and ductal breast carcinoma. JAMA 289, 1421–1424, (2003). - PubMed
    1. Nguyen-Ngoc KV et al. ECM microenvironment regulates collective migration and local dissemination in normal and malignant mammary epithelium. Proc Natl Acad Sci U S A 109, E2595–2604, (2012). - PMC - PubMed

REFERENCES (METHODS):

    1. Guy CT, Cardiff RD & Muller WJ Induction of mammary tumors by expression of polyomavirus middle T oncogene: a transgenic mouse model for metastatic disease. Mol Cell Biol 12, 954–961, (1992). - PMC - PubMed
    1. Maroulakou IG, Anver M, Garrett L & Green JE Prostate and mammary adenocarcinoma in transgenic mice carrying a rat C3(1) simian virus 40 large tumor antigen fusion gene. Proc Natl Acad Sci U S A 91, 11236–11240, (1994). - PMC - PubMed
    1. Muzumdar MD, Tasic B, Miyamichi K, Li L & Luo L A global double-fluorescent Cre reporter mouse. Genesis 45, 593–605, (2007). - PubMed
    1. Boussadia O, Kutsch S, Hierholzer A, Delmas V & Kemler R E-cadherin is a survival factor for the lactating mouse mammary gland. Mech Dev 115, 53–62, (2002). - PubMed
    1. Badea TC, Wang Y & Nathans J A noninvasive genetic/pharmacologic strategy for visualizing cell morphology and clonal relationships in the mouse. J Neurosci 23, 2314–2322, (2003). - PMC - PubMed