. 2019 Aug 22;75(4):807-822.e8.
doi: 10.1016/j.molcel.2019.07.023.

Non-canonical mTORC2 Signaling Regulates Brown Adipocyte Lipid Catabolism through SIRT6-FoxO1

Affiliations

Non-canonical mTORC2 Signaling Regulates Brown Adipocyte Lipid Catabolism through SIRT6-FoxO1

Su Myung Jung et al. Mol Cell. .

Abstract

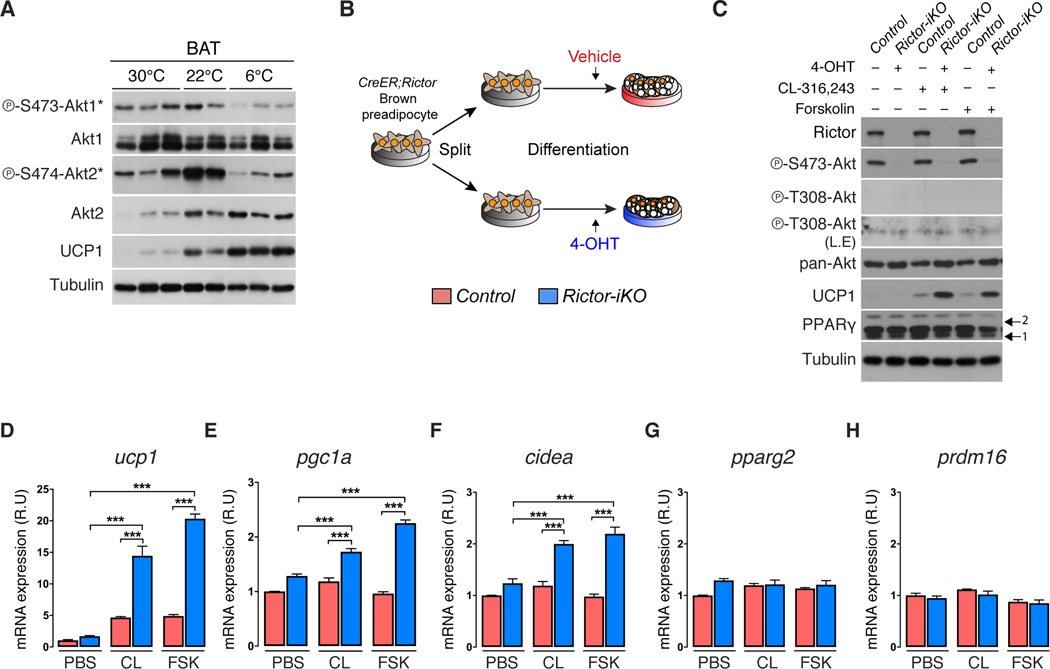
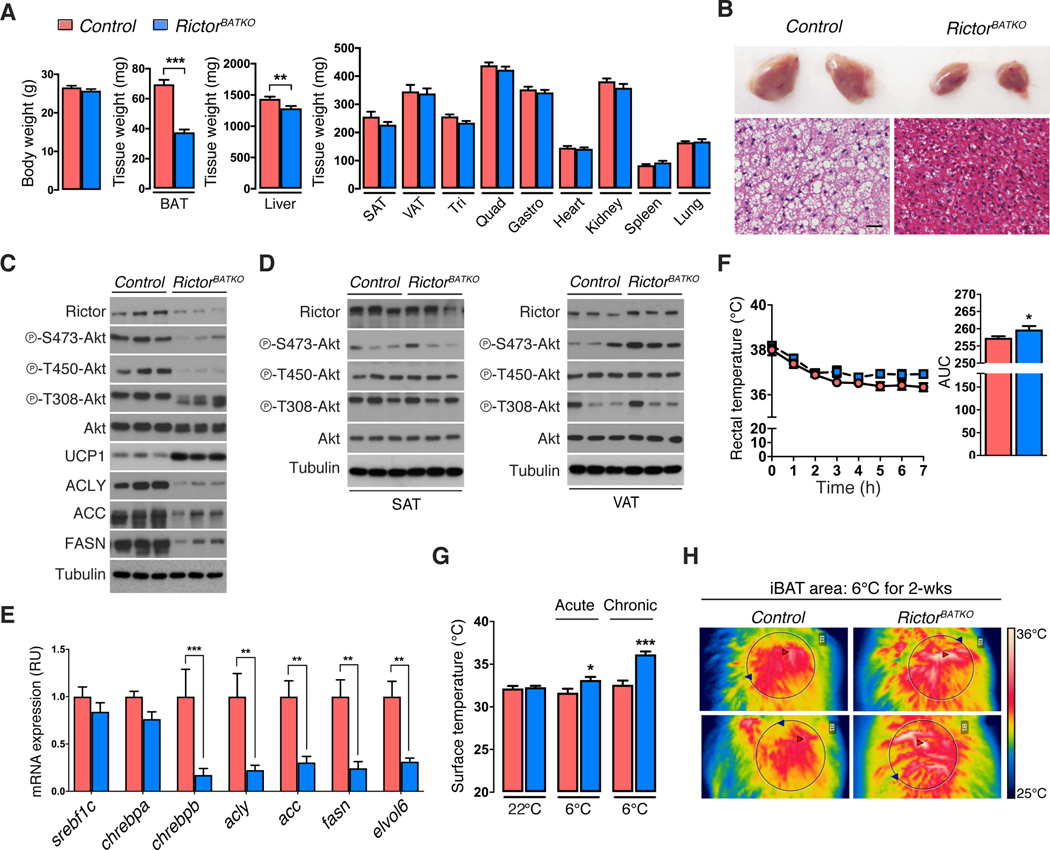
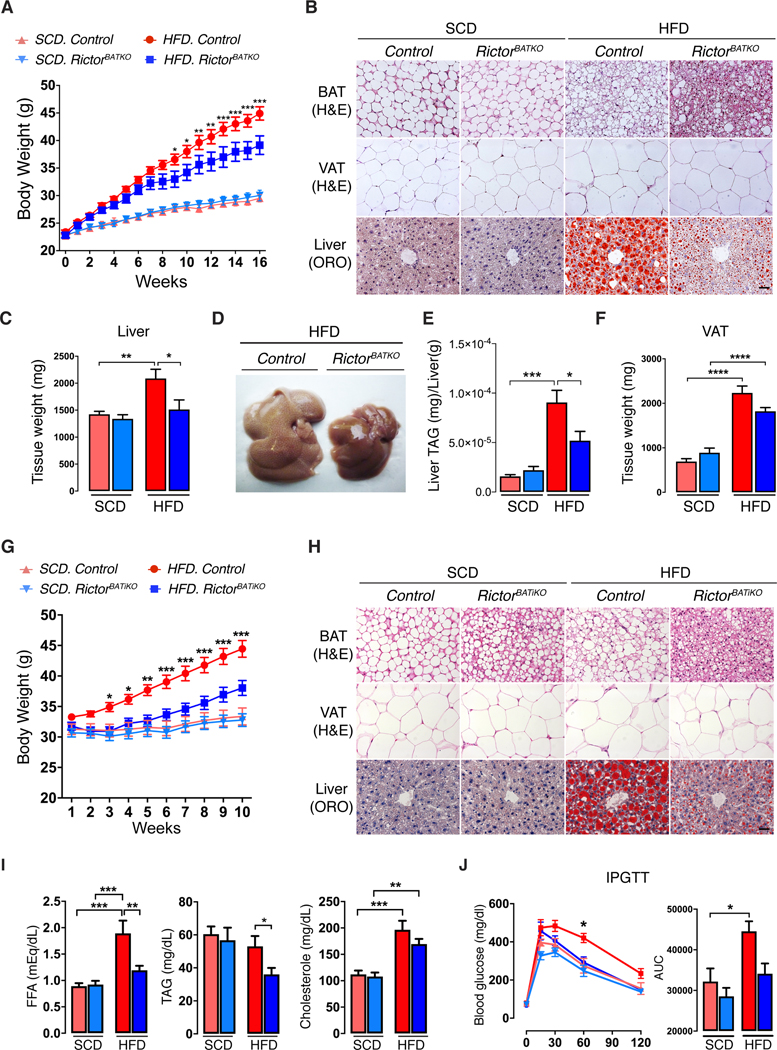
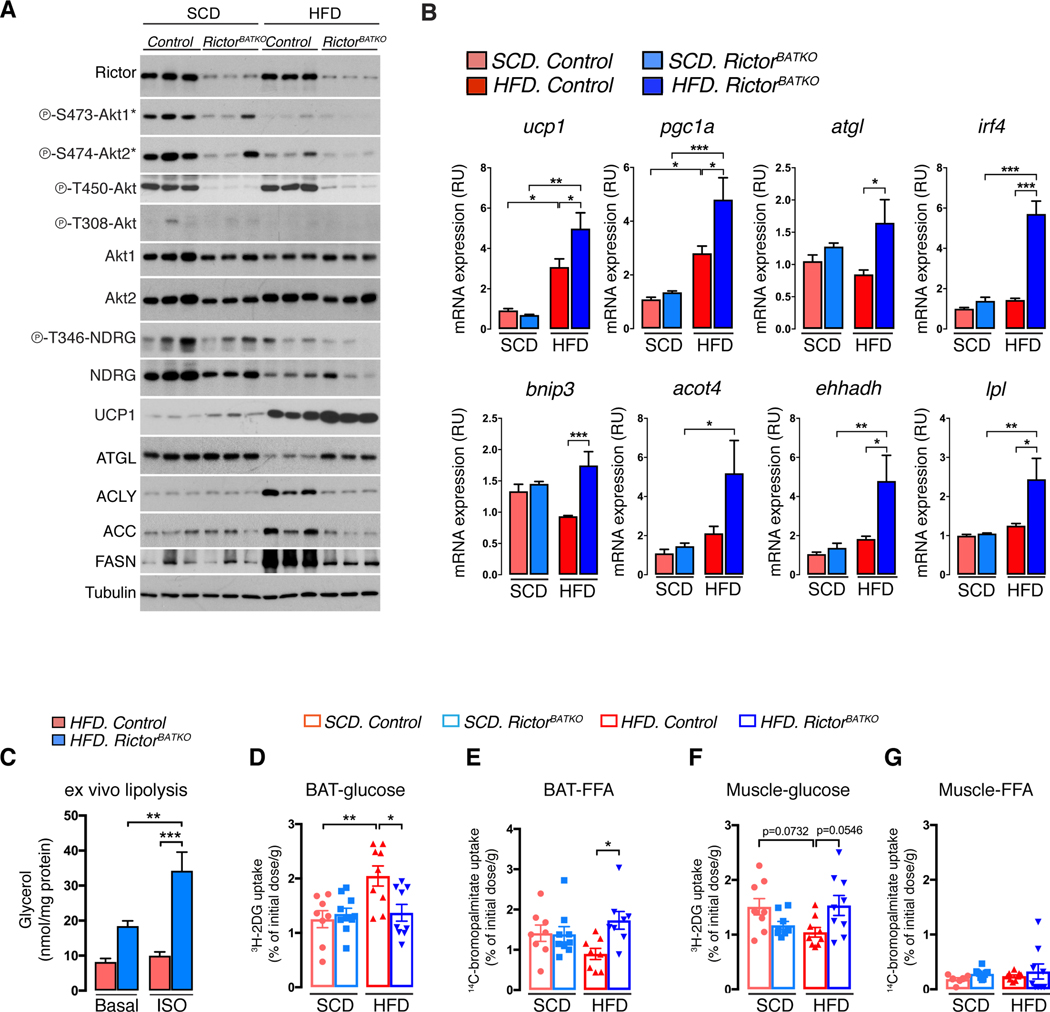
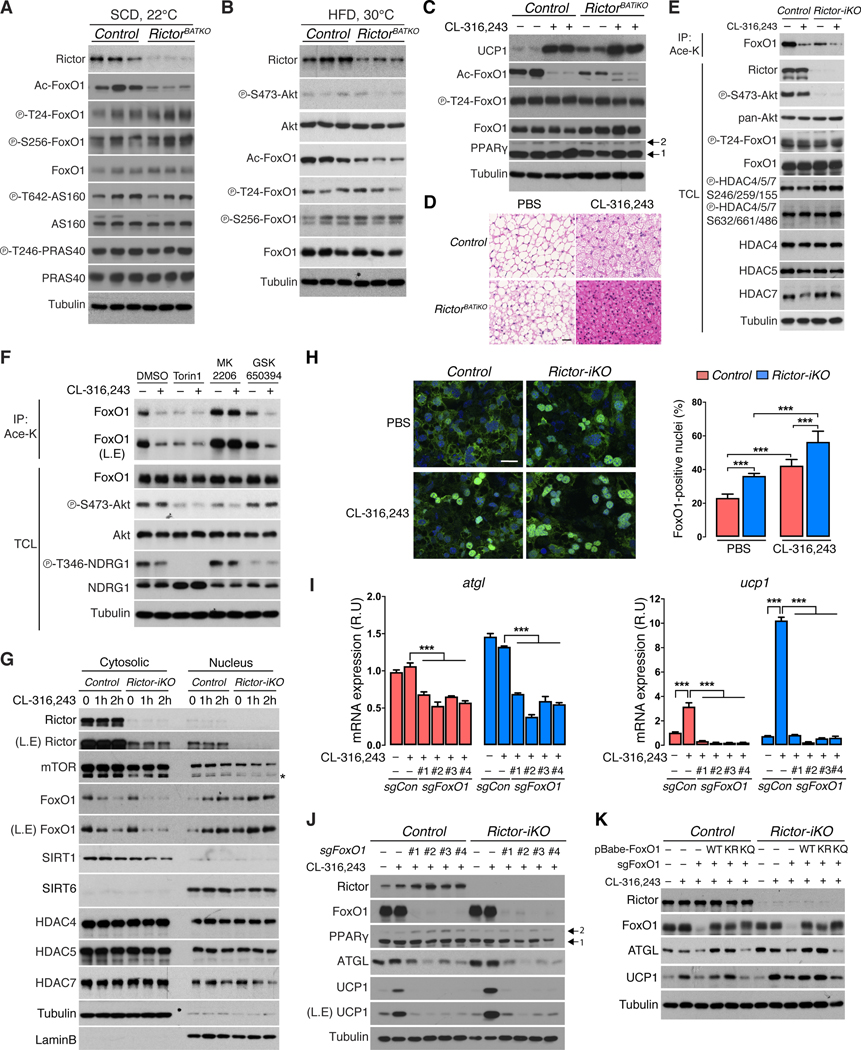
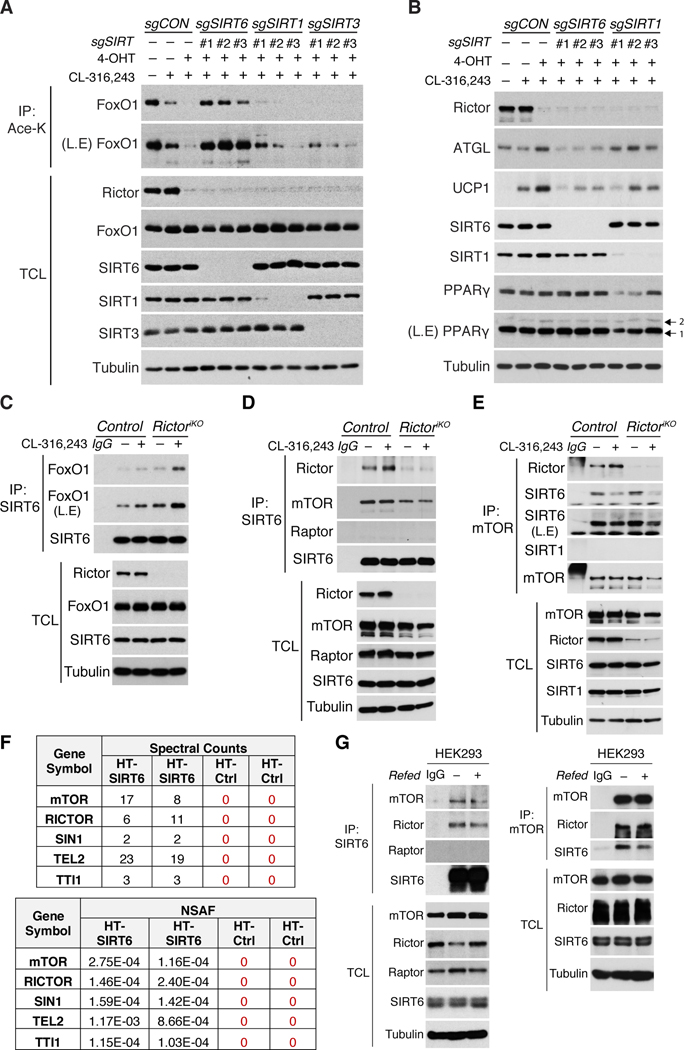
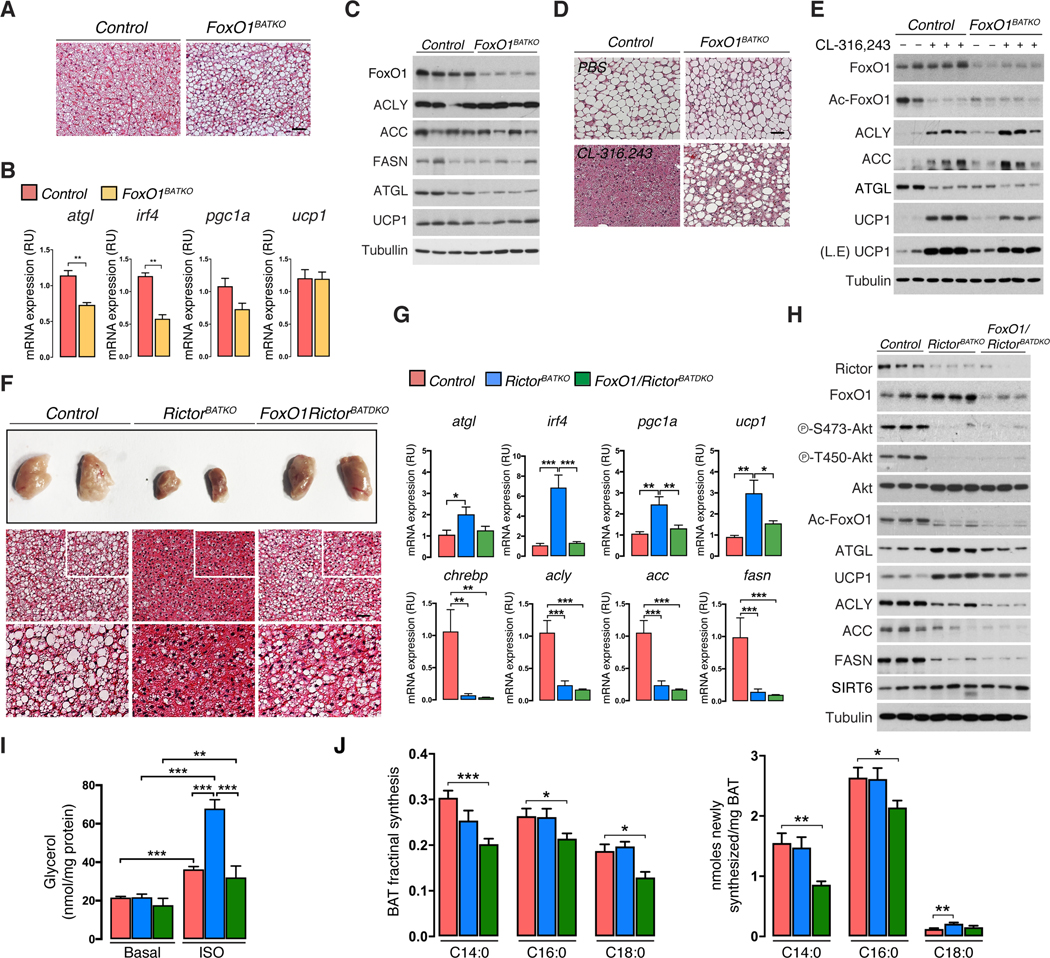
mTORC2 controls glucose and lipid metabolism, but the mechanisms are unclear. Here, we show that conditionally deleting the essential mTORC2 subunit Rictor in murine brown adipocytes inhibits de novo lipid synthesis, promotes lipid catabolism and thermogenesis, and protects against diet-induced obesity and hepatic steatosis. AKT kinases are the canonical mTORC2 substrates; however, deleting Rictor in brown adipocytes appears to drive lipid catabolism by promoting FoxO1 deacetylation independently of AKT, and in a pathway distinct from its positive role in anabolic lipid synthesis. This facilitates FoxO1 nuclear retention, enhances lipid uptake and lipolysis, and potentiates UCP1 expression. We provide evidence that SIRT6 is the FoxO1 deacetylase suppressed by mTORC2 and show an endogenous interaction between SIRT6 and mTORC2 in both mouse and human cells. Our findings suggest a new paradigm of mTORC2 function filling an important gap in our understanding of this more mysterious mTOR complex.

Keywords: ATGL; FoxO1; Rictor; Sirt6; UCP1; acetylation; adipocyte; brown adipose tissue; brown fat; lipid; mTOR; mTORC2; metabolism; signaling.


Conflict of interest statement

Conflicts of interests

The authors declare no conflicts of interest.

Figures

Figure 1.
Figure 1.. mTORC2 suppresses UCP1 expression in vitro.
(A) Western blots of the indicated proteins using BAT lysates from wild type 14-week-old male C57/BL6J mice adapted to thermoneutrality (30°C) for 4 weeks, mild cold (22°C), or severe cold (6°C) for 2 weeks. Mice were fed a standard chow diet ad libitum. The (*) indicates isoform-specific phospho-antibodies for AKT1 or AKT2 (B) Experimental strategy for inducing Rictor deletion in mature brown adipocytes. Vehicle or 4-hydroxy-tamoxifen (4-OHT) is administered late during differentiation (Day-6 of differentiation) to achieve fully differentiated cells acutely deleted for Rictor (also see methods). (C) Western blot showing CL-316,243 (0.1μM, 8h) or Forskolin (1μM, 8h) stimulated UCP1 expression in Rictor-iKO brown adipocytes compared to their isogenic controls. L.E.=long exposure. Arrows indicate the PPARγ1 and 2 isoforms. (D-H) qRT-PCR analysis showing CL-316,243 (CL, 0.1μM, 8h) or Forskolin (FSK, 1μM, 8h) stimulated gene expression in Rictor-iKO brown adipocytes compared to their isogenic controls (n=3). PBS=phosphate buffered saline control. Data are mean ± SEM. Statistical significance was calculated using two-way ANOVA with the Tukey’s multiple comparisons test; *P < 0.05, **P < 0.01, ***P < 0.001 (D-H: Control vs. Rictor-iKO, PBS treated vs. CL- or FSK- treated)
Figure 2.
Figure 2.. Increased cold tolerance and UCP1 expression in RictorBATKO mice.
(A) Tissue mass data from RictorBATKO mice and controls under standard conditions (22°C, fed ad libitum with a standard chow diet, 14-week-old males, n=11). (B) Top: Representative photograph of the interscapular BAT (iBAT) depots from a RictorBATKO mouse and a littermate control living in standard conditions. Bottom: representative H&E staining images. Scale bar, 100μm. (C) Western blots in triplicate using total BAT lysates from RictorBATKO mice and controls living in standard conditions. (D) Same as (C) except using subcutaneous adipose tissue (SAT) and visceral adipose tissue (VAT) depots. (E) -PCR analysis using BAT from RictorBATKO mice and controls living in standard conditions (n=8). (F) Rectal temperatures during an acute cold challenge (6°C) starting from 22°C (fed ad libitum with a standard chow diet, 10-week-old males, n=9–10). (G) Infrared thermography of the skin surface temperature directly above the iBAT depot from mice acclimated to 6°C for 7h (acute) or 2 weeks (chronic) (n=4–8). (H) Representative images from (G). Data are mean ± SEM. Statistical significance was calculated using two-tailed unpaired Student’s t-test (A),(F, right), two-way ANOVA with the Sidak’s multiple comparisons test (E,G), two-way repeated-measures ANOVA with the Sidak’s multiple comparisons test (F, left); *P < 0.05, **P < 0.01, ***P < 0.001 (Control vs. RictorBATKO).
Figure 3.
Figure 3.. RictorBATKO mice are protected from diet-induced obesity at thermoneutrality.
(A) Growth curves of RictorBATKO mice and controls living at 30°C and eating either standard chow diet (SCD) or high fat diet (HFD); n=8–12 male mice per group. (B) Representative H&E (BAT, VAT) and Oil-Red O (Liver) staining images from mice in (A). Scale bar, 100 μm. (C) Average liver mass of mice in (A, n=8–12). (D) Representative photograph of livers from HFD-fed control and RictorBATKO mice in (A). (E) Corresponding liver TAG quantification for panel (D) (n=7). (F) Visceral adipose tissue (VAT) mass of mice in (A, n=8–12). (G) Growth curves of RictorBATiKO (i.e. Ucp1-CreER;Rictor) mice and controls living at 30°C and eating either SCD or HFD. Rictor deletion was induced at 10-weeks of age with Tamoxifen. Mice were then acclimated at 30°C for 1 week before being placed on SCD or HFD; n=13–18 male mice per group. (H) Representative H&E (BAT, VAT) and Oil-Red O (Liver) staining images from mice in (G). Scale bar, 100 μm. (I) Blood Free fatty acid (FFA), triglyceride (TAG), and cholesterol, measurements from mice in (G) (n=6–8). (J) Glucose tolerance test (GTT) of mice in (G) after 10-weeks of HFD. SCD (n=7–9), HFD (n=7–8). Data are mean ± SEM. Statistical significance was calculated using two-way repeated-measures ANOVA with the Tukey’s multiple comparisons test (A,G,J), two-way ANOVA with the Tukey’s multiple comparisons test (C,E,F,I,J); *P < 0.05, **P < 0.01, ***P < 0.001 (HFD-Control vs. HFD-RictorBATKO for A,G,J; SCD vs. HFD, Control vs. RictorBATKO or Control vs. RictorBATiKO for C,E,F,I,J).
Figure 4.
Figure 4.. Inhibiting BAT mTORC2 reprograms metabolism to favor lipid uptake and catabolism
(A) Western blot analysis using BAT lysates mice that were fasted (O/N) then refed for 1 hour. Mice were living at 30°C and eating SCD or HFD for 8 weeks prior to harvesting the tissue (18w males, n=3). (B) qRT-PCR analysis using BAT from mice in (A) (n=6–8). (C) Ex vivo lipolysis assay, either basal or after isoproterenol stimulation (ISO), using BAT from RictorBATKO and controls after 8 weeks on HFD at 30°C (n=8). (D) In vivo 3H-2-deoxy-glucose uptake assay into BAT. Mice were living at 30°C and eating SCD or HFD for 8 to 16-weeks prior to measuring (n=8–10). (E) In vivo 14bromo-palmitate uptake assay (n=8–10). (F) In vivo 3H-2-deoxy-glucose uptake assay into skeletal muscle (quadriceps) (n=8–10). (G) In vivo 14bromo-palmitate uptake assay into skeletal muscle (quadriceps) (n=8–10). Data are mean ± SEM. Statistical significance was calculated using two-way ANOVA with the Tukey’s multiple comparisons test (B-G); *P < 0.05, **P < 0.01, ***P < 0.001 (SCD vs. HFD, Control vs. RictorBATKO, Basal vs. ISO-treated)
Figure 5.
Figure 5.. mTORC2 loss and β-adrenergic receptor signaling promote FoxO1 deacetylation and nuclear localization.
(A) Western blot analysis using BAT lysates from fasted/refed RictorBATKO and control mice living at 22°C and eating SCD (14w males, n=3). (B) Western blot analysis using BAT lysates of fasted/refed RictorBATKO and control mice living at 30°C and eating HFD for 8 weeks (18w males, n=3). (C) Western blot analysis using BAT from RictorBATKO and control mice living at 30°C treated with PBS or CL-316,243 (0.5mg/kg, n=2) for three days. Arrows indicate PPARγ isoforms. (D) Representative H&E staining images from (C). Scale bar, 100 μm. (E) Immunoprecipitation assay using an anti-acetyl-lysine antibody (Ace-K) and blotting for total FoxO1 from CL-316,243-stimulated (1μM, 2h) control and Rictor-iKO brown adipocytes. Total cell lysate (TCL) was also probed with the indicated antibodies. (F) Immunoprecipitation assay as in (E). Cells were pretreated for 1 hour with Torin1 (50nM), MK2206 (0.5μM), or GSK650394 (1μM, O/N) followed by CL-316,243 treatment (1μM, 2h). (G) Western blot analysis of the cytoplasmic and nuclear fractions of Rictor-iKO brown adipocytes and controls treated with CL-316,243 (1μM) for 1 or 2 hours. Tubulin and Lamin B are used to control for fraction purity. (H) Immunofluorescence analysis of control and Rictor-iKO brown adipocytes treated with vehicle (PBS) or CL-316,243 (1μM, 1h, n=6). Anti-FoxO1 antibody (green), DAPI (blue), and the corresponding quantification (right panel) is shown. Scale bar, 25 μm (I) qRT-PCR analysis from Rictor-iKO brown adipocytes and controls, with or without CL-316,243 stimulation and deleted for FoxO1 by CRISPR/Cas9 using 4-independent sgRNAs (n=3). (J) Corresponding Western blot analysis from (I). Arrows indicate the PPARγ isoforms. (K) Western blot of lysates from control or Rictor-iKO brown adipocytes in which endogenous FoxO1 was deleted (sgFoxo1) and cells were reconstituted with FoxO1-WT, FoxO1–6KR, or FoxO1–6KQ mutant constructs. Data are mean ± SEM. Statistical significance was calculated using two-way ANOVA with the Tukey’s multiple comparisons test; *P < 0.05, **P < 0.01, ***P < 0.001 (PBS vs. CL-316,243-treated, Control vs. Rictor-iKO, sgControl vs. sgFoxO1). L.E.=long exposure
Figure 6.
Figure 6.. SIRT6 interacts with mTORC2 and FoxO1, and is necessary for FoxO1 deacetylation upon β-adrenergic stimulation or Rictor loss.
(A) Immunoprecipitation assay using an anti-acetyl-lysine antibody (Ace-K) and blotting for total FoxO1 from CL-316,243-stimulated (1μM, 2h) Rictor-iKO brown adipocytes in which SIRT6, SIRT1, or SIRT3 were also ablated by CRISPR/Cas9 using 3-independent sgRNAs each. (B) Western blot analysis of CL-316,243-stimulated (1μM, 8h) Rictor-iKO brown adipocytes expressing 3-independent sgRNAs each targeting SIRT6 or SIRT1. (C) Endogenous SIRT6 immunoprecipitation (IP) from control and Rictor-iKO brown adipocytes under basal, CL-316,243-stimulated (1μM, 2h), Rictor-deleted, or combined CL-316,243 and Rictor-deleted conditions. Endogenous FoxO1 is also probed in the SIRT6 IP. (D) Endogenous SIRT6 immunoprecipitation (IP) from control and Rictor-iKO brown adipocytes. Cells were stimulated with CL-316,243-stimulated (1μM, 2h). Endogenous Rictor and mTOR is also probed in the SIRT6 IP. (E) Endogenous mTOR immunoprecipitation (IP) from control and Rictor-iKO brown adipocytes as in (D). Endogenous Rictor and SIRT6 are also probed in the mTOR IP. (F) Affinity pull down-MS data from Halo-Tag SIRT6 expressing HEK293 cells identifying mTORC2 subunits (mTOR, Rictor, Sin1) and assembly factors (Tel2, TTI1) as SIRT6 interactors (see also Methods). Spectral counts (SpC) and normalized spectral abundance factors (NSAFs) from two biological replicates are shown for Halo-Tag SIRT6 and Halo-Tag alone control. (G) Endogenous SIRT6 IP (left) and mTOR IP (right) using HEK293 lysates. IgG is the negative control. L.E.=long exposure, TCL=total cell lysate.
Figure 7.
Figure 7.. FoxO1 reprograms catabolic, but not anabolic, lipid metabolism upon mTORC2 loss in vivo.
(A) Representative H&E staining images of BAT from FoxO1BATKO and controls under standard condition (22°C, SCD, 8w males). Scale bar, 100 μm. (B) Quantitative RT-PCR analysis using BAT from fasted/refed FoxO1BATKO and control mice at (22°C, SCD, 8w males, n=5–6). (C) Western blot analysis corresponding to (B) (8w males, n=4). (D) Representative H&E staining images of BAT from FoxO1BATKO and control mice living at 30°C and treated with PBS or CL-316,243 (0.5mg/kg) for three days. (E) Corresponding western blot analysis for panel (D); n=2–3. (F) Representative photograph and H&E staining images of BAT from control, Rictor BATKO, and FoxO1;RictorBATDKO mice under standard conditions (8w males, n=5–6). White box insert corresponds to the enlarged H&E images below. Scale bar, 100 μm. (G) qRT-PCR analysis of BAT from (F) (8w males, n=6–8). (H) Western blot analysis for panel (G), (8w males, n=3). (I) Ex vivo lipolysis assay of BAT under basal or isoproterenol-stimulated (ISO) conditions (22°C, SCD, 8w males, n=8). (J) Heavy water (D2O) labeling showing the fraction (left) and quantification (right) of de novo synthesized fatty acid species (C14:0, C16:0, C18:0) in BAT (22°C, SCD, 8w males, n=6–9). Data are mean ± SEM. Statistical significance was calculated using Mann-Whitney test (B), one-way ANOVA with Tukey’s multiple comparisons test (G), two-way ANOVA with Tukey’s multiple comparisons test (I), Multiple t-test (J); *P < 0.05, **P < 0.01, ***P < 0.001 (Control vs. FoxO1BATKO, Control vs. RictorBATKO vs. FoxO1/RictorBATDKO, Basal vs. ISO-treated).

Similar articles

Cited by

References

    1. BARQUISSAU V, BEUZELIN D, PISANI DF, BERANGER GE, MAIRAL A, MONTAGNER A, ROUSSEL B, TAVERNIER G, MARQUES MA, MORO C, GUILLOU H, AMRI EZ & LANGIN D. 2016. White-to-brite conversion in human adipocytes promotes metabolic reprogramming towards fatty acid anabolic and catabolic pathways. Mol Metab, 5, 352–365. - PMC - PubMed
    1. CANNON B. & NEDERGAARD J. 2004. Brown adipose tissue: function and physiological significance. Physiol Rev, 84, 277–359. - PubMed
    1. CANNON B. & NEDERGAARD J. 2011. Nonshivering thermogenesis and its adequate measurement in metabolic studies. J Exp Biol, 214, 242–53. - PubMed
    1. CANTO C, MENZIES KJ & AUWERX J. 2015. NAD(+) Metabolism and the Control of Energy Homeostasis: A Balancing Act between Mitochondria and the Nucleus. Cell Metab, 22, 31–53. - PMC - PubMed
    1. CHAKRABARTI P. & KANDROR KV 2009. FoxO1 controls insulin-dependent adipose triglyceride lipase (ATGL) expression and lipolysis in adipocytes. J Biol Chem, 284, 13296–300. - PMC - PubMed

Publication types

MeSH terms