. 2020 Apr 24;12(3):216-229.
doi: 10.1093/jmcb/mjz048.

The molecular chaperone Hsp90α deficiency causes retinal degeneration by disrupting Golgi organization and vesicle transportation in photoreceptors

Affiliations

The molecular chaperone Hsp90α deficiency causes retinal degeneration by disrupting Golgi organization and vesicle transportation in photoreceptors

Yuan Wu et al. J Mol Cell Biol. .

Abstract

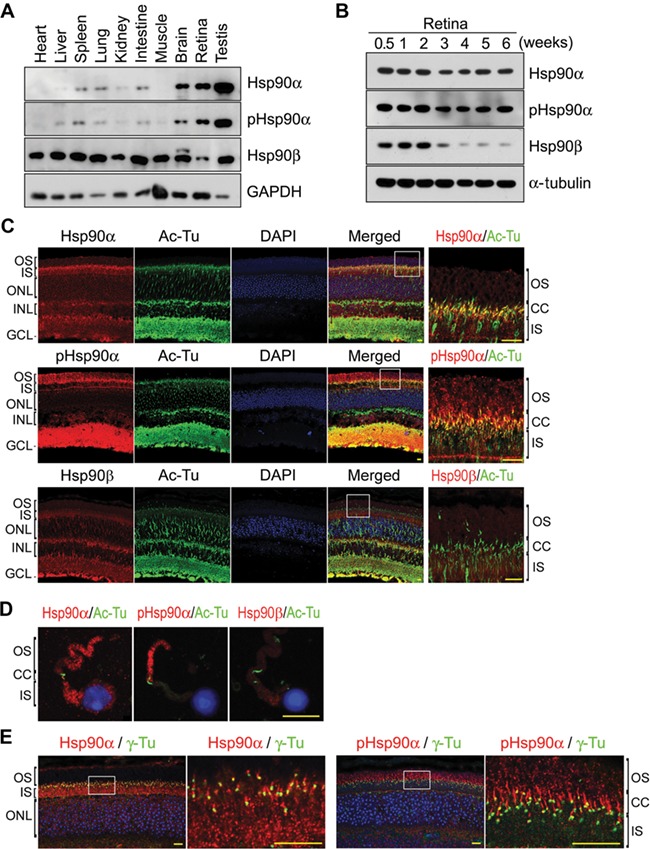
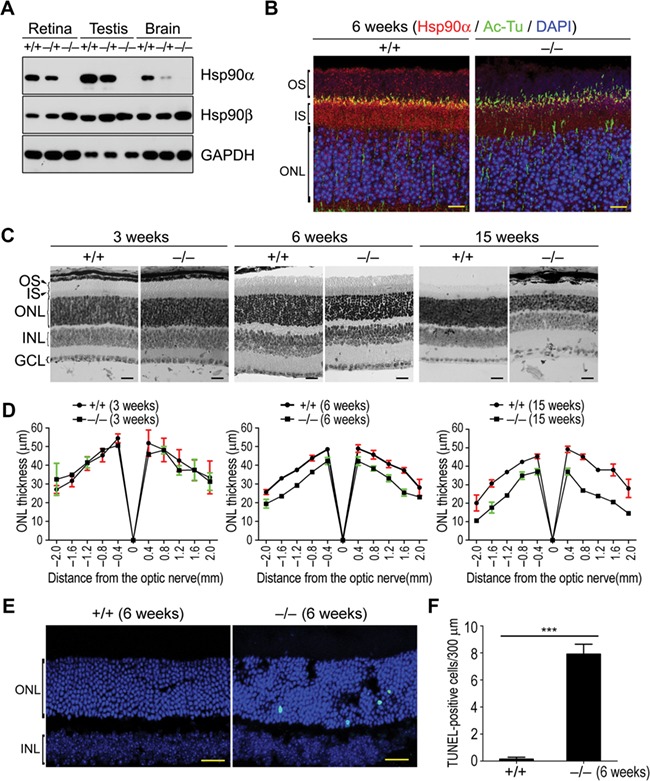
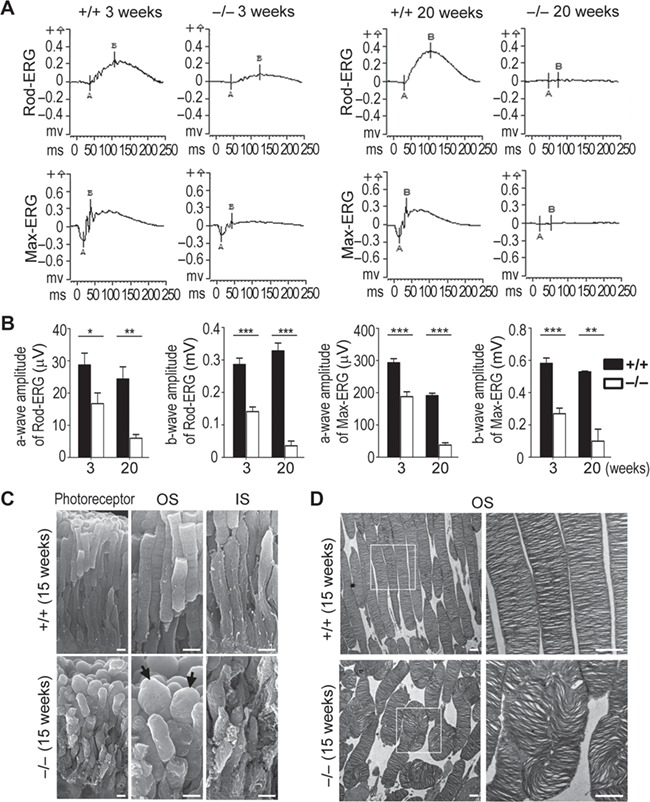
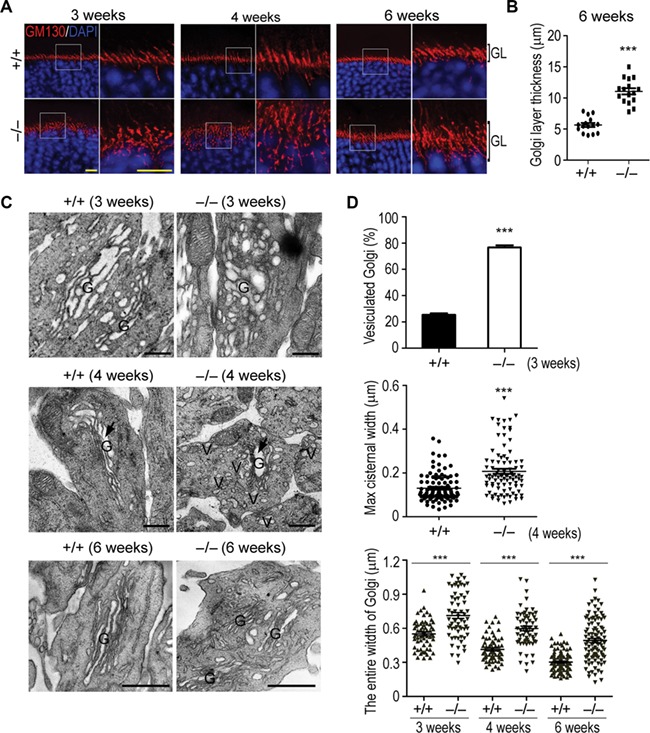
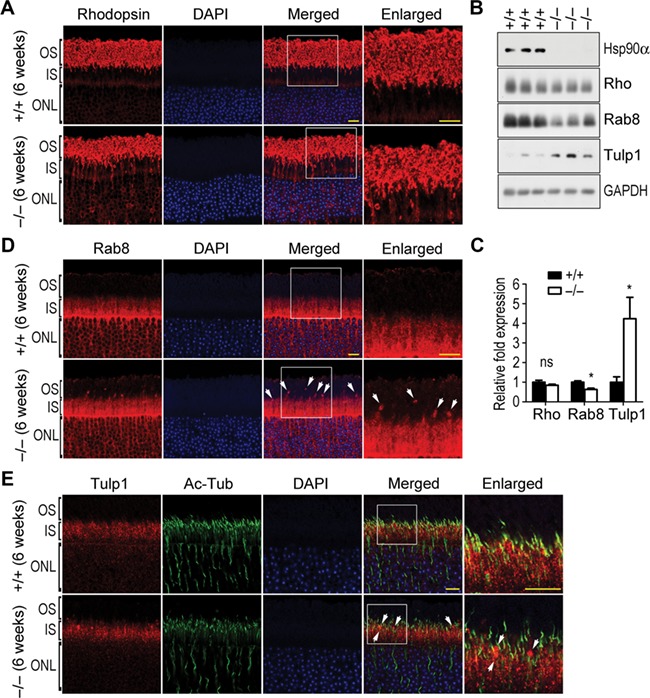
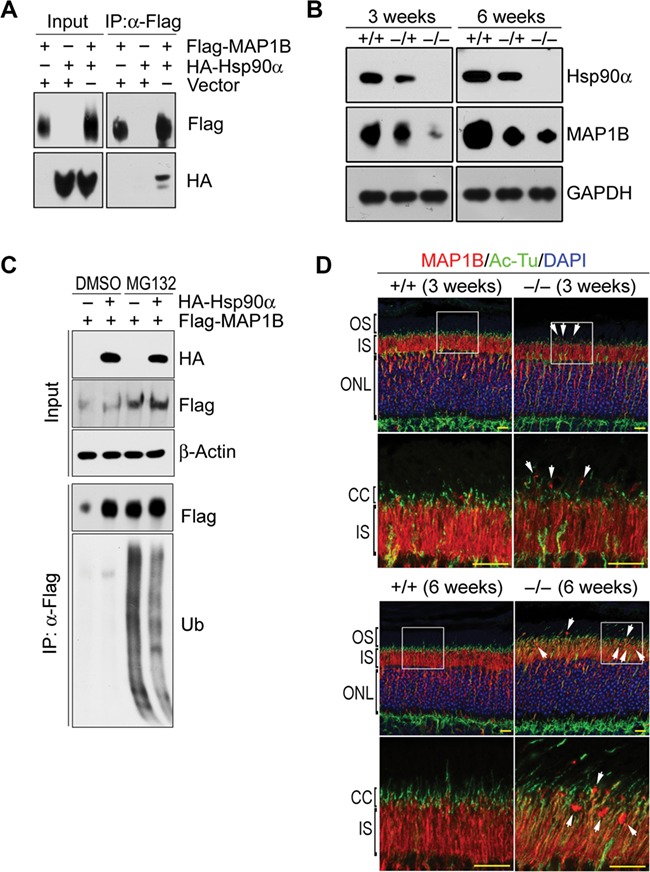
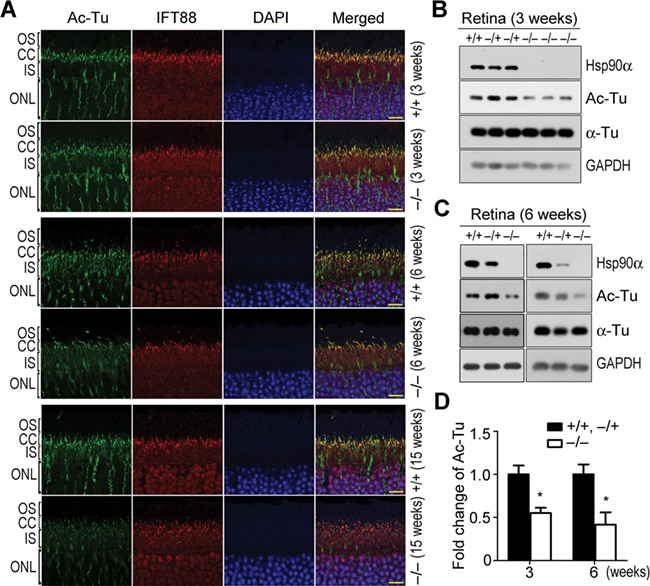
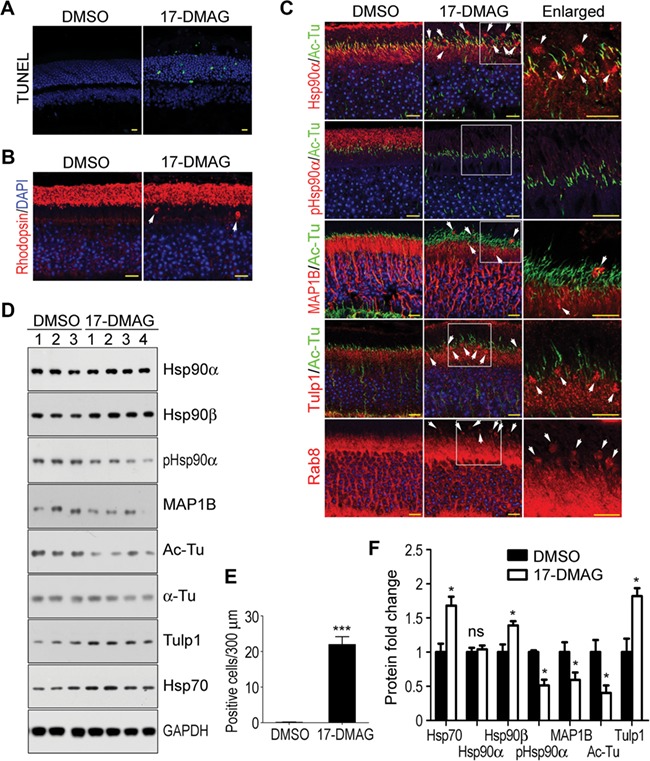
Heat shock protein 90 (Hsp90) is an abundant molecular chaperone with two isoforms, Hsp90α and Hsp90β. Hsp90β deficiency causes embryonic lethality, whereas Hsp90α deficiency causes few abnormities except male sterility. In this paper, we reported that Hsp90α was exclusively expressed in the retina, testis, and brain. Its deficiency caused retinitis pigmentosa (RP), a disease leading to blindness. In Hsp90α-deficient mice, the retina was deteriorated and the outer segment of photoreceptor was deformed. Immunofluorescence staining and electron microscopic analysis revealed disintegrated Golgi and aberrant intersegmental vesicle transportation in Hsp90α-deficient photoreceptors. Proteomic analysis identified microtubule-associated protein 1B (MAP1B) as an Hsp90α-associated protein in photoreceptors. Hspα deficiency increased degradation of MAP1B by inducing its ubiquitination, causing α-tubulin deacetylation and microtubule destabilization. Furthermore, the treatment of wild-type mice with 17-DMAG, an Hsp90 inhibitor of geldanamycin derivative, induced the same retinal degeneration as Hsp90α deficiency. Taken together, the microtubule destabilization could be the underlying reason for Hsp90α deficiency-induced RP.

Keywords: Golgi disintegration; Hsp90α; MAP1B; acetylated α-tubulin; cytoskeleton; microtubule; retinitis pigmentosa; vesicle transportation.


Figures

Figure 1
Figure 1
Expression of Hsp90 in the retina. Scale bar, 10 μm. (A) The expression of Hsp90α and Hsp90β in mouse tissues. Tissues were isolated from wild-type C57BL/6 mice at 6 weeks of age. An equal amount of protein was loaded for each tissue on SDS–PAGE. (B) The expression of Hsp90α and Hsp90β in developing retinas. The retinas were isolated from wild-type C57BL/6 mice at the indicated ages. (C) Immunofluorescence staining of mouse retina for Hsp90α and Hsp90β. Retinal sections of wild-type C57BL/6 mice at the age of 6 weeks were stained with antibodies against Hsp90α, Hsp90β, and Thr5/Thr7 phosphorylated Hsp90α (pHsp90α). Acetylated α-tubulin (Ac-Tu) was stained to show CC. The boxed areas are enlarged to show details. (D) Immunofluorescence staining for Hsp90α and Hsp90β in rod cells isolated from wild-type C57BL/6 mice at the age of 6 weeks. (E) Immunofluorescence staining for Hsp90α and the basal body of CC. Retinal sections were stained for γ-tubulin (γ-Tu) to show basal body. The boxed areas are enlarged to show details.
Figure 2
Figure 2
Retinal degeneration and photoreceptor apoptosis in Hsp90α-deficient mice. (A) The expression of Hsp90α in wild-type, heterozygous, and homozygous Hsp90α-deficient mice. +/+, −/+, and −/− indicate wild-type mouse, heterozygote, and homozygote, respectively. Mice were 6 weeks old. (B) Immunofluorescence staining for Hsp90α on retinal sections of wild-type and homozygous Hsp90α-deficient mice. Scale bar, 10 μm. (C) Histological examination of the retina in Hsp90α-deficient mice at different ages (3, 6, and 15 weeks). Scale bar, 20 μm. (D) Spider plot of ONL thickness. The retinas of Hsp90α-deficient mice or wild-type littermates were analyzed for ONL thickness. Each point represents mean ± SEM. The data were obtained from three mice at 6 weeks or 15 weeks of age and two mice at 3 weeks of age for each group. (E) Photoreceptor apoptosis in Hsp90α-deficient mice. Retinal sections were stained by TUNEL. Scale bar, 25 μm. (F) Quantification of TUNEL-positive cells in the retina. Data are mean ± SEM of the results obtained from three mice for each group. ***P < 0.001 (Student’s t-test).
Figure 3
Figure 3
Decreased ERG response and deteriorated photoreceptor in Hsp90α-deficient mice. (A) ERG was recorded for Hsp90α-deficient mice or their wild-type littermates at postnatal 3 and 20 weeks. The rod-ERG and max-ERG were recorded in order. (B) Statistical analysis of ERG amplitudes. The amplitudes of a-wave and b-wave of rod-ERG and max-ERG were analyzed. Data are mean ± SEM of the results obtained from 10 mice at the age of 3 weeks and 3 mice at 20 weeks for each group. Student’s t-test, *P < 0.05, **P < 0.01, ***P < 0.001. (C) SEM observation of deformed photoreceptors in 15-week Hsp90α-deficient mice. The black arrows point to the bulged OSs in Hsp90α-deficient mice. Scale bar, 2 μm. (D) TEM observation of OS discs in photoreceptors of 15-week Hsp90α-deficient mice. The boxed areas are enlarged to show details. Scale bar, 1 μm.
Figure 4
Figure 4
Golgi disintegration in photoreceptors of Hsp90α-deficient mice. (A) Golgi apparatus in photoreceptors of Hsp90α-deficient mice. Retinal sections of Hsp90α-deficient mice (−/−) or wild-type littermates (+/+) were stained for GM130, a cis-Golgi marker. Mouse ages (3, 4, and 6 weeks) are indicated. The boxed areas are enlarged to show details. GL, photoreceptor Golgi layer. Scale bar, 10 μm. (B) Quantification of Golgi layer thickness in photoreceptors of 6-week Hsp90α-deficient mice or wild-type littermates. Golgi layer thickness of photoreceptors was measured in three visual fields per mouse and 5 mice were analyzed for each group. Data are mean ± SEM. ***P < 0.001 (Student’s t-test). (C) TEM observation of Golgi apparatus in photoreceptors of Hsp90α-deficient mice. G, Golgi; V, Golgi-deriving vesicles. The black arrows indicate the maximum cisternal lumen of Golgi in the micrographs. Scale bar, 0.5 μm. (D) The statistical analyses of photoreceptor Golgi parameters in wild-type and Hsp90α-deficient mice at the indicated ages. Quantification of vesiculated photoreceptor Golgi in 3-week Hsp90α-deficient or wild-type mice was obtained from 3 mice and at least 108 cells were counted per mouse. Quantification of maximum luminal width of photoreceptor Golgi cisternae in 4-week mice was obtained from 2 mice for each group. Totally 100 cells in wild-type mice and 90 cells in Hsp90α-deficient mice were analyzed. Quantification of entire photoreceptor Golgi width was obtained from 2 mice for each group. Golgi from 63 photoreceptors of 3-week mice, 65 photoreceptors of 4-week mice, and 100 photoreceptors of 6-week mice was analyzed. The entire width of Golgi was measured to show the dispersal degree of photoreceptor Golgi. Data are mean ± SEM. ***P < 0.001 (Student’s t-test).
Figure 5
Figure 5
Abnormal rhodopsin transport in Hsp90α-deficient mice. Scale bar, 10 μm. The boxed areas are enlarged to show details. (A) The retention of rhodopsin in IS and ONL of photoreceptors in 6-week Hsp90α-deficient mice. (B) The expression of rhodopsin (Rho), Rab8, and Tulp1 in the retinas of Hsp90α-deficient mice or wild-type littermates. GAPDH was the protein loading control. (C) Quantification of protein expression. Rhodopsin, Rab8, and Tulp1 on western blot were subjected to densitometry analyses and normalized by the loading control GAPDH. Fold expression of the proteins was calculated for Hsp90α deficiency relative to the wild-type. Data are expressed as mean ± SEM of the results obtained from three mice. *P < 0.05 (Student’s t-test). (D) Aggregated Rab8 in photoreceptors of Hsp90α-deficient mice. Arrows indicate the Rab8 clusters. (E) Aggregated Tulp1 along CC of photoreceptors in Hsp90α-deficient mice. Arrows indicate the Tulp1 clusters.
Figure 6
Figure 6
MAP1B reduction in the retina of Hsp90α-deficient mice. (A) Interaction between Hsp90α and MAP1B. HA-tagged Hsp90α and Flag-tagged MAP1B were co-expressed in HEK293T cells and MAP1B was immunoprecipitated by anti-Flag affinity gel. (B) MAP1B reduction in the retina of Hsp90α-deficient mice. The retinas of wild-type (+/+), heterozygous (−/+), and homozygous (−/−) Hsp90α-deficient mice at the age of 3  or 6 weeks were isolated for western blot. (C) Decreased MAP1B ubiquitination by Hsp90α co-expression. Flag-tagged MAP1B was expressed in HEK293T cells with or without the co-expression of HA-tagged Hsp90α. MAP1B ubiquitination was analyzed after cells were treated with proteasome inhibitor MG132. Flag-tagged MAP1B was immunoprecipitated by anti-Flag affinity gel (Flag) and blotted by anti-ubiquitin antibody (Ub). (D) Immunofluorescence staining for MAP1B on retinal sections of wild-type (+/+) or Hsp90α-deficient mice (−/−) at the age of 3  or 6 weeks, respectively. The boxed areas are enlarged to show details. Arrows indicate MAP1B clusters. Scale bar, 10 μm.
Figure 7
Figure 7
α-tubulin deacetylation and microtubule destabilization in photoreceptors of Hsp90α-deficient mice. (A) α-tubulin deacetylation in photoreceptors of Hsp90α-deficient mice. IFT88 was stained on retinal sections to show the CC. Scale bar, 10 μm. (B and C) Analysis of α-tubulin deacetylation by western blot. The retinas of wild-type (+/+), heterozygous (−/+), and homozygous (−/−) Hsp90α-deficient mice at the age of 3 or 6 weeks were isolated for western blot. (D) Quantification of acetylated α-tubulin. Acetylated α-tubulin on western blot was subjected to densitometry analysis and normalized by total α-tubulin. Fold expression of acetylated α-tubulin was calculated for Hsp90α deficiency relative to wild-type and heterozygote. Data are mean ± SEM of the results obtained from at least two mice for each group. *P < 0.05 (Student’s t-test).
Figure 8
Figure 8
Retinal degeneration of wild-type mice induced by 17-DMAG treatment. Scale bar, 10 μm. (A) Photoreceptor apoptosis in the retina of 17-DMAG-treated mice. The cell apoptosis was detected by TUNEL staining. (B) Rhodopsin retention in IS of 17-DMAG-treated mice. The white arrows indicate the mislocated rhodopsin in IS. (C) Abnormal localization and aggregation of Hsp90α, MAP1B, Rab8, and Tulp1 in photoreceptors of 17-DMAG-treated mice. The boxed areas are enlarged to show details and the white arrows indicate the protein clusters. (D) MAP1B reduction and α-tubulin deacetylation in the retinas of 17-DMAG-treated mice. The retinas of DMSO- or 17-DMAG-treated mice were isolated for western blot. The numbers indicated individual mouse treated with DMSO or 17-DMAG. (E) Quantification of TUNEL-positive cells in the retina. Data are mean ± SEM of the results obtained from three mice for each group. ***P < 0.001 (Student’s t-test). (F) Quantification of protein expression in the retina of 17-DMAG-treated mice. Protein bands on western blot were subjected to densitometry analyses and normalized by GAPDH. Fold expression of the proteins was calculated for 17-DMAG relative to DMSO. Data are mean ± SEM of the results obtained from two independent experiments. *P < 0.05 (Student’s t-test).

Similar articles

Cited by

References

    1. Aligue R., Akhavan-Niak H., and Russell P. (1994). A role for Hsp90 in cell cycle control: Wee1 tyrosine kinase activity requires interaction with Hsp90. EMBO J. 13, 6099–6106. - PMC - PubMed
    1. Ayuso C., and Millan J.M. (2010). Retinitis pigmentosa and allied conditions today: a paradigm of translational research. Genome Med. 2, 34. - PMC - PubMed
    1. Bandah-Rozenfeld D., Mizrahi-Meissonnier L., Farhy C., et al. (2010). Homozygosity mapping reveals null mutations in FAM161A as a cause of autosomal-recessive retinitis pigmentosa. Am. J. Hum. Genet. 87, 382–391. - PMC - PubMed
    1. Bardwell J., and Craig E.A. (1987). Eukaryotic Mr 83,000 heat shock protein has a homologue in Escherichia coli. Proc. Natl Acad. Sci. USA 84, 5177–5181. - PMC - PubMed
    1. Besharse J.C., and Horst C.J. (1990). The photoreceptor connecting cilium A model for the transition zone In: Bloodgood, R.A. (ed.). Ciliary and Flagellar Membranes. Boston, MA: Springer, 389–417.

Publication types

MeSH terms

Substances