Systemic inflammation impairs microglial Aβ clearance through NLRP3 inflammasome
- PMID: 31359456
- PMCID: PMC6717897
- DOI: 10.15252/embj.2018101064
Systemic inflammation impairs microglial Aβ clearance through NLRP3 inflammasome
Abstract
Alzheimer's disease is the most prevalent type of dementia and is caused by the deposition of extracellular amyloid-beta and abnormal tau phosphorylation. Neuroinflammation has emerged as an additional pathological component. Microglia, representing the brain's major innate immune cells, play an important role during Alzheimer's. Once activated, microglia show changes in their morphology, characterized by a retraction of cell processes. Systemic inflammation is known to increase the risk for cognitive decline in human neurogenerative diseases including Alzheimer's. Here, we assess for the first time microglial changes upon a peripheral immune challenge in the context of aging and Alzheimer's in vivo, using 2-photon laser scanning microscopy. Microglia were monitored at 2 and 10 days post-challenge by lipopolysaccharide. Microglia exhibited a reduction in the number of branches and the area covered at 2 days, a phenomenon that resolved at 10 days. Systemic inflammation reduced microglial clearance of amyloid-beta in APP/PS1 mice. NLRP3 inflammasome knockout blocked many of the observed microglial changes upon lipopolysaccharide, including alterations in microglial morphology and amyloid pathology. NLRP3 inhibition may thus represent a novel therapeutic target that may protect the brain from toxic peripheral inflammation during systemic infection.
Keywords: 2-photon; Alzheimer's; amyloid-beta; microglia; neuroinflammation.
© 2019 The Authors. Published under the terms of the CC BY 4.0 license.
Conflict of interest statement
The authors declare that they have no conflict of interest.
Figures

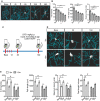
Representative 3D microglia reconstructions showing morphological changes upon LPS injection within the first 48 h. Scale bar: 10 μm.
Morphological parameters quantification within 48 h after LPS injection (mean of 5–6 ± SEM; one‐way ANOVA followed by Tukey's post hoc test, *P < 0.05, **P < 0.01, ***P < 0.001).
Two‐photon microscopy experimental design.
Representative 3D microglia reconstructions from 5‐ and 15‐month‐old mice showing microglia changes 2 and 10 days post‐LPS injection. Scale bar: 20 μm.
Morphological parameters quantification for 5‐ and 15‐month‐old mice after LPS injection (mean of 5–6 ± SEM; two‐way ANOVA followed by Tukey's post hoc test, #*P < 0.05, **P < 0.01, ***P < 0.001).

CD68 staining in cortex of 5 and 15 months old of wild‐type and Nlrp3 −/− mice. Scale bar: 20 μm.
CD68 integrated density in wild‐type and Nlrp3 −/− mice (mean of 5 ± SEM; two‐way ANOVA followed by Tukey's post hoc test, ***P < 0.001).

Schematic representation of two‐photon microscopy experimental design.
Two‐photon representative images of wild‐type and Nlrp3 −/− mice (5 and 15 months old). Scale bar: 20 μm.
Quantification of morphological parameters for wild‐type and Nlpr3 −/− mice after LPS injection (mean of 5‐6 ± SEM; two‐way ANOVA followed by Tukey's post hoc test, *P < 0.05, **P < 0.01).

IL‐1β and TNF‐α ELISA measurement in brain lysates of wild‐type and Nlrp3 −/−. A significant NLRP3‐dependent increase of IL‐1β levels was observed 2 days after LPS injection and then a return to control levels. For TNF‐α, all groups showed a transient increase in its levels (mean of 6 ± SEM; two‐way ANOVA followed by Tukey's post hoc test, *P < 0.05, **P < 0.01, ***P < 0.001).
IL‐1β and TNF‐α ELISA measurement in liver lysates of wild‐type and Nlrp3 −/− mice. A transient increase in NLRP3‐dependent IL‐1β levels is observed after immune challenge. LPS injection triggered a transient increase in TNF‐α in all groups evaluated (mean of 6 ± SEM; two‐way ANOVA followed by Tukey's post hoc test, *P < 0.05, **P < 0.01, ***P < 0.001).

Representative cortical pictures of 5 and 15 months old wild‐type and Nlrp3 −/− stained with GFAP. A transient increase in GFAP immunoreactivity is observed 2 days after LPS injection in wild‐type but not in Nlrp3 −/− mice. Scale bar: 20 μm.
GFAP integrated density in wild‐type and Nlrp3 −/− mice (mean of 5 ± SEM; two‐way ANOVA followed by Tukey's post hoc test, ***P < 0.001).

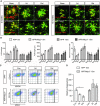
Representative cortical images of MXO4 staining for APP and APP/Nlrp3 −/− 15‐month‐old mice. Scale bar: 50 μm.
Cortical amyloid plaque number and size quantification, and Amyloid‐beta1–40 and 1–42 ELISA quantification for APP and APP/Nlrp3 −/− mice (5‐ and 15‐month‐old) (mean of 8 ± SEM; two‐way ANOVA followed by Tukey's post hoc test, *P < 0.05, **P < 0.01, ***P < 0.001).

Two‐photon images of microglia (eGFP) cells clustering around amyloid plaque for APP and APP/Nlrp3 −/− (5 and 15 months old). Scale bar: 20 μm.
Quantification of morphological parameters in (A) (mean of 5–6 ± SEM).
Flow cytometry plots from APP and APP/Nlrp3 −/− mice (15 months old), cells were gated on CD11b and MXO4 after microglia isolation.
Relative Aβ microglia uptake quantification (mean of 5 ± SEM; two‐way ANOVA followed by Tukey's post hoc test, *P < 0.05).

Western blot analysis of whole brain lysate from 15‐month‐old APP and APP/Nlrp3 −/− using beclin‐1 antibody.
Quantification of beclin‐1 expression levels (mean of 2–5 ± SEM; two‐way ANOVA followed by Tukey's post hoc test, *P < 0.05).

Two‐photon microglia (eGFP) images from APP and APP/Nlrp3 −/− in areas free of plaque (5 and 15 months old mice). Scale bar: 20 μm.
Quantification of APP and APP/Nlrp3 −/− morphological parameters for microglia in areas free of plaque (mean of 5 ± SEM; two‐way ANOVA followed by Tukey's post hoc test, *P < 0.05, **P < 0.01).

- A, B
Iba‐1 (green), CD169 (red), and MXO4 staining in plaque‐associated areas (cortex and hippocampus) of 5 and 15 months old of APP and APP/Nlrp3 −/−. Note the colocalization between Iba‐1 and CD169 (white arrows) in APP 15‐month‐old mice 2 days post‐LPS injection. Scale bar: 20 μm.

Iba‐1 (green) and fibrinogen (red) staining in cortex of 5 and 15 months old of wild‐type and Nlrp3 −/− mice. Scale bar: 10 μm.
Iba‐1 (green) and fibrinogen (red) staining in cortex of 5 and 15 months old of APP and APP/Nlrp3 −/− mice. Scale bar: 10 μm.
Fibrinogen integrated density in wild‐type and Nlrp3 −/− mice (left panel) and APP and APP/Nlrp3 −/− mice (right panel) (mean of 5 ± SEM; two‐way ANOVA followed by Tukey's post hoc test, ***P < 0.001).

- A, B
Iba‐1, Ki67, and DAPI staining in the cortex and hippocampus of wild‐type and Nlrp3 −/− (5 and 15 months old). Microglia proliferate upon LPS injection (white arrows). Non‐microglia cells proliferation was observed as well (yellow arrows). Scale bar: 20 μm.
- C
Quantification of microglial proliferation in cortex (left panel) and hippocampus (right panel) (mean of 5 ± SEM; two‐way ANOVA followed by Tukey's post hoc test, *P < 0.05, **P < 0.01, ***P < 0.001).

- A, B
Iba‐1, Ki67, and MXO4 staining in the cortex and hippocampus of APP and APP/Nlrp3 −/− (5 and 15 months old). Microglia proliferate upon LPS injection (white arrows). Non‐microglia cells proliferation was observed as well (yellow arrows). Scale bar: 20 μm.
- C
Quantification of microglial proliferation in cortex (left panel) and hippocampus (right panel) (mean of 5 ± SEM; two‐way ANOVA followed by Tukey's post hoc test, *P < 0.05, **P < 0.01, ***P < 0.001).
Similar articles
-
Dihydromyricetin inhibits microglial activation and neuroinflammation by suppressing NLRP3 inflammasome activation in APP/PS1 transgenic mice.CNS Neurosci Ther. 2018 Dec;24(12):1207-1218. doi: 10.1111/cns.12983. Epub 2018 Jun 4. CNS Neurosci Ther. 2018. PMID: 29869390 Free PMC article.
-
Role of microglial amylin receptors in mediating beta amyloid (Aβ)-induced inflammation.J Neuroinflammation. 2017 Oct 6;14(1):199. doi: 10.1186/s12974-017-0972-9. J Neuroinflammation. 2017. PMID: 28985759 Free PMC article.
-
NLRP3-dependent microglial training impaired the clearance of amyloid-beta and aggravated the cognitive decline in Alzheimer's disease.Cell Death Dis. 2020 Oct 13;11(10):849. doi: 10.1038/s41419-020-03072-x. Cell Death Dis. 2020. PMID: 33051464 Free PMC article.
-
Mechanisms of NLRP3 Inflammasome Activation: Its Role in the Treatment of Alzheimer's Disease.Neurochem Res. 2020 Nov;45(11):2560-2572. doi: 10.1007/s11064-020-03121-z. Epub 2020 Sep 14. Neurochem Res. 2020. PMID: 32929691 Review.
-
TLR4 Cross-Talk With NLRP3 Inflammasome and Complement Signaling Pathways in Alzheimer's Disease.Front Immunol. 2020 Apr 23;11:724. doi: 10.3389/fimmu.2020.00724. eCollection 2020. Front Immunol. 2020. PMID: 32391019 Free PMC article. Review.
Cited by
-
Long-Term Consequence of Non-neurotropic H3N2 Influenza A Virus Infection for the Progression of Alzheimer's Disease Symptoms.Front Cell Neurosci. 2021 Apr 28;15:643650. doi: 10.3389/fncel.2021.643650. eCollection 2021. Front Cell Neurosci. 2021. PMID: 33994946 Free PMC article.
-
TRIMs: Generalists Regulating the NLRP3 Inflammasome Signaling Pathway.DNA Cell Biol. 2022 Mar;41(3):262-275. doi: 10.1089/dna.2021.0943. Epub 2022 Feb 18. DNA Cell Biol. 2022. PMID: 35180350 Free PMC article. Review.
-
Waste Clearance in the Brain and Neuroinflammation: A Novel Perspective on Biomarker and Drug Target Discovery in Alzheimer's Disease.Cells. 2022 Mar 7;11(5):919. doi: 10.3390/cells11050919. Cells. 2022. PMID: 35269541 Free PMC article. Review.
-
Differential Regional Vulnerability of the Brain to Mild Neuroinflammation Induced by Systemic LPS Treatment in Mice.J Inflamm Res. 2022 May 23;15:3053-3063. doi: 10.2147/JIR.S362006. eCollection 2022. J Inflamm Res. 2022. PMID: 35645573 Free PMC article.
-
Age-related cerebral small vessel disease and inflammaging.Cell Death Dis. 2020 Oct 30;11(10):932. doi: 10.1038/s41419-020-03137-x. Cell Death Dis. 2020. PMID: 33127878 Free PMC article. Review.
References
-
- Baroja‐Mazo A, Martín‐Sánchez F, Gomez AI, Martínez CM, Amores‐Iniesta J, Compan V, Barberà‐Cremades M, Yagüe J, Ruiz‐Ortiz E, Antón J et al (2014) The NLRP3 inflammasome is released as a particulate danger signal that amplifies the inflammatory response. Nat Immunol 15: 738–748 - PubMed
-
- Biber K, Neumann H, Inoue K (2007) Neuronal ‘On’ and ‘Off’ signals control microglia. Trends Neurosci 30: 596–602 - PubMed
Publication types
MeSH terms
Substances
Grants and funding
LinkOut - more resources
Full Text Sources
Medical

