. 2019 Jul 18;10(1):3168.
doi: 10.1038/s41467-019-11100-4.

Hox11 expressing regional skeletal stem cells are progenitors for osteoblasts, chondrocytes and adipocytes throughout life

Affiliations

Hox11 expressing regional skeletal stem cells are progenitors for osteoblasts, chondrocytes and adipocytes throughout life

Kyriel M Pineault et al. Nat Commun. .

Abstract

Multipotent mesenchymal stromal cells (MSCs) are required for skeletal formation, maintenance, and repair throughout life; however, current models posit that postnatally arising long-lived adult MSCs replace transient embryonic progenitor populations. We previously reported exclusive expression and function of the embryonic patterning transcription factor, Hoxa11, in adult skeletal progenitor-enriched MSCs. Here, using a newly generated Hoxa11-CreERT2 lineage-tracing system, we show Hoxa11-lineage marked cells give rise to all skeletal lineages throughout the life of the animal and persist as MSCs. Hoxa11 lineage-positive cells give rise to previously described progenitor-enriched MSC populations marked by LepR-Cre and Osx-CreER, placing them upstream of these populations. Our studies establish that Hox-expressing cells are skeletal stem cells that arise from the earliest stages of skeletal development and self-renew throughout the life of the animal.


Conflict of interest statement

The authors declare no competing interests.

Figures
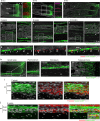
Fig. 1
Fig. 1
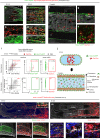
Hoxa11eGFP expression defines a continuous stromal population. af Hoxa11eGFP expression in the forelimb zeugopod (radius and ulna) shown from embryonic to adult stages with proximal on left and distal on right in all images. Hoxa11eGFP expression in radius and ulna ac, higher magnification images show cartilage marker, Sox9 at E13.5 (a, red) and osteoblast marker, Osterix at E14.5 (b, magenta). df Mid-diaphysis radius (r) and ulna (u) (higher magnification images of mid-diaphysis ulna, white dashed box, shown on right). g Hoxa11eGFP and Osterix (red) at 8 weeks, white arrowheads identify individual Osterix positive nuclei. h Hoxa11eGFP (green) in E15.5 distal growth plate and higher magnification of perichondrium (white boxed region, bracket), 8 weeks periosteum (bracket), and P4 trabeculae. i, j Periosteal Hoxa11eGFP and Periostin (red) at 2 week (i) and 8 weeks (j). Dashed white lines mark periosteal boundary, dotted line separates inner and outer layers. j Cell marked by asterisk magnified in inset. In all images, green: Hoxa11eGFP, gray: DAPI. Bone marrow: bm, periosteum: po, endosteum: endo, cortical bone: cb, perichondrium: pc. Scale bars: (a, b, df left panels, h growth plate), 200 μm, (c) 500 μm, (df right panels, h trabecular bone) 100 μm, (g, h periosteum, i, j) 50 μm
Fig. 2
Fig. 2
Hoxa11eGFP-expressing cells co-express MSC markers throughout life. a Flow cytometry analyses of whole skeletal anlage (E12.5 (n = 4), E14.5 (n = 6), and P0 (n = 6). ‘n’ values represent pooled cells from both forelimbs of individual embryos or pups) or flushed bone marrow (P14 (n = 9), 8 week (n = 10), 6 month (n = 4), and 1 year (n = 3). ‘n’ values represent pooled cells from the radius and ulna of one forelimb of individual animals). Gating strategy and bone surface analyses Supplementary Fig. 1a, b. Non-hematopoietic, non-endothelial stromal compartment (CD45-TER119-CD31-) was gated on PDGFRα/CD51 (top) or Leptin Receptor (LepR-Ab, bottom). Percentages reflect proportion of Hoxa11eGFP-positive population within double-positive gate (top) or bracketed region of histogram (bottom). Charcoal dots or gray histogram: total non-endothelial stroma (NES), green dots or green histogram: Hoxa11eGFP-expressing non-endothelial stroma (Hoxa11eGFP+). b, c Flow cytometry analyses of whole P3 bones [n = 3]. ‘n’ value represents pooled cells from the radius and ulna of both forelimbs of individual pups. Gating strategy Supplementary Fig. 1c. Non-hematopoietic, non-endothelial stromal compartment (CD45-TER119-CD31-) was gated for b Hoxa11eGFP-positive population (green box) and subsequently for mouse skeletal stem cells (mSSCs, αV+Tie2-Thy-6C3-CD105-CD200+, blue box) or c mSSC population (blue box) and subsequently for Hoxa11eGFP-expression (green box). Percentages reflect proportion of cells within indicated gate. ‘n’ values indicate biologically independent animals for each time point. All data presented as mean ± standard deviation
Fig. 3
Fig. 3
Hoxa11-lineage contributes to the zeugopod skeleton throughout life. a Schematic of Hoxa11-CreERT2 allele. Exon 1 of Hoxa11 was replaced with CreERT2 followed by a rabbit β-globin poly-adenylation (PA) stop sequence (see “Methods” section). Endogenous sequence in blue, edited sequence in red, start site marked by ‘ATG’. bj Pregnant females were given tamoxifen at E13.5 and resulting Hoxa11eGFP;Hoxa11-CreERT2;ROSA-tdTomato animals were examined at indicated ages. Shown are complete limb (b, e, h), distal radius (r) and ulna (u) (f, g) or distal diaphysis region of tibia (i, j). c Expression of Hoxa11iTom and chondrocyte marker, Sox9 (green) at E14.5, dashed white lines demarcates anlage and bracket marks perichondrium. d Expression of Hoxa11iTom and osteoblast marker, Osterix (green) at E14.5, bracket marks periosteum. f Co-expression of Hoxa11eGFP and Hoxa11iTom. g Inset shows Hoxa11-lineage marked bone marrow stromal cells (white dashed box). kq P3 pups received tamoxifen and Hoxa11eGFP;Hoxa11-CreERT2;ROSA-tdTomato mice were examined at indicated ages. Shown are complete limb (k, o), mid-diaphysis ulna (n), or distal region of tibia (p, q). l Co-expression of Hoxa11iTom and chondrocyte marker, Sox9 (green) in the growth plate at P4 Boxed region enlarged to right, dashed white line demarcates perichondrial border. m Co-expression of Hoxa11iTom and osteoblast marker, Osterix (green) in the periosteum (bracket) at P4. b, n Right panel shows co-expression of Hoxa11iTom with Hoxa11eGFP. h, o Inset shows complete humerus. Dashed white box shown magnified to right; view of mid-diaphysis ulna. All images shown with distal end of bone to right. In all images, red: Hoxa11-lineage marked cells (Hoxa11iTom), green: Hoxa11eGFP-expressing cells (unless otherwise noted), gray: DAPI. Bone marrow: bm, perichondrium: pc, periosteum: po, endosteum: endo. Scale bars: (c, n) 100 μm, (d) 50 μm. All other scale bars = 200 μm
Fig. 4
Fig. 4
Hoxa11-lineage contributes to all skeletal/mesenchymal cell types. ab Pregnant dams received tamoxifen at E13.5 and resulting Hoxa11eGFP;Hoxa11-CreERT2;ROSA-tdTomato mice were chased to (a) 8 weeks or (b) 1 year. c P3 pups received tamoxifen and Hoxa11eGFP;Hoxa11-CreERT2;ROSA-tdTomato mice were chased to 8 weeks. All images, Hoxa11 lineage-labeled cells (Hoxa11iTom, red). Shown are chondrocytes with characteristic columnar morphology at distal end of growth plate, osteoblasts stained with Osterix (white) on trabecular (top) and endosteal bone (bottom), osteocytes within the cortical bone stained with SOST (green), and bone marrow adipocytes stained with Perilipin (green). Dashed yellow lines mark upper and lower boundaries of growth plate, dotted yellow lines mark periosteal and endosteal boundaries of cortical bone. White dashed boxed region of single (a, c) or multiple (b) osteocytes(s) magnified to right. White dotted box of single adipocyte magnified to right. In all images, gray or blue: DAPI. Scale bars: (chondrocyte and adipocytes images) 100 μm, (osteoblast and osteocyte images) 50 μm, (b, SOST) 25 μm
Fig. 5
Fig. 5
Hoxa11-lineage-marked progenitors are maintained throughout life. (a, b) Pregnant dams received tamoxifen at E13.5 and resulting Hoxa11eGFP;Hoxa11-CreERT2;ROSA-tdTomato mice were chased to (a) 8 weeks (n = 3) or (b) 1 year (n = 4). P3 pups received tamoxifen and Hoxa11eGFP;Hoxa11-CreERT2;ROSA-tdTomato mice were chased to (c) 8 weeks (n = 6) or (d) 1 year (n = 3). Flow cytometry analyses of non-hematopoietic, non-endothelial stromal compartment (CD45-TER119-CD31-, NES) in bone marrow (top panels), and bone surface (bottom panels). a, c First panel: Hoxa11 lineage-marked cells (x-axis: Hoxa11iTom), second panel: analysis of Hoxa11iTom positive gate (red) for Hoxa11eGFP expression, third panel: co-expression analysis of PDGFRα/CD51, fourth panel: co-expression analysis of Leptin Receptor (LepR-Ab). b, d Left: co-expression analysis of PDGFRα/CD51, right: co-expression analysis of Leptin Receptor (LepR-Ab). Percentages reflect proportion of Hoxa11iTom population in identified gate. Gray dots: total non-endothelial stroma (NES), red dots: Hoxa11iTom. ‘n’ values indicate pooled cells from radius and ulna of one forelimb from biologically independent animals for each time point. All data presented as mean ± standard deviation
Fig. 6
Fig. 6
Hoxa11-lineage cells regenerate skeleton following fracture. Ulnar fracture was performed at 8 weeks of age (af) or 10 months (gk) on Hoxa11-CreERT2;ROSA-tdTomato or Hoxa11eGFP;Hoxa11-CreERT2;ROSA-tdTomato mice following tamoxifen dosing at (ac) E13.5—to pregnant female, or (dk) P3. a, d, g Hoxa11 lineage-positive cells (Hoxa11iTom, red) within the fracture callus 10 days post-injury (DPI). Fracture line marked with dashed yellow line and cortical bone (cb), bone marrow (bm), and periosteum (po) are labeled. Dashed white lines indicate regions visualized with antibodies (green) for cartilage (Sox9, b, e, h) and bone (Osx, c, f, i). Higher magnification of regions marked by dashed white lines (b, c, e, f) with channels separated shown to right. (j) Expression of Hoxa11eGFP (green) and Hoxa11iTom within the expanded stromal population. White dashed box magnified in inset. k Expression of Periostin (green) and Hoxa11iTom within the expanded periosteal compartment (bracket). In all images, gray: DAPI. Scale bars: (a, d, g) 500 μm, (b, c, e, f) 200 μm, (j) 100 μm, (h, i, k) 50 μm
Fig. 7
Fig. 7
LepR-Cre progressively marks existing Hoxa11eGFP-positive cells. Analysis of the co-expression of Hoxa11eGFP (green) and LepR-Cre lineage-marked cells (LepRiTom, red) in Hoxa11eGFP;LepR-Cre;ROSA-tdTomato mice. Percentages (yellow) reflect proportion of Hoxa11eGFP-positive cells that also express LepRiTom. Flow cytometry analyses shown in Supplementary Fig. 5. a magnified view of primary spongiosa and developing cortical bone surface at E18.5 (n = 3). be′ High magnification view of mid-diaphysis of ulna be bone marrow, or b′e′ cortical bone at 2 (n = 4), 4 (n = 3), 8 (n = 3), and 15 weeks (n = 3). d′, e′ Arrowheads identify non-overlapping Hoxa11eGFP-positive periosteal cells. In all images; gray: DAPI. Data presented as mean ± standard deviation. ‘n’ values indicate pooled cells from a both E18.5 forelimbs or be′ the radius and ulna of one forelimb of biologically independent animals for each time point. f Diagram of data at E18.5, 2 weeks, and 15 weeks. All scale bars: 100 μm
Fig. 8
Fig. 8
Hoxa11eGFP-positive MSCs are distinct from embryonic Osx-lineage. Comparison of Hoxa11eGFP (green) and Osx-CreER lineage-marked cells (OsxiTom, red) was performed in Hoxa11eGFP;Osx-CreER;ROSA-tdTomato mice. ai Pregnant females received tamoxifen at E13.5 and co-expression of Hoxa11eGFP and embryonic Osx-lineage was examined at (a, b) E14.5, (c, d) E18.5, and (fi) 8 weeks. a Complete radius (r) and ulna (u) 24 h after tamoxifen with proximal to the left and distal to the right. White box region magnified in (b) anlagen boundary indicated by dotted white line. c Mid-diaphysis ulna; white dashed boxes indicate magnified region of (d) primary spongiosa and (e) periosteum. f Mid-diaphysis tibia; white dashed boxes indicate magnified region of adult (g) endosteal surface and (h) bone marrow. (i) Flow cytometry analysis of non-hematopoietic, non-endothelial stroma (CD45-TER119-CD31-, NES) in bone marrow (top panels) and bone adherent (bottom panels) compartments. First panel: analysis of OsxiTom population for PDGFRα/CD51, second panel: analysis of OsxiTom for Hoxa11eGFP, third panel: analysis of Hoxa11eGFP-positive cells (green) for OsxiTom expression. OsxiTom cells are very rare (0.018 ± 0.03 of total NES) on bone surface (lower left panel). (n = 3). ‘n’ represents pooled cells from the radius and ulna of one forelimb of biologically independent animals. Flow cytometry dot plots, gray dots: total non-endothelial stroma (NES). Data presented as mean ± standard deviation. j Diagrammatic representations of data. k Pregnant females received tamoxifen at E11.5 and Hoxa11-CreERT2;ROSA-tdTomato embryos were analyzed at (k, l) E14.5 and (mp) E18.5. k White boxed region shown in inset, co-expression of Hoxa11iTom (red) and Osterix (green). (m) white boxed region of primary spongiosa magnified in n. n White dashed boxes indicate magnified regions of (o) trabeculae and (p) periosteum. Periosteum: po, bone marrow: bm, cortical bone: cb, endosteum: endo All fluorescent images, gray: DAPI. Scale bars: (a, f, k) 200 μm, (b, de, gh) 50 μm, (c, i, n) 100 μm, (o, p) 25 μm
Fig. 9
Fig. 9
Postnatal Osx-lineage marginally overlaps with Hoxa11eGFP-positive cells. Comparison of Hoxa11eGFP (green) and Osx-CreER lineage-marked cells (OsxiTom, red) was performed in Hoxa11eGFP;Osx-CreER;ROSA-tdTomato mice. P3 pups received tamoxifen and co-expression of Hoxa11eGFP and postnatal Osx-lineage was examined at (ac) P6 and (df) 8 weeks. (a) Mid-diaphysis ulna; dashed white boxes indicate magnified (b) cortical bone and (c) bone marrow, rare OsxiTom stromal cell (arrow). (d) Mid-diaphysis tibia, white dashed boxes indicate magnified (e) periosteum and (f) bone marrow. (g) Flow cytometry analysis of non-hematopoietic, non-endothelial stroma (CD45-TER119-CD31-) in bone marrow (top panels) and bone surface (bottom panels) compartments. First panel: analysis of OsxiTom population for PDGFRα/CD51, second panel: analysis of OsxiTom for Hoxa11eGFP, third panel: analysis of Hoxa11eGFP-positive cells (green) for OsxiTom expression. (n = 4). ‘n’ represents pooled cells from the radius and ulna of one forelimb of biologically independent animals. Flow cytometry dot plots, gray dots: total non-endothelial stroma (NES). Data presented as mean ± standard deviation. (h) Diagrammatic representations of data. Periosteum: po, bone marrow: bm, cortical bone: cb, endosteum: endo All fluorescent images, gray: DAPI. Scale bars: (a) 200 μm, (b, c, e, f) 50 μm, (d) 100 μm

Similar articles

Cited by

References

    1. Wellik DM, Capecchi MR. Hox10 and Hox11 genes are required to globally pattern the mammalian skeleton. Science. 2003;301:363–367. doi: 10.1126/science.1085672. - DOI - PubMed
    1. Davis AP, Witte DP, Hsieh-Li HM, Potter SS, Capecchi MR. Absence of radius and ulna in mice lacking hoxa-11 and hoxd-11. Nature. 1995;375:791–795. doi: 10.1038/375791a0. - DOI - PubMed
    1. Pineault KM, et al. Hox11 genes regulate postnatal longitudinal bone growth and growth plate proliferation. Biol. Open. 2015;4:1538–1548. doi: 10.1242/bio.012500. - DOI - PMC - PubMed
    1. Rux, D. R. et al. Hox11 function is required for region-specific fracture repair. J. Bone Miner. Res., n/a-n/a, 10.1002/jbmr.3166 (2017). - PMC - PubMed
    1. Rux Danielle R., Song Jane Y., Swinehart Ilea T., Pineault Kyriel M., Schlientz Aleesa J., Trulik Kelsey G., Goldstein Steve A., Kozloff Ken M., Lucas Daniel, Wellik Deneen M. Regionally Restricted Hox Function in Adult Bone Marrow Multipotent Mesenchymal Stem/Stromal Cells. Developmental Cell. 2016;39(6):653–666. doi: 10.1016/j.devcel.2016.11.008. - DOI - PMC - PubMed

Publication types

LinkOut - more resources