

Conditional Activation of NF-κB Inducing Kinase (NIK) in the Osteolineage Enhances Both Basal and Loading-Induced Bone Formation
- PMID: 31246323
- PMCID: PMC6854278
- DOI: 10.1002/jbmr.3819
Conditional Activation of NF-κB Inducing Kinase (NIK) in the Osteolineage Enhances Both Basal and Loading-Induced Bone Formation
Abstract
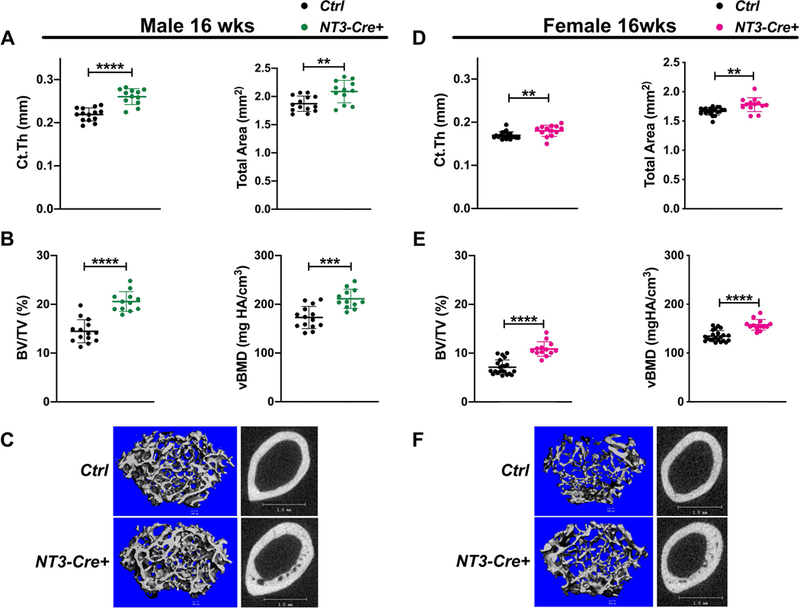
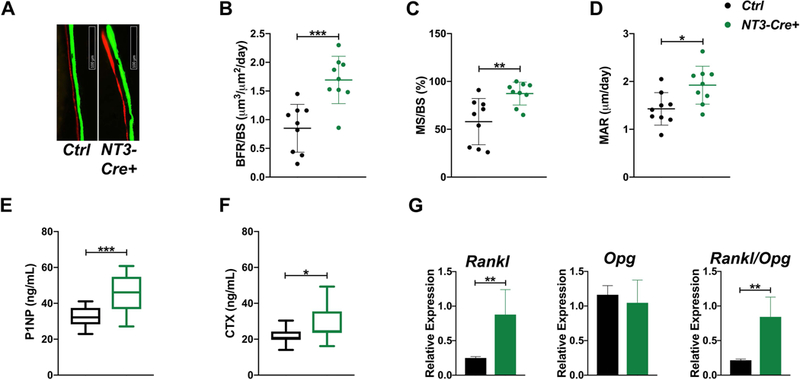
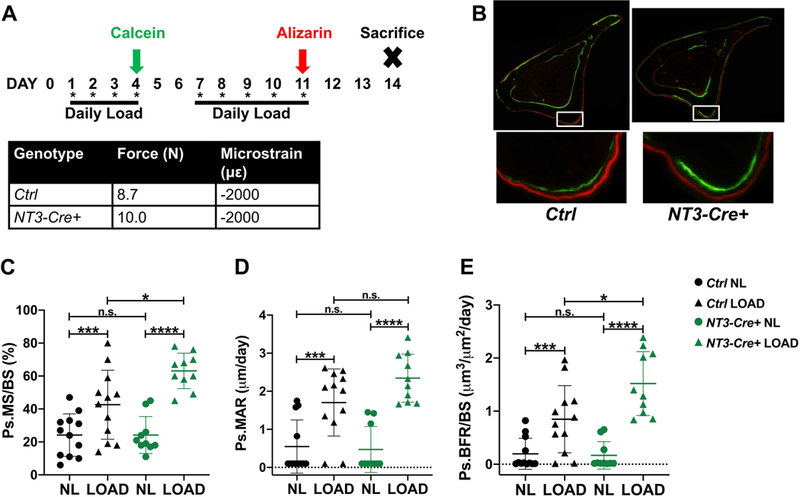
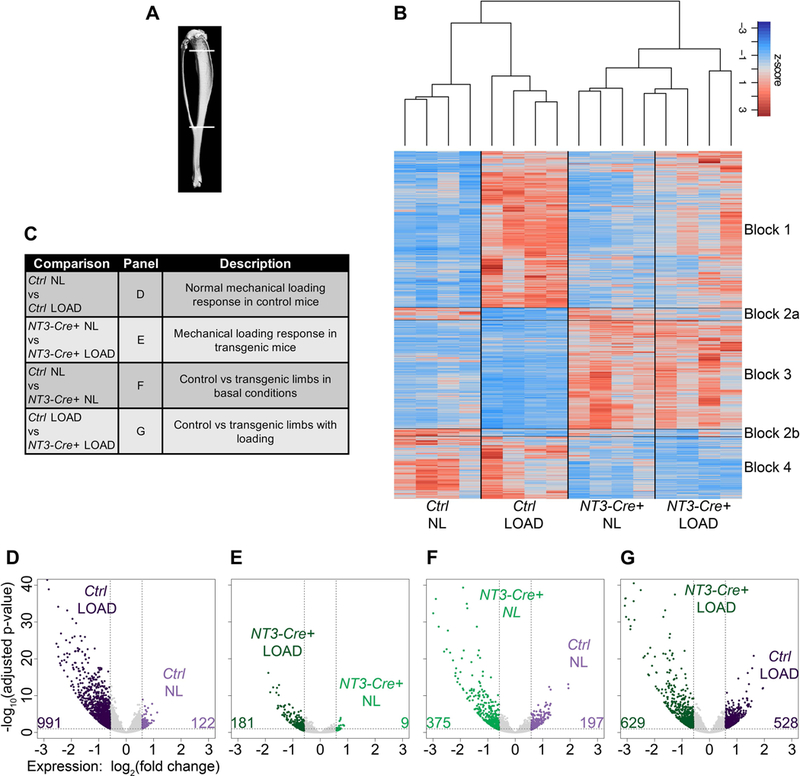
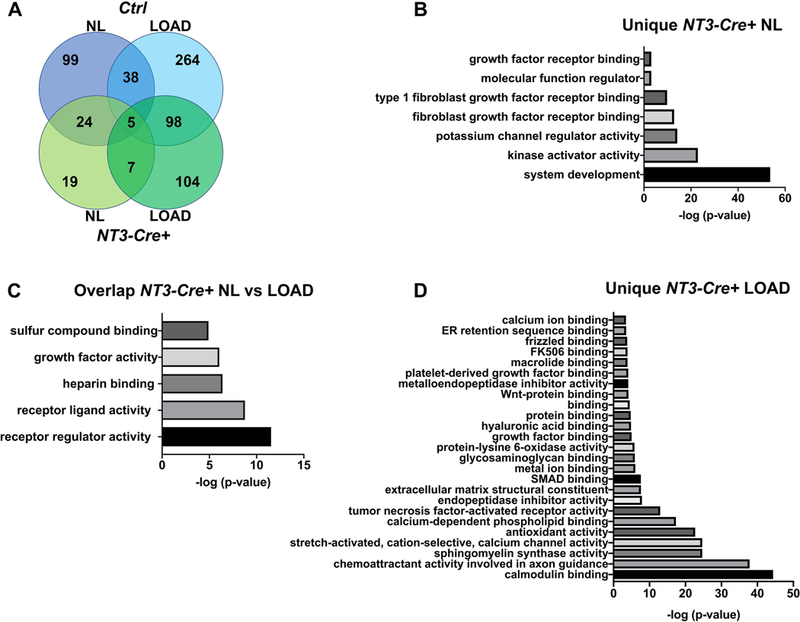
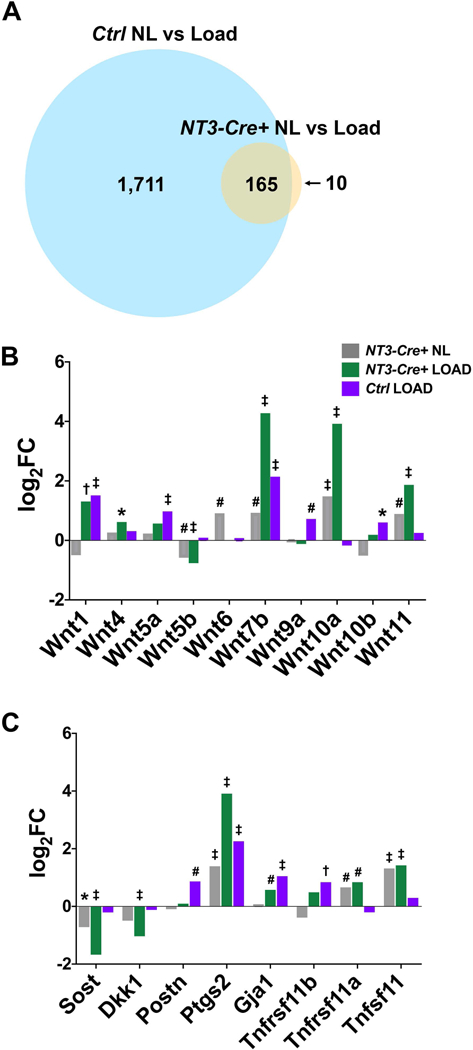
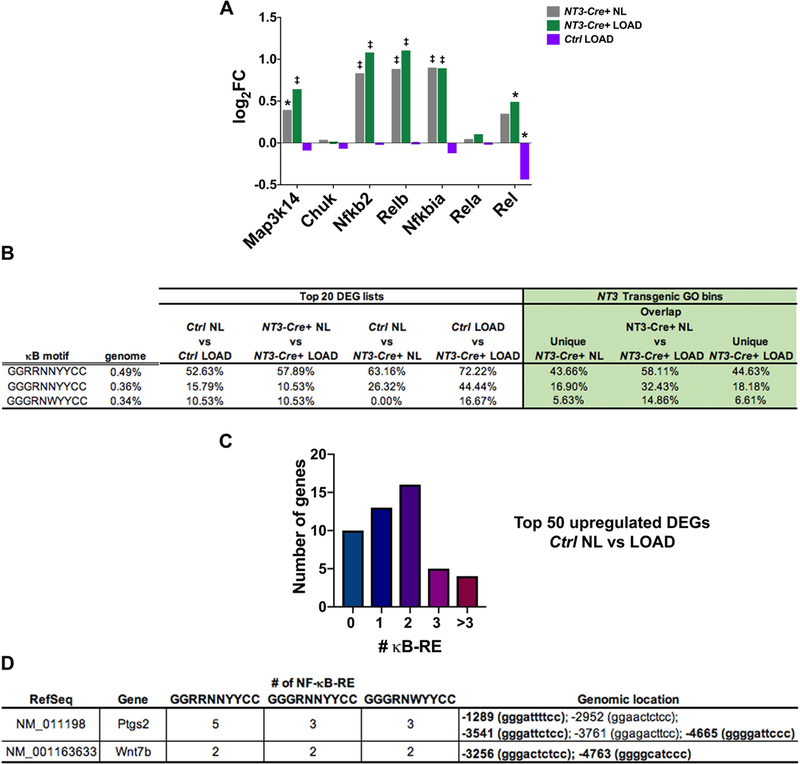
Studies from global loss-of-function mutants suggest that alternative NF-κB downstream of NF-κB inducing kinase (NIK) is a cell-intrinsic negative regulator of osteogenesis. However, the interpretation of the osteoblast and/or osteocyte contribution to the bone phenotype is complicated by simultaneous osteoclast defects in these models. Therefore, we turned to a transgenic mouse model to investigate the direct role of NIK in the osteolineage. Osx-Cre;NT3 animals (NT3-Cre +), which bear a constitutively active NIK allele (NT3) driven by Osx-Cre, were compared with their Cre-negative, Control (Ctrl) littermates. NT3-Cre + mice had elevated serum P1NP and CTX levels. Despite this high turnover state, µCT showed that constitutive activation of NIK resulted in a net increase in basal bone mass in both cortical and cancellous compartments. Furthermore, NT3-Cre + mice exhibited a greater anabolic response following mechanical loading compared with controls. We next performed RNA-Seq on nonloaded and loaded tibias to elucidate possible mechanisms underlying the increased bone anabolism seen in NT3-Cre + mice. Hierarchical clustering revealed two main transcriptional programs: one loading-responsive and the other NT3 transgene-driven. Gene ontology (GO) analysis indicated a distinct upregulation of receptor, kinase, and growth factor activities including Wnts, as well as a calcium-response signature in NT3-Cre + limbs. The promoters of these GO-term associated genes, including many known to be bone-anabolic, were highly enriched for multiple κB recognition elements (κB-RE) relative to the background frequency in the genome. The loading response in NT3-Cre + mice substantially overlapped (>90%) with Ctrl. Surprisingly, control animals had 10-fold more DEGs in response to loading. However, most top DEGs shared between genotypes had a high incidence of multiple κB-RE in their promoters. Therefore, both transcriptional programs (loading-responsive and NT3 transgene-driven) are modulated by NF-κB. Our studies uncover a previously unrecognized role for NF-κB in the promotion of both basal and mechanically stimulated bone formation. © 2019 American Society for Bone and Mineral Research.
Keywords: ANABOLIC; CONSENSUS MOTIF; MOUSE MODEL; NF-KAPPAB; OSTEOBLAST; OSTEOCYTE.
© 2019 American Society for Bone and Mineral Research.
Conflict of interest statement
Disclosures
All authors state that they have no conflicts of interest.
Figures
Similar articles
-
Constitutive activation of NF-κB inducing kinase (NIK) in the mesenchymal lineage using Osterix (Sp7)- or Fibroblast-specific protein 1 (S100a4)-Cre drives spontaneous soft tissue sarcoma.PLoS One. 2021 Jul 22;16(7):e0254426. doi: 10.1371/journal.pone.0254426. eCollection 2021. PLoS One. 2021. PMID: 34292968 Free PMC article.
-
NIK stabilization in osteoclasts results in osteoporosis and enhanced inflammatory osteolysis.PLoS One. 2010 Nov 8;5(11):e15383. doi: 10.1371/journal.pone.0015383. PLoS One. 2010. PMID: 21151480 Free PMC article.
-
Epigenetic alteration of the NF-κB-inducing kinase (NIK) gene is involved in enhanced NIK expression in basal-like breast cancer.Cancer Sci. 2010 Nov;101(11):2391-7. doi: 10.1111/j.1349-7006.2010.01685.x. Epub 2010 Aug 24. Cancer Sci. 2010. PMID: 20735436 Free PMC article.
-
Non-canonical NF-κB signaling pathway.Cell Res. 2011 Jan;21(1):71-85. doi: 10.1038/cr.2010.177. Epub 2010 Dec 21. Cell Res. 2011. PMID: 21173796 Free PMC article. Review.
-
NF-κB inducing kinase: a key regulator in the immune system and in cancer.Cytokine Growth Factor Rev. 2010 Aug;21(4):213-26. doi: 10.1016/j.cytogfr.2010.06.002. Epub 2010 Aug 3. Cytokine Growth Factor Rev. 2010. PMID: 20685151 Free PMC article. Review.
Cited by
-
Toll-like receptor 4 signaling in osteoblasts is required for load-induced bone formation in mice.iScience. 2023 Feb 28;26(4):106304. doi: 10.1016/j.isci.2023.106304. eCollection 2023 Apr 21. iScience. 2023. PMID: 36950122 Free PMC article.
-
Nuclear Factor-Kappa B Regulation of Osteoclastogenesis and Osteoblastogenesis.Endocrinol Metab (Seoul). 2023 Oct;38(5):504-521. doi: 10.3803/EnM.2023.501. Epub 2023 Sep 26. Endocrinol Metab (Seoul). 2023. PMID: 37749800 Free PMC article.
-
Constitutive activation of NF-κB inducing kinase (NIK) in the mesenchymal lineage using Osterix (Sp7)- or Fibroblast-specific protein 1 (S100a4)-Cre drives spontaneous soft tissue sarcoma.PLoS One. 2021 Jul 22;16(7):e0254426. doi: 10.1371/journal.pone.0254426. eCollection 2021. PLoS One. 2021. PMID: 34292968 Free PMC article.
-
Identification of mechanics-responsive osteocyte signature in osteoarthritis subchondral bone.Bone Joint Res. 2022 Jun;11(6):362-370. doi: 10.1302/2046-3758.116.BJR-2021-0436.R1. Bone Joint Res. 2022. PMID: 35678241 Free PMC article.
-
Conditional loss of IKKα in Osterix + cells has no effect on bone but leads to age-related loss of peripheral fat.Sci Rep. 2022 Mar 22;12(1):4915. doi: 10.1038/s41598-022-08914-6. Sci Rep. 2022. PMID: 35318397 Free PMC article.
References
-
- Long F Building strong bones: molecular regulation of the osteoblast lineage. Nat Rev Mol Cell Biol. 2012. January;13(1):27–38. - PubMed
-
- Bradley EW, Westendorf JJ, van Wijnen AJ, Dudakovic A. 4 Osteoblasts: Function, Development, and Regulation. ASBMR primer. Ninth. 2018. September 19;:31–7.
-
- Robling AG, Niziolek PJ, Baldridge LA, Condon KW, Allen MR, Alam I, et al. Mechanical stimulation of bone in vivo reduces osteocyte expression of Sost/sclerostin. J Biol Chem. American Society for Biochemistry and Molecular Biology; 2008. February 29;283(9):5866–75. - PubMed
Publication types
MeSH terms
Substances
Grants and funding
- T32 CA113275/CA/NCI NIH HHS/United States
- 85117/Shriners Hospitals for Children/International
- P30 AR074992/AR/NIAMS NIH HHS/United States
- S10 RR027552/RR/NCRR NIH HHS/United States
- R01 AR064821/AR/NIAMS NIH HHS/United States
- R01 AR070030/AR/NIAMS NIH HHS/United States
- S10 RR0227552/NH/NIH HHS/United States
- P30 AR057235/AR/NIAMS NIH HHS/United States
- F31 AR068853/AR/NIAMS NIH HHS/United States
- T32CA113275/CA/NCI NIH HHS/United States
- S10 RR027552/NH/NIH HHS/United States
- R01 AR052705/AR/NIAMS NIH HHS/United States
- R01 AR068438/AR/NIAMS NIH HHS/United States
LinkOut - more resources
Full Text Sources
Molecular Biology Databases
Miscellaneous
