. 2019 Jun 26;10(1):2795.
doi: 10.1038/s41467-019-10677-0.

TGFβ-induced degradation of TRAF3 in mesenchymal progenitor cells causes age-related osteoporosis

Affiliations

TGFβ-induced degradation of TRAF3 in mesenchymal progenitor cells causes age-related osteoporosis

Jinbo Li et al. Nat Commun. .

Abstract

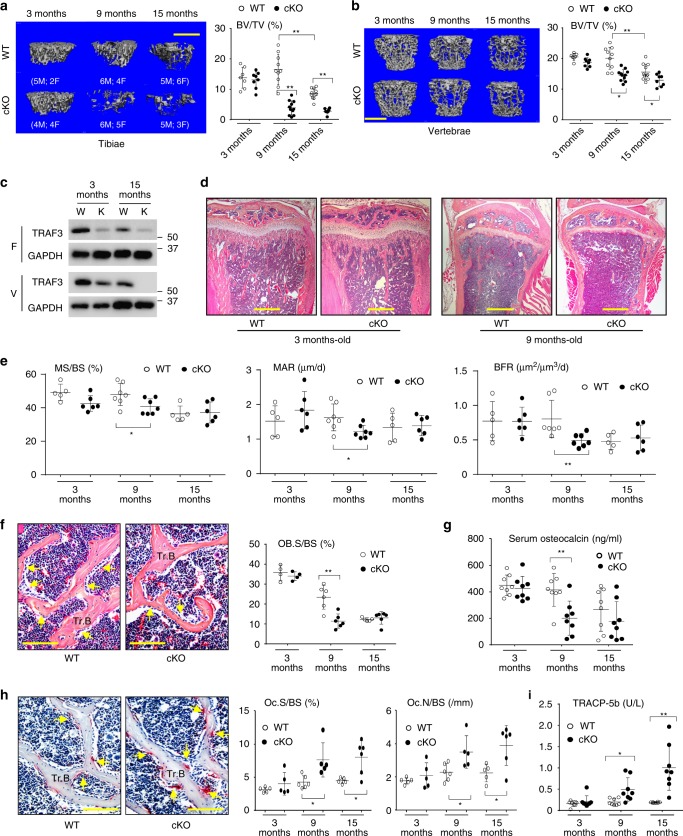
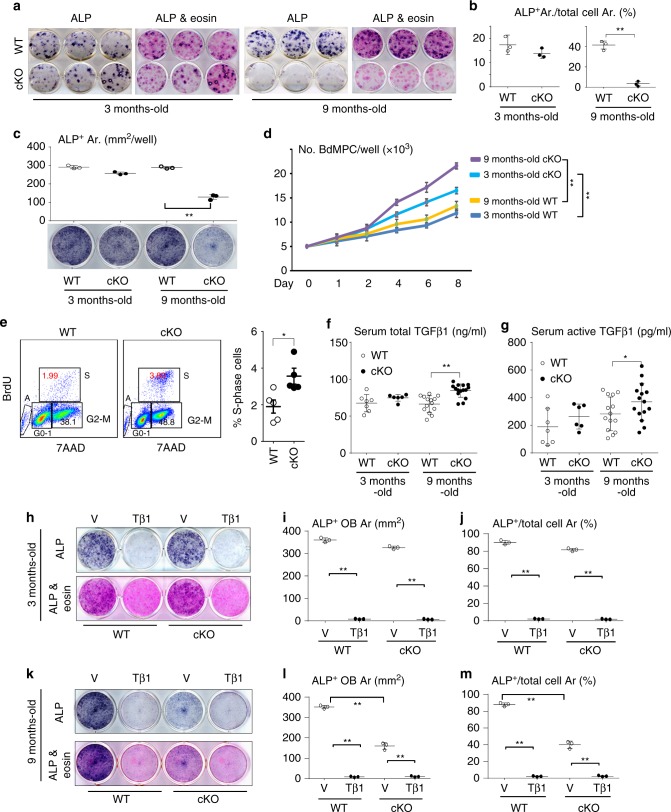
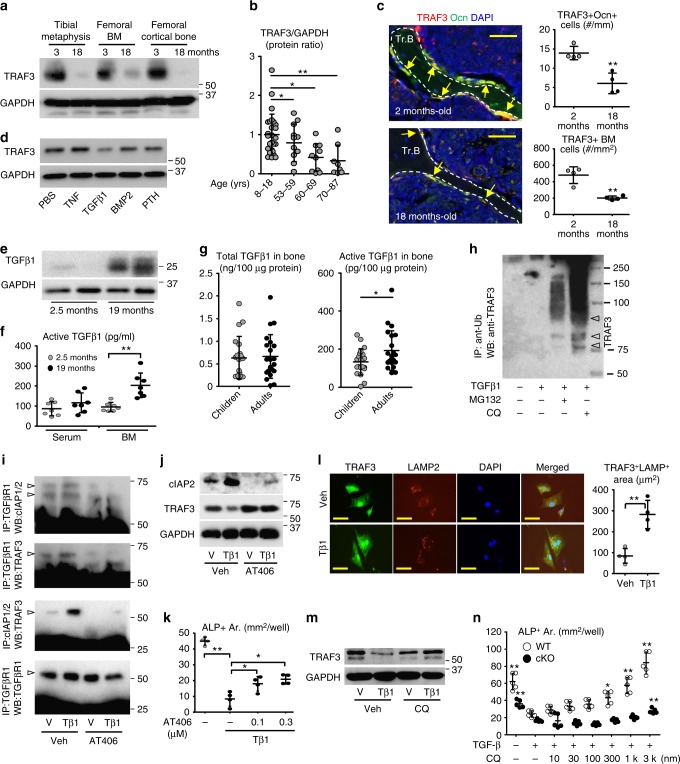
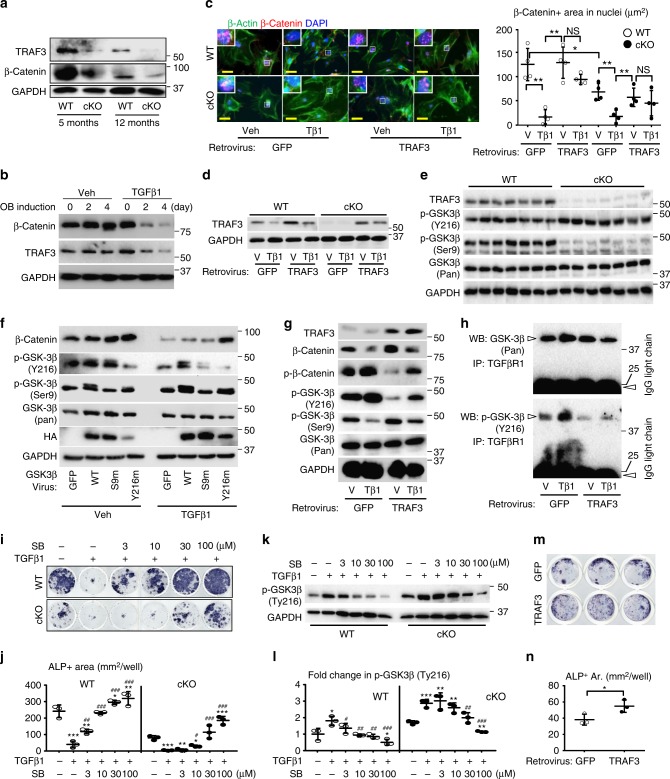
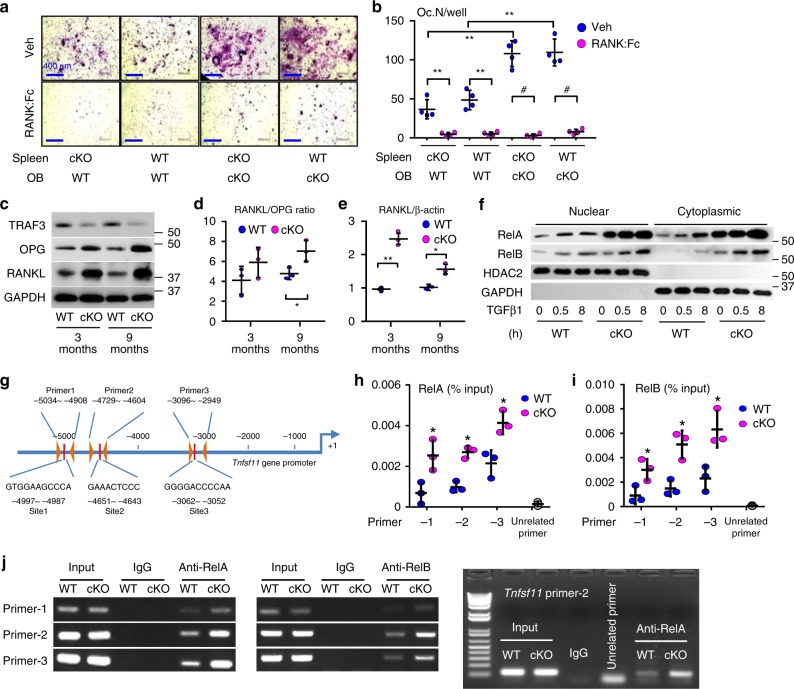
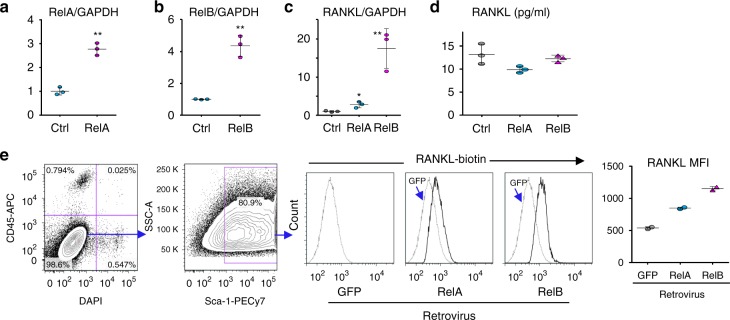
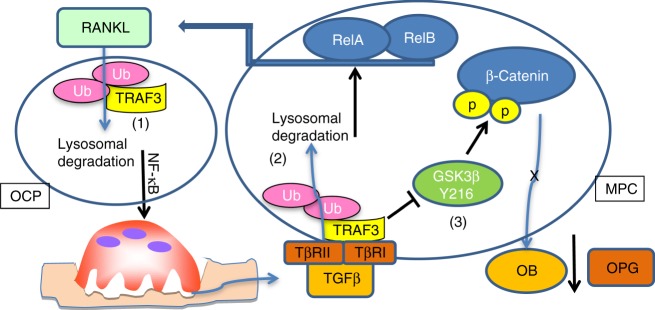
Inflammaging induces osteoporosis by promoting bone destruction and inhibiting bone formation. TRAF3 limits bone destruction by inhibiting RANKL-induced NF-κB signaling in osteoclast precursors. However, the role of TRAF3 in mesenchymal progenitor cells (MPCs) is unknown. Mice with TRAF3 deleted in MPCs develop early onset osteoporosis due to reduced bone formation and enhanced bone destruction. In young mice TRAF3 prevents β-catenin degradation in MPCs and maintains osteoblast formation. However, TRAF3 protein levels decrease in murine and human bone samples during aging when TGFβ1 is released from resorbing bone. TGFβ1 induces degradation of TRAF3 in murine MPCs and inhibits osteoblast formation through GSK-3β-mediated degradation of β-catenin. Thus, TRAF3 positively regulates MPC differentiation into osteoblasts. TRAF3 deletion in MPCs activated NF-κB RelA and RelB to promote RANKL expression and enhance bone destruction. We conclude that pharmacologic stabilization of TRAF3 during aging could treat/prevent age-related osteoporosis by inhibiting bone destruction and promoting bone formation.


Conflict of interest statement

The authors declare no competing interests.

Figures

Fig. 1
Fig. 1
TRAF3 cKO mice have early onset osteoporosis. a, b Representative µCT images and bone volume (BV/TV) values in a tibiae and b L1 vertebrae from litters of 3-, 9-, and 15-month (m)-old WT and TRAF3 conditional knockout (cKO) mice, including both males and females, as listed in the figure. Mean ± SD (3-m-old WT (n = 7) and cKO (n = 8), 9-m-old WT (n = 10) and cKO (n = 11), 15-m-old WT (n = 11) and cKO (n = 8) biologically independent mice; *p < 0.05, **p < 0.01). Scale bar, 1 mm. c Western blot (WB) of TRAF3/GAPDH in lysates of femoral metaphyses (F; upper panel) and vertebrae (V; lower panel) from 3- and 15-m-old WT and cKO mice. d Representative H&E-stained sections of proximal tibiae of 3- and 9-m-old WT and TRAF3 cKO mice. Scale bar, 400 μm. e Mineralizing surface (MS/BS), mineral apposition rate (MAR), and bone formation rate (BFR) analyzed in calcein double-labeled plastic sections of L1 vertebrae from the mice in (a). Mean ± SD (3-m-old WT (n = 5) and cKO (n = 6), 9-m-old WT (n = 7) and cKO (n = 7), 15-m-old WT (n = 5) and cKO (n = 6) biologically independent samples; *p < 0.05, **p < 0.01). f Representative H&E-stained images of vertebral sections from 9-m-old WT and cKO mice showing osteoblasts (yellow arrows) on the trabecular bone (Tr.B) surfaces, and histomorphometric analysis of osteoblast surfaces (OB.S/BS) from the mice in (a). Mean ± SD (3-m group: n = 4, other groups: n = 6 biologically independent samples; **p < 0.01). Scale bar, 100 μm. g Serum osteocalcin values tested by ELISA from the 3-, 9-, and 15-m-old WT and cKO mice in (a). Mean ± SD (n = 8 biologically independent samples; **p < 0.01). h Representative images of TRAP-stained vertebral sections from 9-m-old WT and cKO mice, and histomorphometric analysis of osteoclast numbers (Oc.N) and surfaces (Oc.S) from the mice in (a). Mean ± SD (3-m group: n = 5, other groups: n = 6 biologically independent samples; *p < 0.05). Scale bar, 100 μm. i Serum TRACP-5b levels tested by ELISA from the mice in (a). Mean ± SD (n = 8 biologically independent samples; *p < 0.05, **p < 0.01). All analyses done using one-way ANOVA with Tukey’s post-hoc test
Fig. 2
Fig. 2
Impaired OB differentiation from cKO MPCs primed by TGFβ1. a, b Osteoblastic cells derived from BM cells from 3- and 9-m-old WT and TRAF3 cKO mice stained for alkaline phosphatase (ALP) activity (a). Some wells were counter-stained with eosin to assess ALP+ and total cell area (Ar.) and the % ALP+/total cell area (b). Mean ± SD (n = 3 biologically independent samples; **p < 0.01). c Osteoblastic cells derived from bone-derived MPCs (BdMPCs) from 3- and 9-m-old WT and cKO mice stained for ALP activity to quantify ALP+ cells. Mean ± SD (n = 3 biologically independent samples; **p < 0.01). d Numbers of cells derived from BdMPCs from 3- and 9-m-old WT and cKO mice cultured for 1–8 days in 6-well plates. Mean ± SD (n = 3 biologically independent samples; **p < 0.01). e Cell cycle status of previously starved BdMPCs from 3-m-old WT and cKO mice analyzed by flow cytometry. Mean ± SD (n = 5 biologically independent samples; *p < 0.05). f, g Total (f) and active (g) TGFβ1 levels in serum from 3- and 9-m-old WT and cKO mice tested by ELISA. Mean ± SD; from left to right: 3-m-old WT (n = 7) and cKO (n = 6), 9-m-old WT (n = 14) and cKO (n = 15 biologically independent samples; *p < 0.05, **p < 0.01). hj BdMPCs generated from 3-m-old WT and cKO mice pre-treated with vehicle (V) or TGFβ1 (Tβ1; 1 ng/ml) for 7 days followed by treatment for OB differentiation for 7 days without TGFβ1. i ALP+ cell area and j ALP+ area % in total area. Mean ± SD (n = 3 biologically independent samples; **p < 0.01). km Data similar to those in (h–j) for 9-m-old WT and cKO mice. Mean ± SD (n = 3 biologically independent samples; **p < 0.01). Analyses in (b) and (e) done using unpaired Student's t test; all others done using one-way ANOVA with Tukey’s post-hoc test. All in vitro experiments were repeated twice with similar results
Fig. 3
Fig. 3
Age-related TGFβ activation promotes TRAF3 degradation. a TRAF3 and GAPDH WBs of tibial metaphyses, femoral BM and cortical bone from 3- and 18-m-old C57BL/6 mice. b Densitometry of TRAF3 WBs of bones from patients. Mean ± SD; 8–18-years (n = 26), 53–59-years (n = 11), 60–69-years (n = 10), 70–87-years (n = 8 biologically independent samples; *p < 0.05, **p < 0.01). c TRAF3 and osteocalcin (Ocn) immunostained vertebral sections. TRAF3+/Ocn+ osteoblasts (yellow arrows) on trabecular bone (Tr.B) surfaces and TRAF3+ hematopoietic cells in BM. Mean ± SD (n = 4 biologically independent samples; **p < 0.01). Scale bar, 50 μm. d TRAF3 and GAPDH WBs of BdMPCs treated with PBS, TNF (20 ng/ml), TGFβ1 (1 ng/ml), BMP2 (100 ng/ml), or PTH (80 ng/ml) for 8 h. e WB of TGFβ1 in tibial metaphyseal lysates. f Active TGFβ1 levels in serum and BM from 2.5- and 19-m-old C57BL/6 mice. Mean ± SD (n = 7 biologically independent samples; **p < 0.01). g Total and active TGFβ1 levels in vertebral lysates. Mean ± SD (children (8–18-years) n = 22; and adults (55–87-years) n = 20 biologically independent samples; *p < 0.05). h BdMPCs treated with vehicle or TGFβ1+/−chloroquine (100 μM) or MG132 (20 μM) for 8 h. IP using anti-Ub Ab and WB with TRAF3 Ab. Likely mono- and poly-ubiquitinated TRAF3 (lower and upper arrowheads, respectively). i Calvarial pre-OBs treated with vehicle or TGFβ1+/−300  nM AT406 for 8 h. IP with anti-TGFβRI Ab and WB with cIAP1/2, TRAF3 and TGFβRI Abs, or IP with anti-cIAP1/2 Ab and WB with TRAF3 Ab. j WB of cIAP2, TRAF3, and GAPDH in cells in (i). k Areas of ALP+ cells from BdMPCs treated with TGFβ1+/−AT406 for 5 days. Mean ± SD (n = 4 biologically independent samples; *p < 0.05, **p < 0.01). l IF and area of TRAF3 and LAMP2 co-localization in BdMPCs treated with vehicle or TGFβ1 plus chloroquine for 8 h. Mean ± SD (n = 4 biologically independent samples; **p < 0.01). Scale bar, 20 μm. m WB of TRAF3 and GAPDH in BdMPCs treated with vehicle or TGFβ1+/−chloroquine for 8 h. n Areas of ALP+ cells from WT and cKO BdMPCs treated with vehicle or TGFβ1+/−chloroquine for 5 days. Mean ± SD (n = 5 biologically independent samples; *p < 0.05, **p < 0.01 vs. TGFβ1 alone. Analyses in (c, g, l) done using unpaired Student's t test and in (b, f, k, n) using one-way ANOVA with Tukey’s post-hoc test). All in vitro experiments repeated twice with similar results. Tβ1: TGFβ1 (1 ng/ml)
Fig. 4
Fig. 4
Reduction in TRAF3 activates GSK-3β to impair β-catenin signaling. a WB of TRAF3 and β-catenin in long bones. b WB of TRAF3, β-catenin, and GAPDH in WT BdMPCs induced for OB differentiation with vehicle or TGFβ1. c IF and quantification of nuclear β-catenin and β-actin (cytoskeleton) in WT and cKO calvarial pre-OBs treated with vehicle or TGFβ1 for 48 h following pMX-GFP control or pMX-TRAF3 retrovirus infection. Mean ± SD (n = 4 biologically independent samples; *p < 0.05, **p < 0.01). Scale bar, 20 μm. d WB of TRAF3 and GAPDH in cells as in (c). e WB of TRAF3, phospho-GSK-3β (Tyr216/Ser9), and total GSK-3β in cortical bones from 12-m-old WT and TRAF3 cKO mice. f WB of β-catenin, phospho-GSK-3β (Ser9/Tyr216), total GSK-3β, HA, and GAPDH in WT calvarial pre-OBs treated with vehicle or TGFβ1 for 48 h following lentivirus infection with GFP, or HA-tagged WT-, Ser9-mutated (S9m) or Tyr216-mutated (Y216m) GSK-3β. g Protein levels of TRAF3, phospho-β-catenin, β-catenin, phospho-GSK-3β (Ser9/Tyr216), and total GSK-3β tested in WT calvarial pre-OBs treated with vehicle or TGFβ1 for 8 h following pMX-GFP or -TRAF3 retrovirus infection. h Cell lysates from (g) immunoprecipitated using anti-TGFβRI Ab followed by WB of GSK-3β and phospho-GSK-3β (Tyr216). i BdMPCs from 4-m-old WT and cKO mice treated with TGFβ1+/−GSK-3β inhibitor, SB-216763, for 7 days and stained for ALP activity. j Quantification of ALP+ cell areas. Mean ± SD (n = 3 biologically independent samples; *p < 0.05, **p < 0.01, ***p < 0.001 vs. vehicle; #p < 0.05; ##p < 0.01; ###p < 0.001 vs. TGFβ1 alone; one-way ANOVA with Tukey’s post-hoc test). k, l WB of phospho-GSK-3β (Tyr216) in WT and cKO BdMPCs treated with TGFβ1 plus SB-216763 (k), and densitometry analysis was performed (l). Mean ± SD (n = 3 biologically independent samples; *p < 0.05, **p < 0.01, ***p < 0.001 vs. vehicle; #p < 0.05; ##p < 0.01; ###p < 0.001 vs. TGFβ1 alone;). m pMX-GFP or -TRAF3 retrovirus-infected cells induced for OB differentiation for 5 days in 48-well plates and stained for ALP activity. n Quantification of ALP+ cell areas. Mean ± SD (n = 3 biologically independent samples; *p < 0.05; unpaired Student's t test). All other analyses done using one-way ANOVA with Tukey’s post-hoc test. All experiments were repeated twice with similar results. Tβ1: TGFβ1 (1 ng/ml)
Fig. 5
Fig. 5
RANKL expression is increased in TRAF3 cKO osteoblastic cells. a Calvarial pre-OBs and spleen cells isolated from 7-day-old WT or cKO pups, co-cultured with 10−8 M 1,25(OH)2Vitamin D3 −/+ RANK:Fc (1 µg/ml) for 7 days and TRAP-stained. b Osteoclast numbers per well (Oc.N/well) in (a) were counted. Mean ± SD (n = 4 biologically independent samples; #p < 0.05, **p < 0.01). c WB of TRAF3, OPG, RANKL, and GAPDH in protein lysates from tibial metaphyseal bone from 3- and 9-m-old WT and cKO mice. d Densitometry analysis of RANKL/OPG protein ratio in (c). Mean ± SD (n = 3 biologically independent samples; *p < 0.05). e RANKL mRNA expression in BdMPCs from 3- and 9-m-old WT and cKO mice. Mean ± SD (n = 3 biologically independent samples; *p < 0.05, **p < 0.01). f BdMPCs from 3-m-old WT and cKO mice treated with TGFβ1 (1 ng/ml) for 0, 0.5, and 8 h. WB of RelA, RelB, HDAC2, and GAPDH in nuclei and cytoplasm. g Scheme for mouse RANKL promoter analysis showing putative κB binding sites and primer design to test binding sites. h, i Sheared chromatin from WT and cKO BdMPCs was used to perform DNA IP using h RelA, i RelB Abs or IgG control. Real-time PCR performed using designed primers that contain the putative κB binding sites 1, 2, 3, or an unrelated site, normalized to the input. Mean ± SD; n = 3 biologically independent samples; *p < 0.05. j Sheared chromatin from WT (W) and cKO (K) BdMPCs used to perform DNA IP using RelA, RelB, or IgG control Abs. PCR performed using designed primers that contain the putative κB binding sites 1, 2, 3, and an un-related site. All analyses done using one-way ANOVA with Tukey’s post-hoc test. All the in vitro experiments repeated twice with similar results
Fig. 6
Fig. 6
RelA and RelB increase RANKL expression by MPCs. Calvarial pre-osteoblasts from 7-day-old WT mice were infected with GFP control, RelA, or RelB retroviruses for 48 h. a RelA and b RelB mRNA expression tested by real-time PCR to confirm successful over-expression. Mean ± SD (n = 3 biologically independent samples; **p < 0.01; unpaired Student's t test). c RANKL mRNA expression tested by real-time PCR. Mean ± SD (n = 3; *p < 0.05, **p < 0.01; one-way ANOVA with Tukey’s post-hoc test). d Culture media collected from culture wells and RANKL protein levels measured by ELISA. Mean ± SD (n = 3 biologically independent samples; no significant difference; one-way ANOVA with Tukey’s post-hoc test). e Membrane-bound RANKL levels in 50,000 CD45-Sca-1+ MPCs tested by flow cytometry and expressed as mean fluorescence intensity (MFI). Average of 2 biologically independent samples from two individual experiments. All the in vitro experiments were repeated twice with similar results
Fig. 7
Fig. 7
Model of TRAF3 degradation during aging leading to bone loss. (1) During aging, increased RANKL expressed by MPCs induces TRAF3 ubiquitination and subsequent lysosomal degradation in osteoclast precursors (OCP) to stimulate osteoclast formation and bone resorption through NF-κB,. As a result, increased amounts of TGFβ are released from bone matrix and activated in the acid environment in resorption lacunae. (2) Activated TGFβ induces TRAF3 ubiquitination and subsequent lysosomal degradation in MPCs. As a result, both RelA and RelB are activated to promote RANKL production, further enhancing bone resorption. In addition, (3) in MPCs, TRAF3 binds to the TGFβR and negatively regulates GSK-3β activity to prevent β-catenin degradation, allowing β-catenin accumulation and nuclear translocation to maintain osteoblast differentiation and secretion of OPG, which limits osteoclast formation. During aging, TGFβ1 degrades TRAF3 and phosphorylates Tyr216 to activate GSK-3β, resulting in degradation of β-catenin to inhibit osteoblast differentiation and OPG secretion to promote osteoclast formation along with increased RANKL expression and bone loss. In young WT mice, TGFβ levels in bone, BM, and serum are not increased and TRAF3 is present to limit these processes

Similar articles

Cited by

References

    1. Khosla S. Pathogenesis of age-related bone loss in humans. J. Gerontol. A Biol. Sci. Med. Sci. 2013;68:1226–1235. doi: 10.1093/gerona/gls163. - DOI - PMC - PubMed
    1. Demontiero O, Vidal C, Duque G. Aging and bone loss: new insights for the clinician. Ther. Adv. Musculoskelet. Dis. 2012;4:61–76. doi: 10.1177/1759720X11430858. - DOI - PMC - PubMed
    1. Seeman E. Pathogenesis of bone fragility in women and men. Lancet. 2002;359:1841–1850. doi: 10.1016/S0140-6736(02)08706-8. - DOI - PubMed
    1. Weitzmann MN, Pacifici R. Estrogen deficiency and bone loss: an inflammatory tale. J. Clin. Invest. 2006;116:1186–1194. doi: 10.1172/JCI28550. - DOI - PMC - PubMed
    1. Yu B, Wang CY. Osteoporosis: the result of an ‘aged’ bone microenvironment. Trends Mol. Med. 2016;22:641–644. doi: 10.1016/j.molmed.2016.06.002. - DOI - PMC - PubMed

Publication types

Substances