. 2019 May 30;177(6):1507-1521.e16.
doi: 10.1016/j.cell.2019.03.045. Epub 2019 Apr 25.

Hypoxia Rescues Frataxin Loss by Restoring Iron Sulfur Cluster Biogenesis

Affiliations

Hypoxia Rescues Frataxin Loss by Restoring Iron Sulfur Cluster Biogenesis

Tslil Ast et al. Cell. .

Abstract

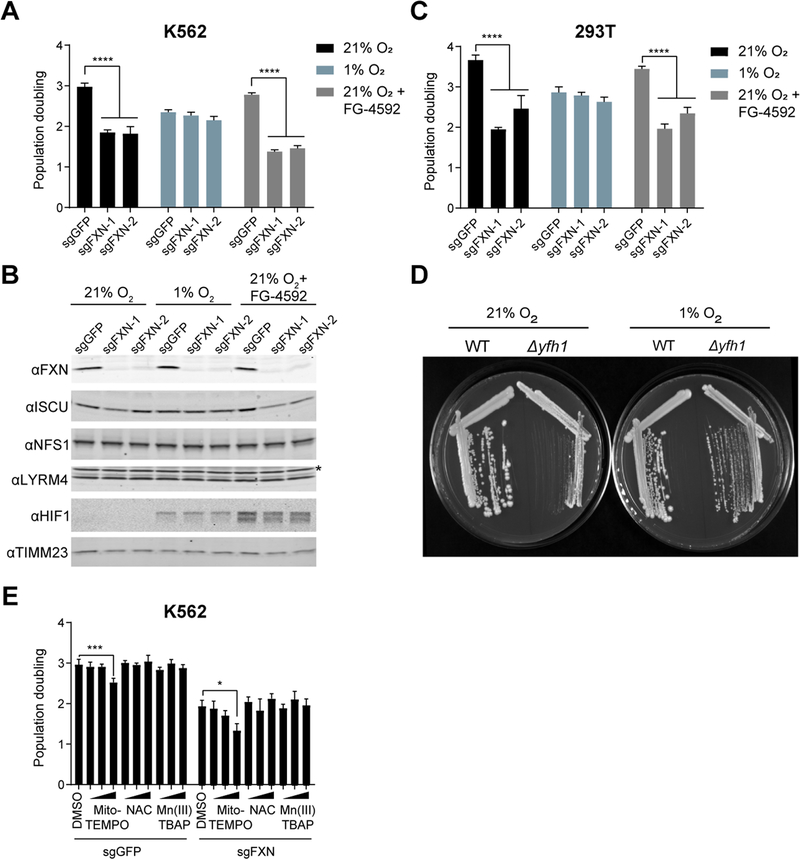
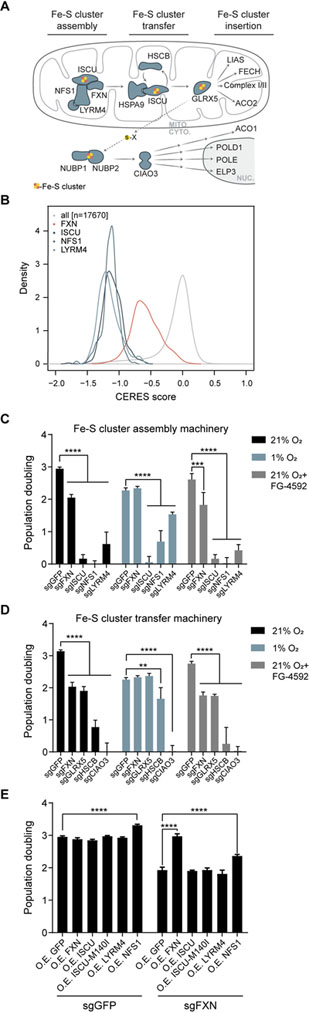
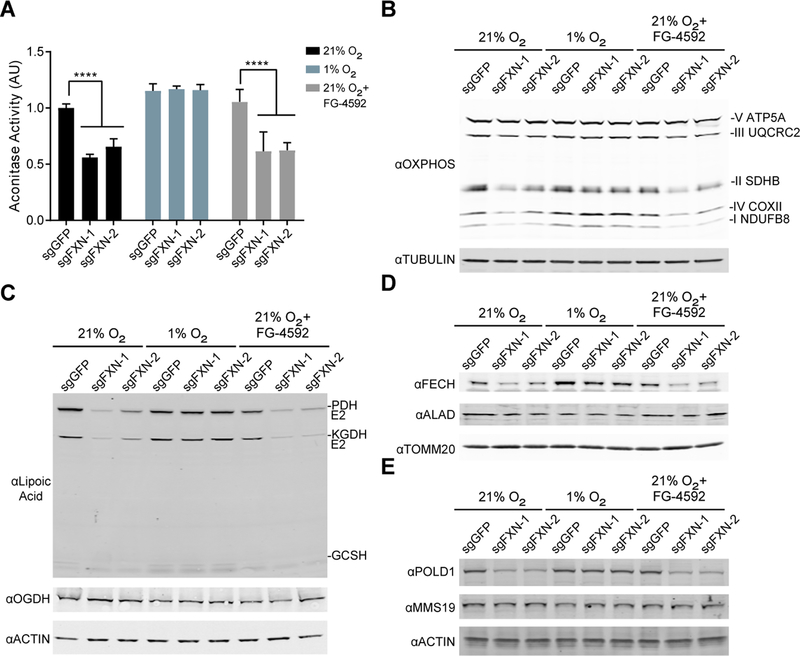
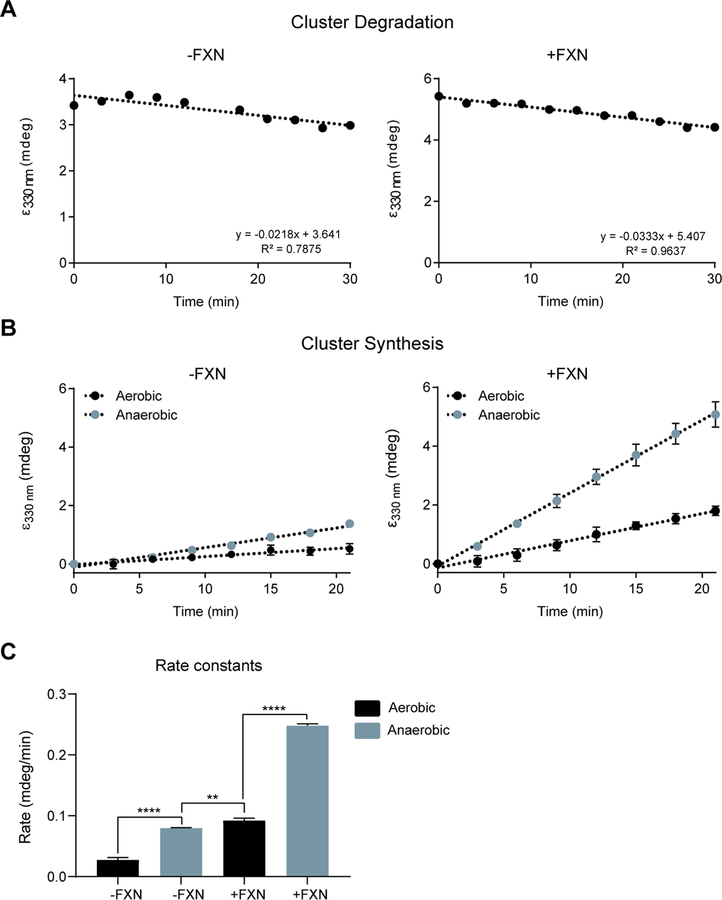
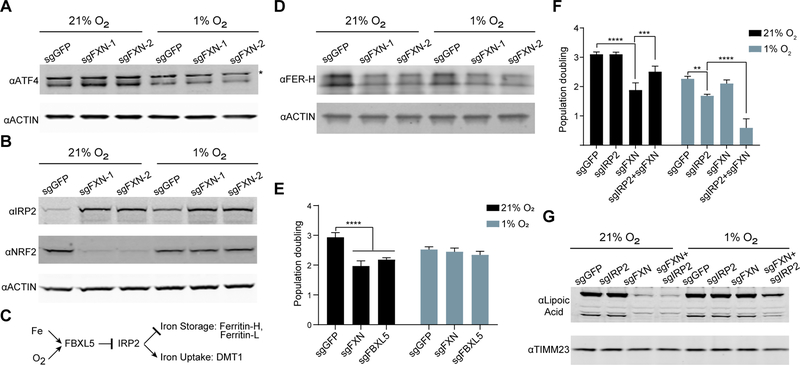
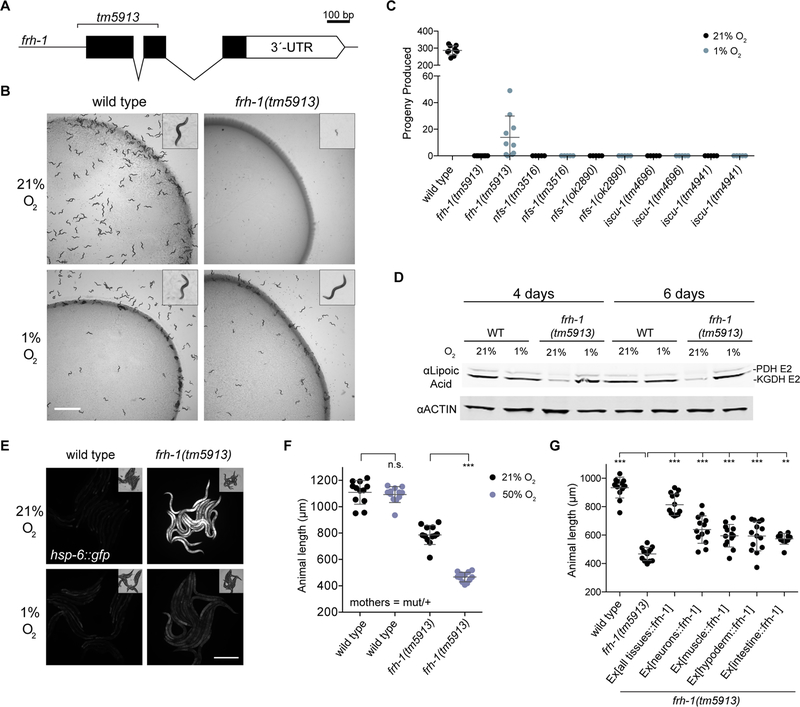
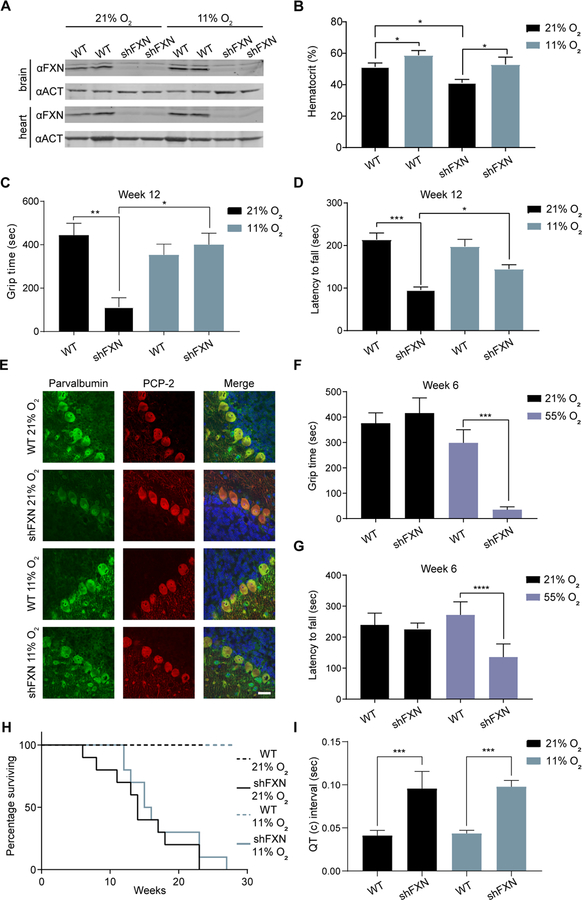
Friedreich's ataxia (FRDA) is a devastating, multisystemic disorder caused by recessive mutations in the mitochondrial protein frataxin (FXN). FXN participates in the biosynthesis of Fe-S clusters and is considered to be essential for viability. Here we report that when grown in 1% ambient O2, FXN null yeast, human cells, and nematodes are fully viable. In human cells, hypoxia restores steady-state levels of Fe-S clusters and normalizes ATF4, NRF2, and IRP2 signaling events associated with FRDA. Cellular studies and in vitro reconstitution indicate that hypoxia acts through HIF-independent mechanisms that increase bioavailable iron as well as directly activate Fe-S synthesis. In a mouse model of FRDA, breathing 11% O2 attenuates the progression of ataxia, whereas breathing 55% O2 hastens it. Our work identifies oxygen as a key environmental variable in the pathogenesis associated with FXN depletion, with important mechanistic and therapeutic implications.


Conflict of interest statement

Declaration of Interests:

VKM is on the scientific advisory boards of Raze Therapeutics, Janssen Pharmaceuticals, and 5AM Ventures. WMZ is on the scientific advisory board of Third Pole Therapeutics. GR is on the scientific advisory boards of Calico Life Sciences and the Glenn Medical Foundation and is cofounder of Marvelbiome. GR has filed for patents on the interaction of mitochondrial mutants with bacterial siderophore mutations and acetobacteria. VKM and WMZ are listed as an inventors on a patent application filed by Massachusetts General Hospital on the use of hypoxia as a therapy for mitochondrial and degenerative diseases.

Figures

Figure 1-
Figure 1-. Growth of cells lacking FXN can be complemented by hypoxia.
(A) Three-day proliferation assay of control or FXN KO K562 cells. Cells were grown in 21% O2, 1% O2 or 21% O2 with 75 μM FG-4592, which stabilizes HIF1a regardless of oxygen tensions. (B) Immunoblot of control or FXN KO cells grown in 21% O2, 1% O2 or 21% O2 with 75μM FG-4592, blotted for FXN, ISCU, NFS1, LYRM4, HIF1a and TIMM23. Asterisk indicates a non-specific band. (C) Three-day proliferation assay of control or FXN KO 293T cells. Cells were grown in 21% O2, 1% O2 or 21% O2 with 75μM FG-4592. (D) Growth of WT or Δyfh1 yeast in 21% O2 or 1% O2. (E) Three-day proliferation assay of control or FXN KO K562 cells in 21% O2 supplemented with DMSO or the antioxidants Mito-TEMPO (5nM,50nM,500nM), NAC (5μM,50μM,500μM) or Mn(III)TBAP (1μM,10μM,100μM). All bar plots show mean ± SD. *=p < 0.05, ***=p < 0.001, ****=p < 0.0001. One-way ANOVA with Bonferroni’s post-test. See also Figure S1.
Figure 2-
Figure 2-. FXN is unique among the ISC assembly machinery in its ability to be rescued by hypoxia.
(A) Model of Fe-S cluster biosynthesis in eukaryotic cells. (B) Growth defects of gene CRISPR knock-outs are shown across 342 cancer cell lines from the Cancer Dependency Map, demonstrating that the Fe-S machinery is more essential (lower CERES score) than most genes and that ISCU, NFS1 and LYRM4 are more essential than FXN. Histograms are normalized via the kernel density function to equalize the area under each curve. (C) Three-day proliferation assay of K562 cells KO for the Fe-S assembly machinery- FXN, ISCU, NFS1 or LYRM4- vs. control cells. Cells were grown in 21% O2, 1% O2 or 21% O2 with 75μM FG-4592 (D) Three-day proliferation assay of K562 cells KO for FXN or the Fe-S cluster transfer machinery- GLRX5, HSCB or CIAO3- vs. control cells. Cells were grown in 21% O2, 1% O2 or 21% O2 with 75μM FG-4592 (E) Three-day proliferation assay of control or FXN KO K562 cells in 21% O2, overexpressing different subunits of the Fe-S assembly machinery, including the previously described ISCUM140I bypass mutant. All bar plots show mean ± SD. **=p < 0.01, ***=p < 0.001, ****=p < 0.0001. One-way ANOVA with Bonferroni’s post-test. See also Figure S2.
Figure 3-
Figure 3-. Steady state levels of Fe-S containing proteins are restored when FXN null cells are grown in hypoxia.
(A) Aconitase activity assay from control or FXN KO K562 cells grown in 21% O2, 1% O2 or 21% O2 with 75μM FG-4592. Bar plots show mean ± SD. ****=p < 0.0001. One-way ANOVA with Bonferroni’s post-test. (B) Immunoblot of control or FXN KO cells grown in 21% O2, 1% O2 or 21% O2 with 75μM FG-4592, blotted for OXPHOS subunits or Tubulin. (C) Immunoblot of control or FXN KO cells grown in 21% O2, 1% O2 or 21% O2 with 75μM FG-4592, blotted for Lipoic acid, which is conjugated to PDH-E2, KGDH-E2 and GCSH. Additional blots against OGDH (i.e. KGDH-E1) and Actin. (D) Immunoblot of control or FXN KO cells grown in 21% O2, 1% O2 or 21% O2 with 75μM FG-4592, blotted against enzymes in the heme biosynthesis pathway- FECH and ALAD- or TOMM20. (E) Immunoblot of control or FXN KO cells grown in 21% O2, 1% O2 or 21% O2 with 75μM FG-4592, blotted against POLD1, MMS19 or Actin. See also Figure S3.
Figure 4-
Figure 4-. In vitro Fe-S synthesis is activated by FXN and anoxia.
(A) CD intensity at 330 nm vs time of reaction for [2Fe-2S] cluster stability on ISCU-NFS1-LYRM4-ACPec complex without (left) and with (right) FXN. Clusters were generated under anaerobic conditions, and then exposed to aerobic buffer and ambient air. (B) CD intensity at 330 nm vs time of reaction for [2Fe-2S] cluster formation on ISCU-NFS1-LYRM4-ACPec complex without (left) and with (right) FXN. Clusters were formed under anaerobic or aerobic conditions. (C) Synthesis rate constants for [2Fe-2S] cluster formation on ISCU-NFS1-LYRM4-ACPec complex without (left) and with (right) FXN, under aerobic on anaerobic conditions. Data are represented as mean ± SD. **=p < 0.01, ***=p < 0.001, ****=p < 0.0001. One-way ANOVA with Bonferroni’s post-test. See also Figure S4.
Figure 5-
Figure 5-. Signaling pathways activated in FXN KO cells are restored in hypoxia.
(A) Immunoblot of control or FXN KO cells grown in 21% O2 or 1% O2, blotted for the integrated stress response transcription factor ATF4 or Actin. Asterisk indicates a non-specific band. (B) Immunoblot of control or FXN KO cells grown in 21% O2 or 1% O2, blotted for iron response protein IRP2, antioxidant response regulator NRF2, or Actin. (C) Schematic for IRP2 degradation, which is mediated by FBXL5 and is regulated by iron and oxygen. When IRP2 is stabilized, it activates iron uptake pathways and represses iron storage pathways. (D) Immunoblot of control or FXN KO cells grown in 21% O2 or 1% O2, blotted for Ferritin-H, a target of IRP2. Additional blot against Actin. (E) Three-day proliferation assay of control, FXN KO or FBXL5 KO cells in 21% O2 or 1% O2. (F) Three-day proliferation assay of control, FXN KO, IRP2 KO or double IRP2 FXN KO cells in 21% O2 or 1% O2. (G) Immunoblot of control, FXN KO, IRP2 KO or double IRP2 FXN KO cells in 21% O2 or 1% O2, blotted for Lipoic acid. Additional blot against TIMM23. All bar plots show mean ± SD. ***=p < 0.001, ****=p < 0.0001. One-way ANOVA with Bonferroni’s post-test. See also Figure S5.
Figure 6-
Figure 6-. FXN is dispensable for viability and Fe-S cluster biogenesis in C. elegans in hypoxia.
(A) The C. elegans frataxin null mutant, frh-1(tm5913), carries a 353 bp deletion and must be propagated as a balanced heterozygote at room air. (B) When incubated at 1% O2 frh-1(tm5913) mutants develop to adulthood and are fertile. Pictured are wild type animals grown for 2 days and frh-1(tm5913) mutants grown for 4 days. Scale bar = 3 mm. (C) Total progeny produced from animals incubated at 21% O2 or 1% O2. Mothers were balanced heterozygotes (mutant/+). (D) Immunoblot for lipoic acid in animals grown at 1% O2 or animals shifted as adults to normoxia for the indicated time. (E) hsp-6::gfp fluorescence in animals grown in 1% O2 or shifted to normoxia as adults for 4 days. Exposure time = 50 ms, scale bar = 500 μm. (F) Animal length after 4 days growth at 21% or 50% O2. Mothers were balanced heterozygotes frh-1(tm5913)/+. (G) Animal length after 3 days growth in hyperoxia. Mothers were balanced heterozygotes frh-1(tm5913)/+. All error bars represent standard deviation. *=p < 0.05, **=p < 0.01, ***=p < 0.001, ****=p < 0.0001. One-way ANOVA with Bonferroni’s post-test. See also Figure S6.
Fig 7-
Fig 7-. Hypoxia attenuates and hyperoxia hastens ataxia in a FRDA mouse model.
(A) Immunoblot from brain and heart of WT and shFXN mice housed in 21% O2 or 11% O2 at week 12, blotted for FXN and Actin. (B) Hematocrit measurements from WT and shFXN mice housed in 21% O2 or 11% O2 at week 8 (n≥ 3 per group). (C) Inverted screen test analysis for WT or shFXN mice housed in 21% O2 or 11% O2 at 12 weeks. Time to fall is represented (n≥ 7 per group). (D) Accelerating rotarod analysis for WT or shFXN KD mice housed in 21% O2 or 11% O2 at 12 weeks. Latency to fall measured as mean value of triplicate trials per mouse (n≥ 7 per group). (E) Representative images of Purkinje cell layer stained with parvalbumin, PCP-2 and Hoechst 33342 from WT or shFXN mice housed in 21% O2 or 11% O2. Scale bar = 30μm. (F) Inverted screen test analysis for WT or shFXN mice housed in 21% O2 or 55% O2 at 6 weeks. Time to fall is represented (n≥ 5 per group). (G) Accelerating rotarod analysis for WT or shFXN mice housed in 21% O2 or 55% O2 at 6 weeks. Latency to fall measured as mean value of triplicate trials per mouse (n≥ 5 per group). (H) Survival of WT or FXN knockdown (shFXN) mice housed in 21% O2 or 11% O2 (n=10 per group). (I) Quantification of corrected QT interval, as observed by ECG, of WT or shFXN mice housed in 21% O2 or 11% O2 at 12 weeks (n≥ 3 per group). All bar plots show mean ± SD. *=p < 0.05, **=p < 0.01, ***=p < 0.001, ****=p < 0.0001. One-way ANOVA with Bonferroni’s post-test. See also Figure S7.

Similar articles

Cited by

References

    1. Achebach S, Selmer T, and Unden G (2005). Properties and significance of apoFNR as a second form of air-inactivated [4Fe-4S].FNR of Escherichia coli. FEBS J 272, 4260–4269. - PubMed
    1. Alvarez SW, Sviderskiy VO, Terzi EM, Papagiannakopoulos T, Moreira AL, Adams S, Sabatini DM, Birsoy K, and Possemato R (2017). NFS1 undergoes positive selection in lung tumours and protects cells from ferroptosis. Nature 551, 639–643. - PMC - PubMed
    1. Andreini C, Banci L, and Rosato A (2016). Exploiting Bacterial Operons To Illuminate Human Iron-Sulfur Proteins. J Proteome Res 15, 1308–1322. - PubMed
    1. Andreini C, Rosato A, and Banci L (2017). The Relationship between Environmental Dioxygen and Iron-Sulfur Proteins Explored at the Genome Level. PLoS One 12, e0171279. - PMC - PubMed
    1. Anzovino A, Chiang S, Brown BE, Hawkins CL, Richardson DR, and Huang ML (2017). Molecular Alterations in a Mouse Cardiac Model of Friedreich Ataxia: An Impaired Nrf2 Response Mediated via Upregulation of Keap1 and Activation of the Gsk3beta Axis. Am J Pathol 187, 2858–2875. - PubMed

Publication types

MeSH terms