. 2019 May;22(5):719-728.
doi: 10.1038/s41593-019-0372-9. Epub 2019 Apr 1.

Senolytic therapy alleviates Aβ-associated oligodendrocyte progenitor cell senescence and cognitive deficits in an Alzheimer's disease model

Affiliations

Senolytic therapy alleviates Aβ-associated oligodendrocyte progenitor cell senescence and cognitive deficits in an Alzheimer's disease model

Peisu Zhang et al. Nat Neurosci. 2019 May.

Abstract

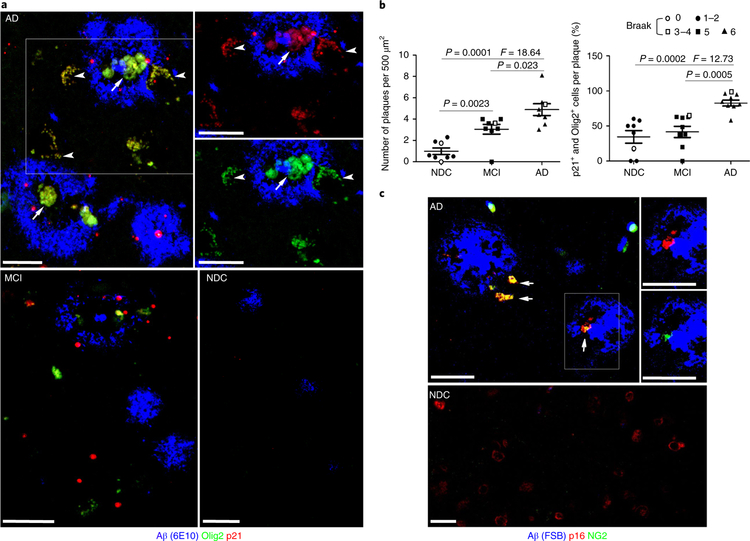
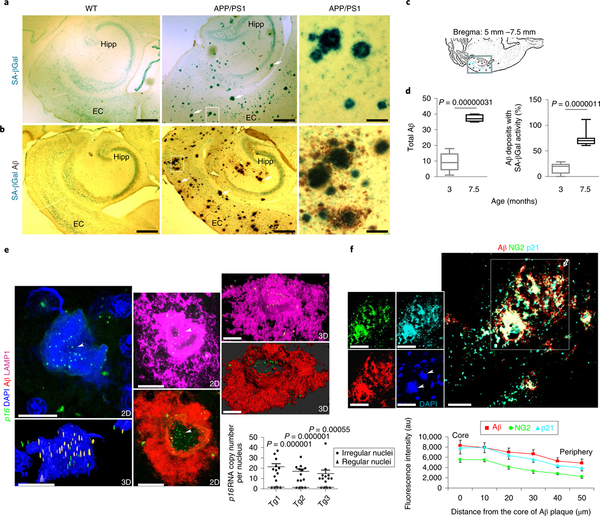
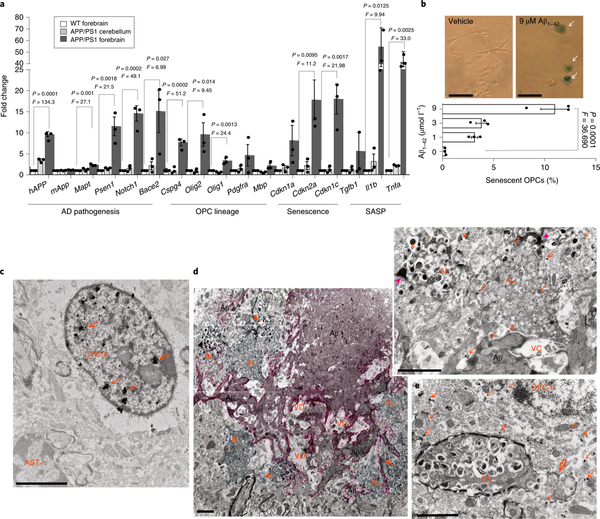
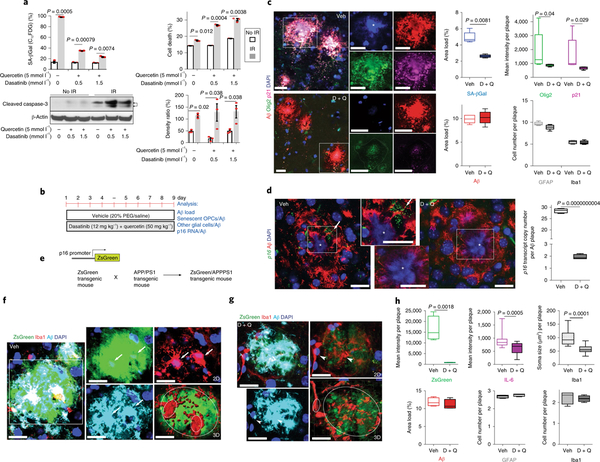
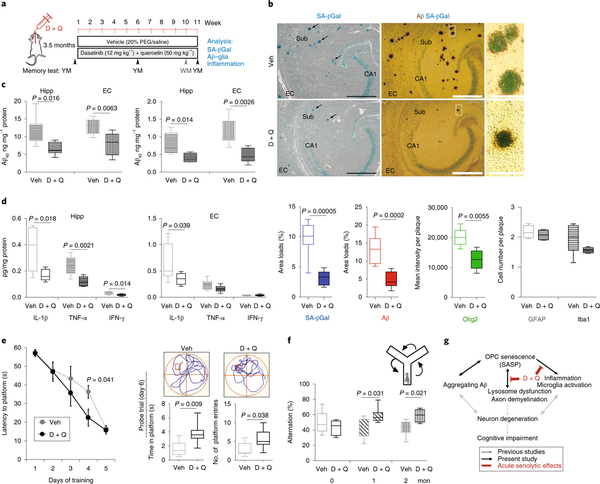
Neuritic plaques, a pathological hallmark in Alzheimer's disease (AD) brains, comprise extracellular aggregates of amyloid-beta (Aβ) peptide and degenerating neurites that accumulate autolysosomes. We found that, in the brains of patients with AD and in AD mouse models, Aβ plaque-associated Olig2- and NG2-expressing oligodendrocyte progenitor cells (OPCs), but not astrocytes, microglia, or oligodendrocytes, exhibit a senescence-like phenotype characterized by the upregulation of p21/CDKN1A, p16/INK4/CDKN2A proteins, and senescence-associated β-galactosidase activity. Molecular interrogation of the Aβ plaque environment revealed elevated levels of transcripts encoding proteins involved in OPC function, replicative senescence, and inflammation. Direct exposure of cultured OPCs to aggregating Aβ triggered cell senescence. Senolytic treatment of AD mice selectively removed senescent cells from the plaque environment, reduced neuroinflammation, lessened Aβ load, and ameliorated cognitive deficits. Our findings suggest a role for Aβ-induced OPC cell senescence in neuroinflammation and cognitive deficits in AD, and a potential therapeutic benefit of senolytic treatments.


Conflict of interest statement

Competing interests

The authors declare no competing interests.

Figures

Fig. 1|
Fig. 1|. OPCs exhibiting a senescence phenotype are associated with Aβ plaques in brains of patients with AD.
a, Confocal images showing Aβ (blue), Olig2 (green), and p21 (red) immunoreactivities in sections of inferior parietal cortex from a patient with AD, a patient with MCI, and an NDC subject. Arrows point to Aβ-associated cells that exhibit both Olig2 and p21 immunoreactivities (yellow). Arrowheads point to processes of OPCs associated with an Aβ plaque. The two panels at the upper right are higher magnifications of the plaque in the boxed area, b, Average numbers of Aβ plaques per 500 μm2 (left) and percentages of Aβ plaques harboring one or more p21 and Olig2 double-positive cells (right) (mean ± s.e.m.; n = 8 AD, 8 MCI, and 8 NDC subjects; 20 images analyzed in sections from MCI and AD brains and 10 images analyzed in sections from NDC brains). The statistical analysis was performed using one-way ANOVA followed by Dunnett’s post hoc tests. The symbols in the key shown above the graphs denote the Braak stage score for each subject, c, Confocal images showing FSB staining of labeled fibrillary Aβ (blue), p16 (red), and NG2 (green) immunoreactivities, in sections of inferior parietal cortex from a patient with AD and an NDC subject (these images are representative of images from brain sections from three patients with AD and three NDC subjects). Arrows point to Aβ-associated cells that exhibit both p16 (red) and NG2 (green) immunoreactivities. Scale bars, 20 μm.
Fig. 2 |
Fig. 2 |. Association of cellular senescence and OPC markers with Aβ plaques in the brains of APP/PS1 double-mutant transgenic mice.
a,b, SA-βGal staining alone (a) or in combination with Aβ immunohistochemical staining (b) in horizontal brain sections from 7.5-month-old APP/PS1 transgenic mice and wild-type (WT) littermate controls. Arrows point to SA-βGal foci and their associations with Aβ plaques. The rightmost panels show high magnification of the areas demarcated by the boxes in the middle panels. Hipp, hippocampus; EC, entorhinal cortex. Scale bars: left and middle panels, 100 μm; right panels, 40 μm. Images are representative of those observed in brain sections from three WT mice and three APP/PS1 transgenic mice (three sections examined from each brain), c, The box in the schematic illustration demarcates the hippocampal formation, from which counts of Aβ plaques and Aβ plaques with SA-βGal foci were made in brain sections of APP/PS1 mutant transgenic mice, d, The graphs show the Aβ load and percentage of Aβ plaques with SA-βGal activity in 3-month-old and 7.5-month-old APP/PS1 mice. Analyses were performed on three mice of each age (three sections from each brain were analyzed); significance was determined using the two-tailed Student’s t-test. e, Representative confocal images showing the intracellular accumulation of p16 mRNAs within an Aβ plaque in the brain of an 8-month-old APP/PS1 mouse. Arrowheads point to numerous copies of p16 mRNA (yellow and green puncta in two-dimensional (2D) and three-dimensional (3D) images representing p16 RNAs) and their spatial relationships with Aβ (red) as well as the intracellular organelles, lysosomal-associated membrane protein 1 (LAMPI)-labeled lysosomes (pink), and 4,6-diamidino-2-phenylindole (DAPI)-labeled nuclei (blue); scale bar,15μm. Also see the 3D animations in Supplementary Videos 1, 2, and 3. The images are representative of 12–15 plaque-associated cells examined per brain (n = 3 mice). The graph shows a comparison of the pl6 mRNA levels in Aβ-associated cells, and cells not associated with Aβ. Values are the mean and s.e.m. (n = 3 mice per group); significance is determined using the two-tailed Student’s t-test. Tgl, Tg2, and Tg3 denote three different APP/PS1 mutant transgenic mice, f, Confocal images showing Aβ deposit-associated cells exhibiting the co-localization of Aβ immunoreactivity (red) with the OPC (green) and the senescence marker p21 (cyan blue) in a brain section from a 7.5-month-old APP mouse. The leftmost inserts are unmerged images in the boxed area. Arrowheads point to DAPI-labeled irregular nuclei in the plaque. The asterisk and open arrow mark the core and periphery of the Aβ plaque, respectively. Scale bar, 20 μm. The images are representative of those observed in brain sections from 3 different mice (25 plaques examined from each brain). The graph shows the relative fluorescence intensities of the indicated protein markers from the core to the peripheral edge of the plaque (values are the mean and s.e.m. of measurements made on 25 plaques).
Fig. 3 |
Fig. 3 |. Molecular and ultrastructural features of Aβ-associated OPC senescence.
a, Relative levels of the indicated mRNAs in laser-captured tissue samples from the forebrain of wild-type (WT, white bars) mice, and plaque-bearing forebrain (gray bars) and plaque-free cerebellar tissues (light gray bars) of APP/PS1 mice. Levels of the mRNAs were normalized to the levels of Actb mRNA in the same sample and values were expressed as fold change (mean and s.e.m.; n = 3 mice per group). The statistical analysis was performed with one-way ANOVA followed by Dunnett’s post hoc tests, b, Exposure to Aβ1–42 triggers cellular senescence in mouse embryonic stem cell-derived OPCs. On exposure to pre-aggregating Aβ1–42 or vehicle for 7 days, OPC cultures were assayed for SA-βGal activity. Arrows point to enlarged senescent OPCs. The graph shows the percentage of SA-βGal+ cells (values are the mean and s.e.m. of determinations made on 150–200 cells in 3 independent experiments). The statistical analysis was performed with one-way ANOVA followed by Dunnett’s post hoc tests. Scale bar, 20 μm. c–e, Forebrain tissues from 7.5-month-old APP/PS1 mutant mice were processed for double-labeled, preembedding, immunoelectron microscopy using antibodies against Olig2 (immunogold particles) and Aβ (3,3’-diaminobenzidine (DAB) reaction product). Scale bars, 2μm. c, Electron micrograph showing Olig2 immunolabeling exclusively located in the nucleus of an OPC (OPC-n) from a region of cerebral cortex devoid of Aβ. Arrows point to Olig2+silver-enhanced gold particles. Note that there is no Olig2 immunoreactivity in the nucleus of an adjacent astrocyte (AST-n). d, Electron micrographs showing the core (Aβ) and the periphery branches (Aβ’) of an amyloid plaque (pink shading). Cells located in the Aβ plaque environment are filled with autolysosomes (green shading). The upper right insert is a higher magnification of boxed area showing Olig2+immunogold particles in the cytoplasm and autolysosomes (arrows). Arrowheads point to an Aβ deposit directly contacting a cell filled with autolysosomes; AL, autolysosomes; VD, region of vacuolar degeneration, e, Electron micrograph showing a lightly myelinated (open arrow) dystrophic neurite filled with autolysosomes. An Olig2+ OPC is closely associated with the dystrophic neurite. OPC-n, OPC nucleus. Images are representative of 7 brain regions devoid of Aβ and 24 brain regions with plaques examined.
Fig. 4 |
Fig. 4 |. Senolytic treatment selectively kills p16- and p21-expressing OPCs from the Aβ plaque environment in AD mice.
a, N2a cells were first exposed to ionizing radiation (IR; 10 Gy) to induce replicative senescence; 5 days later cells were treated with the indicated concentrations of D + Q for 24 h before FACS and immunoblot analysis. Top: graphs showing quantification of SA-βGal activity and cell viability by FACS. Bottom: cleaved caspase-3 immunoblot and graph showing results of densitometric analysis (samples from n = 3 mice; significance determined using the two-tailed Student’s t-test). b, Experimental design for 9-day administration of D + Q once daily in 7.5-month-old APP/PS1 mice, c, The images show Aβ, Olig2, and p21 immunoreactivities in brain sections from APP/PS1 mice treated with vehicle (Veh, upper panels) or D + Q (lower panels) for 9 days. The graphs show the results of quantifications of Aβ load and plaque-associated SA-βGal, Olig2, p21, Ibal, and GFAP immunoreactivities. Values are the mean and s.e.m. of determinations made on 5 mice per group (12–15 plaques analyzed per mouse), d, Confocal images and graphs showing the level of p16 RNAs in Aβ plaques from the brains of APP/PS1 mice that underwent short-term treatment with vehicle or D + Q. The arrow points to a cluster of p16 mRNA puncta accumulated in the cytoplasm next to a nucleus (*) within the Aβ environment in the vehicle-treated mouse. Values are the mean and s.e.m. of determinations made on 3 mice per group (12–15 plaques analyzed per mouse), e, Breeding scheme for generating APP/PS1 double-mutant senescence reporter mice. f,g, Images showing Aβ (cyan) and Ibal (red) immunoreactivities and ZsGreen fluorescence (p16 reporter) in plaques of APP/PS1 AD mice that underwent 9-day treatment with either vehicle (f) or D + Q (g). Arrows (f), arrowheads (g), and small circles in three-dimensional images indicate activated microglia and deactivated microglia, respectively. Scale bar,20μm. h, Graphs show levels of ZsGreen fluorescence intensity per plaque, Aβ plaque load, GFAP-immunoreactive cells per plaque, interleukin-6 (IL-6) level/plaque, the soma size, and cell number of Iba1+microglia/plaque in vehicle- and D + Q-treated mice. Values are the mean and s.e.m. of determinations made on 3 mice per group (12–15 plaques analyzed per mouse).
Fig. 5 |
Fig. 5 |. Long-term senolytic treatment prevents Aβ accumulation and hippocampus-dependent cognitive impairment in APP/PS1 AD mice.
a, Experimental design for 11-week intermittent administration (once per week beginning at 3.5 months of age) of D + Q and vehicle control in female APP/PS1 mice. YM, Y maze; WM, water maze. PEG, polyethylene glycol, b, Images of hippocampus from the brain sections in the vehicle (Veh) control group (upper) and in the D + Q group (lower) showing SA-βGal staining (blue) alone (left) and in combination with Aβ immunohistochemical staining (brown) (middle). Arrows point to Aβ plaque-associated SA-βGal staining. Right: high-magnification views of the boxed areas shown in the middle panels. Scale bars: left and middle,100 μm; right, 40 μm. The graphs show the results of quantitative analysis of SA-βGal staining, Aβ load, and plaque-associated Olig2-, Ibal-, and GFAP-immunoreactive cells in the hippocampus in vehicle (open bars) and D + Q (solid bars) groups. All values are the mean and s.e.m. of measurements made on five sections per mouse from vehicle (six mice) and D + Q (eight mice) groups. Sub, subiculum. c,d, Graphs showing concentrations of Aβ40 and Aβ42 (c) and cytokines (d) in lysates of hippocampus (Hipp) and entorhinal cortex (EC) from mice in the D + Q (n = 8) and vehicle (n = 6) groups. Values are the mean and s.e.m. IFN-γ, interferon-γ. e, Water maze test. Goal latencies during the 5-day acquisition training trials (left), and a probe trial performed 24 h after the final day of training (right). On training day 4 the D + Q group (n = 8 mice) took significantly less time to reach the hidden platform compared with mice in the vehicle control group (n = 6 mice). In the probe trial the D + Q group spent significantly more time in the platform area and had significantly more platform-site entries, compared with the vehicle control group. The swimming paths in the probe trial of representative mice in the vehicle and D + Q groups are shown above the graphs (the red square marks the location where the platform had been during the goal acquisition trials). Significance was determined using the two-tailed Student’s t-test. f, Top: schematic of the Y-maze working memory task. Bottom: percentage of spontaneous alternations were measured at baseline and during experimental weeks 6 and 11 for the D + Q group (n = 8) and the vehicle group (n = 6). All values are the mean and s.e.m. (ANOVA with Dunnett’s post hoc tests), g, A working model for the involvement of OPC senescence in the pathogenesis of AD. OPCs are recruited into developing Aβ plaques where the aggregating Aβ induces OPC senescence. The SASP of the OPCs may trigger or enhance the local activation of microglia and production of proinflammatory cytokines. A positive feedback among aggregating Aβ, senescent OPCs, and inflammation may cause demyelination and neuronal dysfunction and degeneration, resulting in cognitive impairment. D + Q senolytic treatment rapidly eliminates senescent OPCs and reduces neuroinflammation and, with continued intermittent treatment, reduces Aβ accumulation and ameliorates cognitive deficits. Black and gray arrows indicate the processes supported by data in the present study and previous studies,, respectively. Acute senolytic effects are shown in red.

Comment in

Similar articles

Cited by

References

    1. Wyss-Coray T Inflammation in Alzheimer disease: driving force, bystander or beneficial response? Nat. Med 12, 1005–1015 (2006). - PubMed
    1. Nixon RA The role of autophagy in neurodegenerative disease. Nat. Med 19, 983–997 (2013). - PubMed
    1. Scheltens P et al. Alzheimer’s disease. Lancet 388, 505–517 (2016). - PubMed
    1. Malm TM, Jay TR & Landreth GE The evolving biology of microglia in Alzheimer’s disease. Neurotherapeutics 12, 81–93 (2015). - PMC - PubMed
    1. Muñoz-Espín D & Serrano M Cellular senescence: from physiology to pathology. Nat. Rev. Mol. Cell Biol 15, 482–496 (2014). - PubMed

Publication types

MeSH terms