. 2019 Jun;38(24):4669-4684.
doi: 10.1038/s41388-019-0749-y. Epub 2019 Feb 11.

mTORC2-mediated PDHE1α nuclear translocation links EBV-LMP1 reprogrammed glucose metabolism to cancer metastasis in nasopharyngeal carcinoma

Affiliations

mTORC2-mediated PDHE1α nuclear translocation links EBV-LMP1 reprogrammed glucose metabolism to cancer metastasis in nasopharyngeal carcinoma

Jun Zhang et al. Oncogene. 2019 Jun.

Abstract

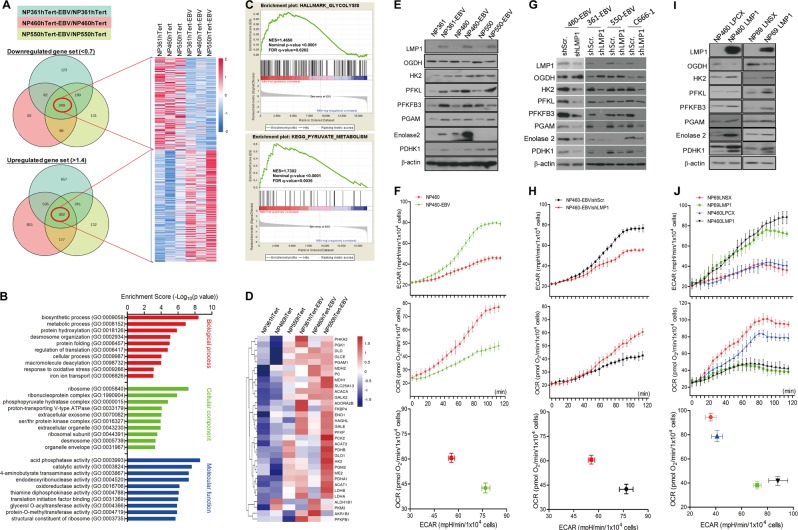
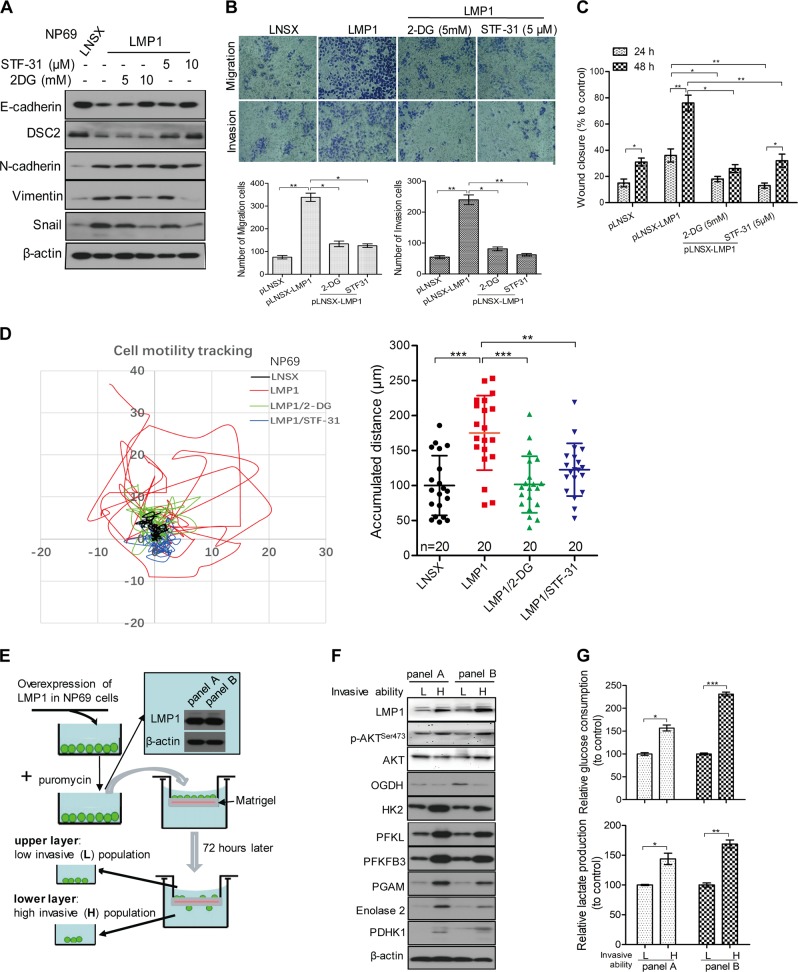
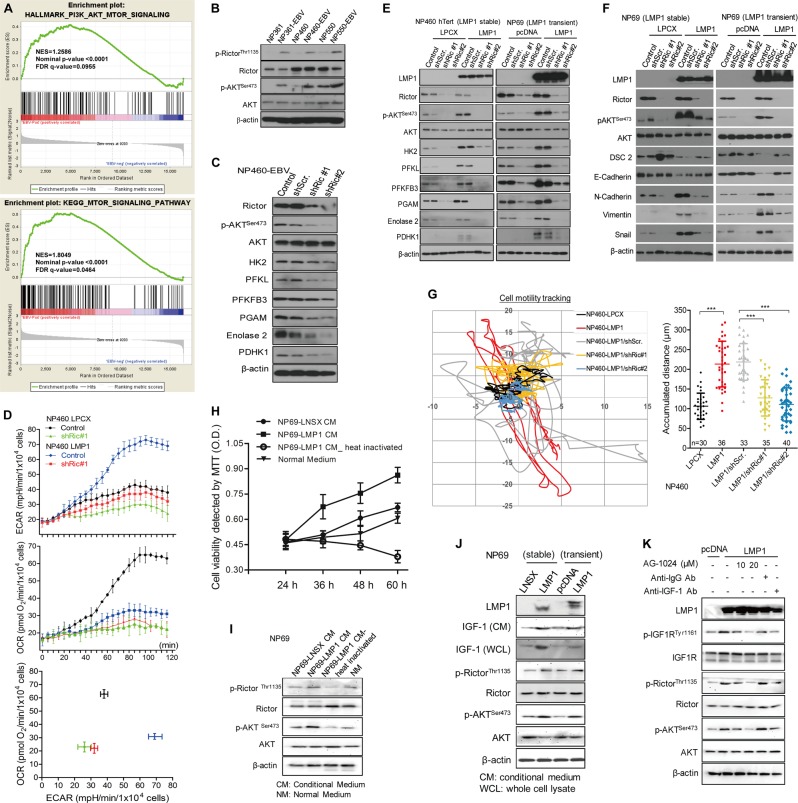
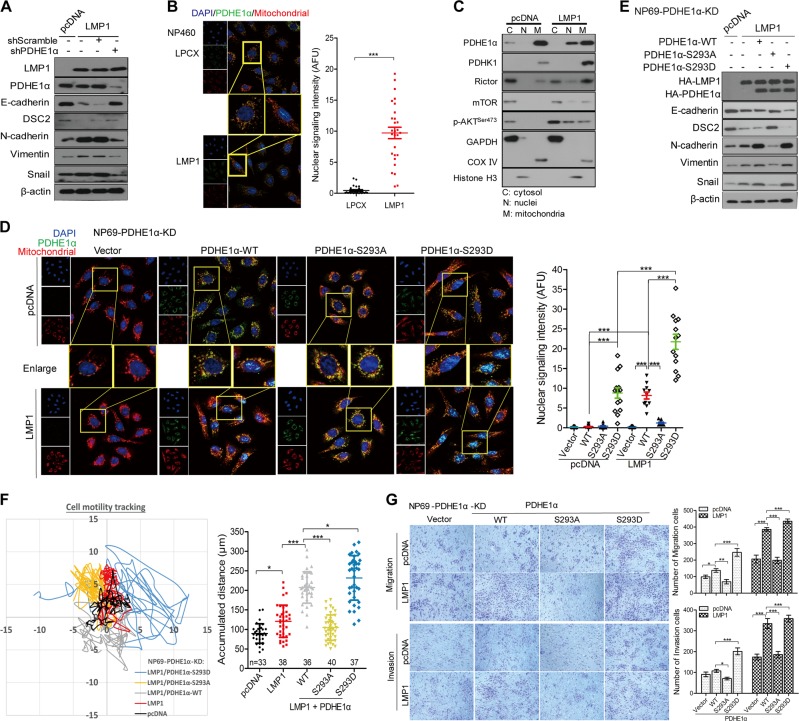
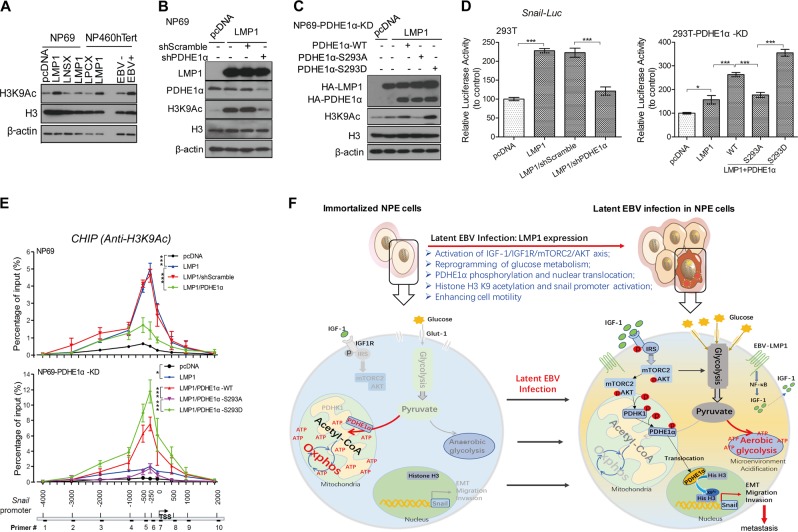
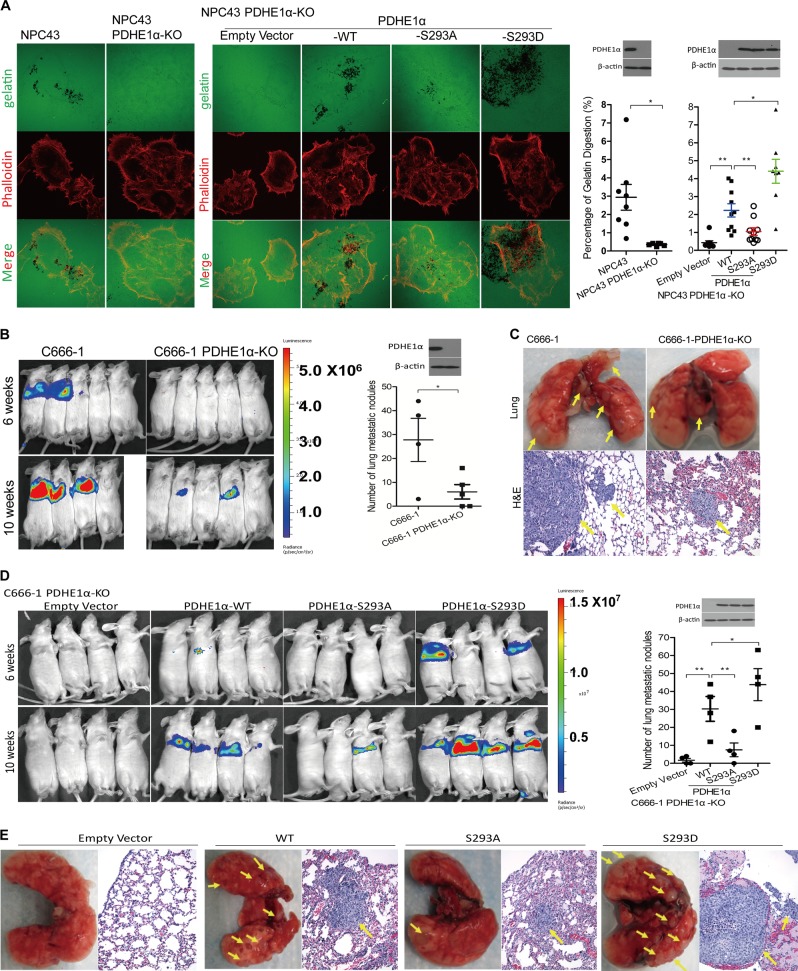
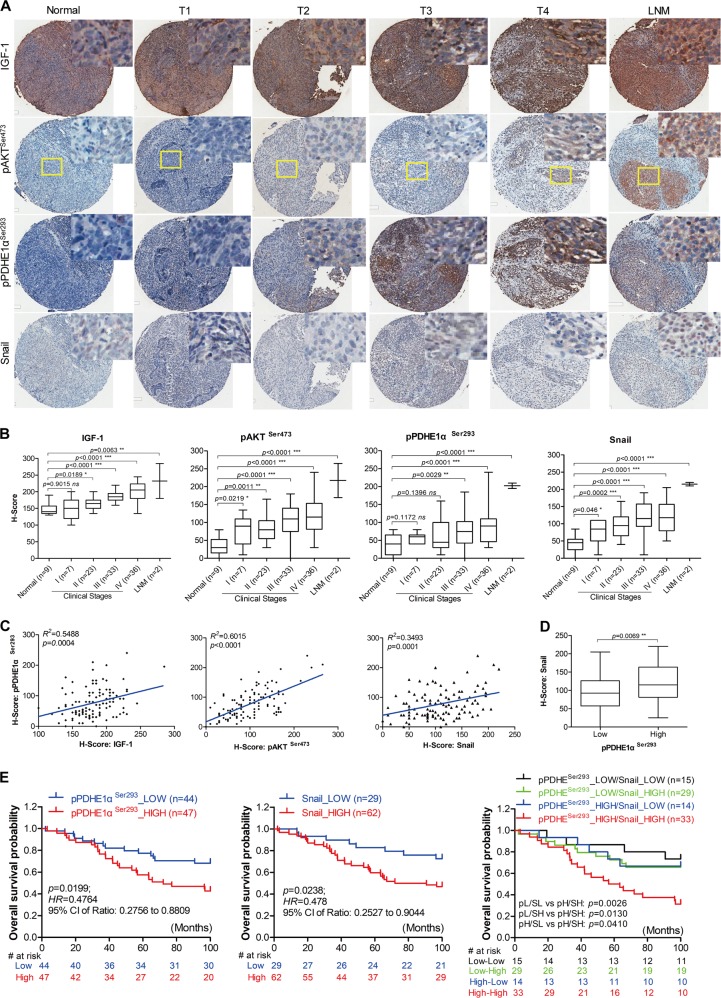
EBV infection of preinvasive nasopharyngeal epithelium is believed to be an initiation step during pathogenesis of nasopharyngeal carcinoma (NPC), but the mechanisms remain poorly understood. Here we report a novel mechanism driving NPC metastasis through the EBV-encoded LMP1-mediated metabolic reprogramming, via activation of IGF1-mTORC2 signaling and nuclear acetylation of the Snail promoter by the PDHE1α, an enzyme involved in glucose metabolism. Mechanistically, EBV-LMP1 increases the cellular secretion of IGF1 which promotes phosphorylation of IGF1R to activate mTORC2/AKT signaling linking glucose metabolism to cell motility. LMP1 expression facilitates translocation of mitochondrial PDHE1α into the nucleus in a phosphorylation-dependent manner at Ser293 residue. Functionally, nuclear PDHE1α promotes H3K9 acetylation on the Snail promoter to enhance cell motility, thereby driving cancer metastasis. Importantly, the IGF1/mTORC2/PDHE1α/Snail axis correlates significantly with disease progression and poor prognosis in NPC patients. This study highlights the functional importance of IGF1-mTORC2-PDHE1α signaling mediated by EBV-LMP1 in NPC pathogenesis.


Conflict of interest statement

The authors declare that they have no conflict of interest.

Figures

Fig. 1
Fig. 1
EBV infection induces glycolytic addiction in nasopharyngeal epithelial (NPE) cells. a Venn diagram describing the distribution of DEG after EBV infection compared with parental controls in NP361hTert, NP460hTert, and NP550hTert. The numbers in red circle denote the number of overlapping genes, which are either 1.4 times over- (lower panel) or 0.7 times under-expressed (upper panel) in all the three cell lines. The heatmap represents the normalized gene sets of downregulated and upregulated genes. b The GO analysis for the DEG in a according to the biological process, cellular component, and molecular function, respectively. c GSEA showing the gene sets of glycolysis and pyruvate metabolism were upregulated in cells with EBV infection. In each panel, the top portions of the plots show the running enrichment score (ES) for the gene set. Each vertical bar in the middle portions represents a gene, and genes enriched in either condition are at the right (EBV-positive) or left (EBV-negative) parts of the graph. The normalized enrichment score (NES), the p value, and the false discovery rate (q-value) are indicated in the insert. d Heatmap showing renormalizing genes of the key enzymes involved in glycolysis and pyruvate metabolic process. e, f The EBV-infected NPE cells and the control cells, g, h EBV-positive NPE cells infected with shScr. and shLMP1, and i, j NP69 and NP460 cells with stable expression of LMP1 were analyzed by western blotting for detecting the expression of metabolism-associated enzymes using specific antibodies (e, g, i). β-actin expression was used as the loading control. f, h, j ECAR and OCR were measured in indicated cell lines simultaneously by using the 96-well plate reading system (Victor, PerkinElmer) in real time. Cells were plated at 10,000 cells/well for 24 h, then the cells were incubated with the ECAR or OCR reagents according to the manual
Fig. 2
Fig. 2
Glycolysis is involved in LMP1-enhanced cell motility in NPE cells. a NP69-LNSX and -LMP1 cells were stimulated with different doses of 2-DG or STF-31 for 48 h. The cells were then lysed, and the lysates were analyzed by western blotting for detecting the expression of cell motility-associated molecules using specific antibodies. β-actin expression was used as the loading control. b Cells were treated with the indicated small molecules, then cell migration and invasion were assayed using uncoated Millipore Transwell chambers or coated ones with Matrigel respectively. Cells that could transmigrate through the membrane were stained and representative images are shown. The number of cells in five random microscopic fields was counted for each group. c Cells were treated with the indicated small molecules and then the confluent monolayer cells were scraped. The migration into the wounded area was assessed 24 and 48 h after scraping and the wound closure was statistically analyzed. d NP69 cells with stable expression of LMP1 or control vector were seeded on the coverglass chamber. After attachment, the cells were treated with 2-DG (5 mM) and STF-31 (5 μM), then cells were observed under time-lapse microscope. Representative tracks of cell movement were traced and visualized using metaphase software every 10 min for 24 h. The accumulated distance was analyzed by metaphase software. e Schematic diagram to show the isolation of two populations of cells with different degree of invasive ability, two independent experiments were indicated as panel a and panel b. f Two populations of cells isolated in e were lysed for western blotting analysis using the indicated antibodies. β-actin expression was used as the loading control. g The glucose consumption and lactate production of the two populations of cells with different invasive potentials were determined. Data are means ± SD (means ± SEM for d). *p < 0.05; **p < 0.01; ***p < 0.005
Fig. 3
Fig. 3
LMP1 activation of mTORC2 by autocrine secretion of IGF1 links Epstein-Barr virus (EBV)-reprogrammed glucose metabolism to cell motility. a GSEA showing the EBV infection upregulate PI3K-AKT-mTOR signaling-dependent gene sets. In each panel, the top portions of the plots show the ES for the gene set. Each vertical bar in the middle portions represents a gene, and genes enriched in either condition are at the right (EBV-positive) or left (EBV-negative) parts of the graph. The NES, the p value, and the false discovery rate (q-value) are indicated in the insert. b Different NPE cell lines with or without EBV infection, and c NP460-EBV cell infected with shRictor or control empty lentiviral vector were subjected to western blotting for detecting the expression of mTORC2 activity and metabolism-associated molecules using specific antibodies. β-actin expression was used as the loading control. d NP460-LPCX and NP460-LMP1 cells infected with shRictor or control empty lentiviral vector were plated at 10,000 cells/well for 24 h, then the cells were incubated with the ECAR or OCR reagents according to the manual. ECAR and OCR were measured simultaneously by using the 96-well plate reading system (Victor, PerkinElmer) in real time. e, f NPE cells with stable or transient overexpression of LMP1 were infected with shRictor or control vector. Then, cells were lysed and analyzed by western blotting. g shRictor- or its control vector-infected NP460-LPCX and LMP1 cells were seeded on the coverglass chamber and observed under time-lapse microscope. Representative tracks of cell movements were traced and visualized using metaphase software every 10 min for 24 h. The accumulated distance was analyzed by metaphase software. h Cell viability of NP69 was measured by MTT assay after incubating with different conditional medium for the indicated times. i The NP69 cells were incubated with the different conditional medium for 48 h, followed by western blotting for detection of mTORC2 signaling activity using the indicated antibodies. j After culturing different pairs of NPE and NPC cells for 48 h, the culture media as well as the cell lysates were subjected to western blot assay using the indicated antibodies. k NP69-pLNSX and LMP1 cells were treated with different doses of AG-1024 and antibodies against-IgG or IGF1 for indicated time, followed by western blot assay using the indicated antibodies. Data are means ± SD (means ± SEM for g). ***p < 0.005
Fig. 4
Fig. 4
Nuclear translocation of PDHE1α is involved in mediating LMP1-enhanced EMT and motility in NPE cells. a NP69 cells with overexpression of LMP1 were infected with shPDHE1α or control vector for 48 h, cells were lysed, and subjected to western blotting for detecting the expression of cell motility-associated proteins. b Cells were co-stained with MitoTracker Red (mitochondrial marker), PDHE1α (green), and Hoechst33258, and representative images were taken using a Zeiss LSM800 system. The nuclear signaling intensity was analyzed and is shown in histogram. c Subcellular fractionations of NP69 and NP69-LMP1 were isolated for demonstrating the localization of indicated proteins in various subcellular compartments. GAPDH, COX IV, and Histone H3 were used as cytosol, mitochondrial, and nucleus markers respectively. d NP69-PDHE1α-KD cells were first stably reconstituted with either wild-type (WT) or mutant PDHE1α, and then transfected with pcDNA or pcDNA-LMP1, followed by co-staining with MitoTracker Red (mitochondrial marker), PDHE1α (green), and Hoechst33258. Representative images were taken using a Zeiss LSM800 system. e Indicated cells were also analyzed by western blotting for detecting the expression of cell motility-associated markers. f Cells were seeded on the coverglass chamber and observed under time-lapse microscope. Representative tracks of cell movements that were traced and visualized using metaphase software every 10 min for 24 h. The accumulated distance was analyzed by metaphase software. g Cell migration and invasion were assayed using uncoated Millipore Transwell chambers and coated ones with Matrigel respectively. Representative images of cells at the bottom surface are shown. The number of cells in five random fields were counted for each group. Data are means ± SD (means ± SEM for b, d, f). *p < 0.05; **p < 0.01; ***p < 0.005
Fig. 5
Fig. 5
Nuclear PDHE1α promotes histone acetylation at Snail promoter to mediate LMP1-enhanced cell motility. a NP69 and NP460 cells with overexpression of LMP1 or stable infection of EBV were subjected to western blotting for analyzing the level of histone acetylation using the indicated antibodies. b NP69 cells were transfected with pcDNA or LMP1 constructs and then infected with shPDHE1α for 48 h, cells were lysed and subjected to western blotting for analysis using the indicated antibodies. c NP69 cells with stable knockdown of PDHE1α (NP69-PDHE1α-KD) were co-transfected with pcDNA or LMP1 as well as different PDHE1α constructs, after 48 h cells were lysed and subjected to western blotting for analysis using the indicated antibodies. β-actin expression was used as the loading control. d The lysates of the following cell lines were subjected to luciferase reporter assay. Left panel: 293T-pcDNA or 293T-LMP1 cells were transfected with shScramble and shPDHE1α; right panel: 293T cells with stably knockdown of PDHE1α (293T-PDHE1α-KD) were first transfected with either pcDNA or LMP1 and then infected with lentivirus with wild-type (WT) or mutant PDHE1α. e NP69 and NP69-PDHE1α-KD cells were transfected with pcDNA and LMP1, or/and other knockdown or expression plasmids in various settings as indicated. The cell lysates were subjected to chromatin immunoprecipitation (ChIP) assay using an anti-H3K9Ac antibody. PCR was performed to amplify the different regions indicated in the lower panel. f Schematic diagram of LMP1-induced IGF1/mTORC2/PDHE1α/H3K9Ac axis links glucose metabolism to cell motility and drives NPC pathogenesis. In immortalized nasopharyngeal epithelial cell, cells metabolize glucose through oxidative phosphorylation to produce ATP. After latent EBV infection, the EBV-LMP1 expression reprograms glucose metabolism from oxidative phosphorylation to aerobic glycolysis, which is an essential process for promoting cell motility. Data are means ± SD. *p < 0.05; ***p < 0.005
Fig. 6
Fig. 6
Nuclear translocation of PDHE1α promotes cancer metastasis in nasopharyngeal carcinoma (NPC). a NPC43 cells harbored with different PDHE1α mutants were subjected to invadopodia assay by plating on Fluor488-conjuated gelatin. After 24 h, cells were then fixed and stained with Fluo555-Phalloidin. Representative images were captured using a Zeiss LSM800 system. The digestion area of gelatin was quantified by ImageJ software. b, d C666-1 cells overexpressed with different PDHE1α mutants were cultured and injected into the tail vein of mouse. The luciferase signaling in the lungs indictative for lung metastases was monitored at 6 and 10 weeks after injection, using a PE IVIS Spectrum in vivo imaging system. c, e The lungs were fixed and stained by hematoxylin and eosin 10 weeks after injection. The lung metastatic tumor nodules per mouse were counted. Data are means ± SEM. *p < 0.05; **p < 0.01
Fig. 7
Fig. 7
Pathological significance of IGF1/mTORC2/PDHE1α/Snail in NPC patients. a Representative immunohistochemical images show IGF1, mTORC2 (pAKT-Ser473), pPDHE1α-Ser293 as well as Snail staining in normal and different clinical stages of NPC tissues. b Box whisker analyses showing the correlation of IGF1, mTORC2 (pAKT-Ser473), pPDHE1α-Ser293, and Snail expression with the different clinical stages of NPC samples. The median values of each group are shown by horizontal lines. c Dot plot showing the correlation of pPDHE1α-Ser293 expression with the IGF1, mTORC2 (pAKT-Ser473), and Snail expression in different NPC samples. The correlation coefficient r2 and p value were obtained from the linear regression analysis. d Box whisker analyses showing the immunoactivity scores of Snail staining in NPC tumors with low and high pPDHE1α-Ser293 expression. The median values of each group are shown by horizontal lines. e Kaplan-Meier analysis exhibiting the expression of pPDHE1α-Ser293 and Snail and their correlation with the overall survival of 99 cases of NPC patients. Hazard ratio and 95% confidence interval values are shown in the figures. p-values were obtained from the log-rank test in each case. Data are means ± SEM. *p < 0.05; **p < 0.01; ***p < 0.005

Similar articles

Cited by

References

    1. Levy P, Bartosch B. Metabolic reprogramming: a hallmark of viral oncogenesis. Oncogene. 2016;35:4155–64. doi: 10.1038/onc.2015.479. - DOI - PubMed
    1. Epstein MA, Achong BG, Barr YM. Virus particles in cultured lymphoblasts from Burkitt’s lymphoma. Lancet. 1964;1:702–3. doi: 10.1016/S0140-6736(64)91524-7. - DOI - PubMed
    1. Tsao SW, Tsang CM, Lo KW. Epstein-Barr virus infection and nasopharyngeal carcinoma. Philos Trans R Soc Lond B Biol Sci. 2017;372:20160270. doi: 10.1098/rstb.2016.0270. - DOI - PMC - PubMed
    1. Tsao SW, Tsang CM, To KF, Lo KW. The role of Epstein-Barr virus in epithelial malignancies. J Pathol. 2015;235:323–33. doi: 10.1002/path.4448. - DOI - PMC - PubMed
    1. Niedobitek G, Herbst H, Young LS, Rowe M, Dienemann D, Germer C, et al. Epstein-Barr virus and carcinomas. Expression of the viral genome in an undifferentiated gastric carcinoma. Diagn Mol Pathol. 1992;1:103–8. doi: 10.1097/00019606-199206000-00003. - DOI - PubMed

Publication types

MeSH terms

Substances