. 2019 May 1;85(9):769-781.
doi: 10.1016/j.biopsych.2018.12.008. Epub 2018 Dec 19.

MicroRNA-26a/Death-Associated Protein Kinase 1 Signaling Induces Synucleinopathy and Dopaminergic Neuron Degeneration in Parkinson's Disease

Affiliations

MicroRNA-26a/Death-Associated Protein Kinase 1 Signaling Induces Synucleinopathy and Dopaminergic Neuron Degeneration in Parkinson's Disease

Ying Su et al. Biol Psychiatry. .

Abstract

Background: Death-associated protein kinase 1 (DAPK1) is a widely distributed serine/threonine kinase that is critical for cell death in multiple neurological disorders, including Alzheimer's disease and stroke. However, little is known about the role of DAPK1 in the pathogenesis of Parkinson's disease (PD), the second most common neurodegenerative disorder.

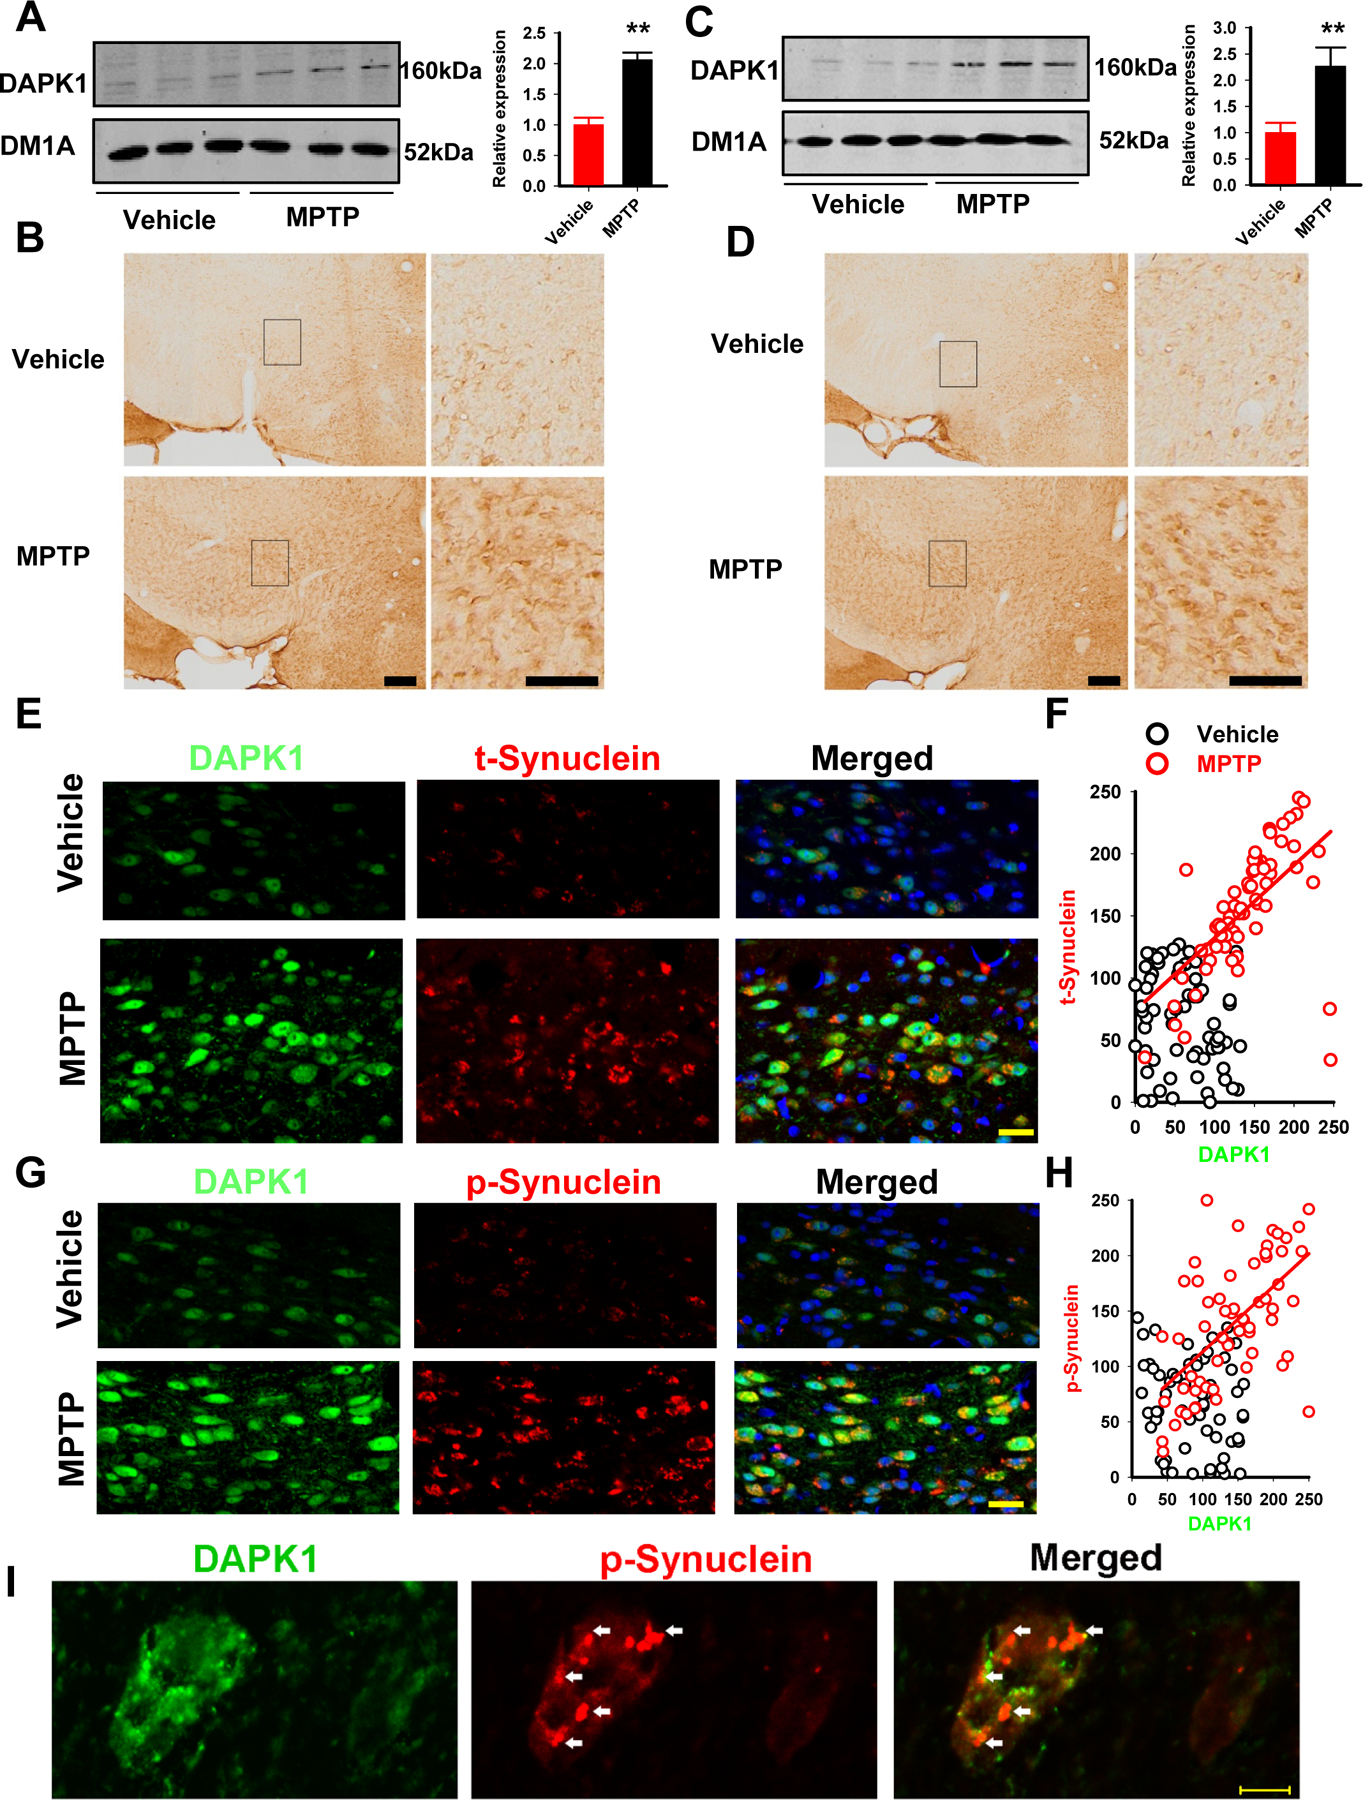
Methods: We used Western blot and immunohistochemistry to evaluate the alteration of DAPK1. Quantitative polymerase chain reaction and fluorescence in situ hybridization were used to analyze the expression of microRNAs in PD mice and patients with PD. Rotarod, open field, and pole tests were used to evaluate the locomotor ability. Immunofluorescence, Western blot, and filter traps were used to evaluate synucleinopathy in PD mice.

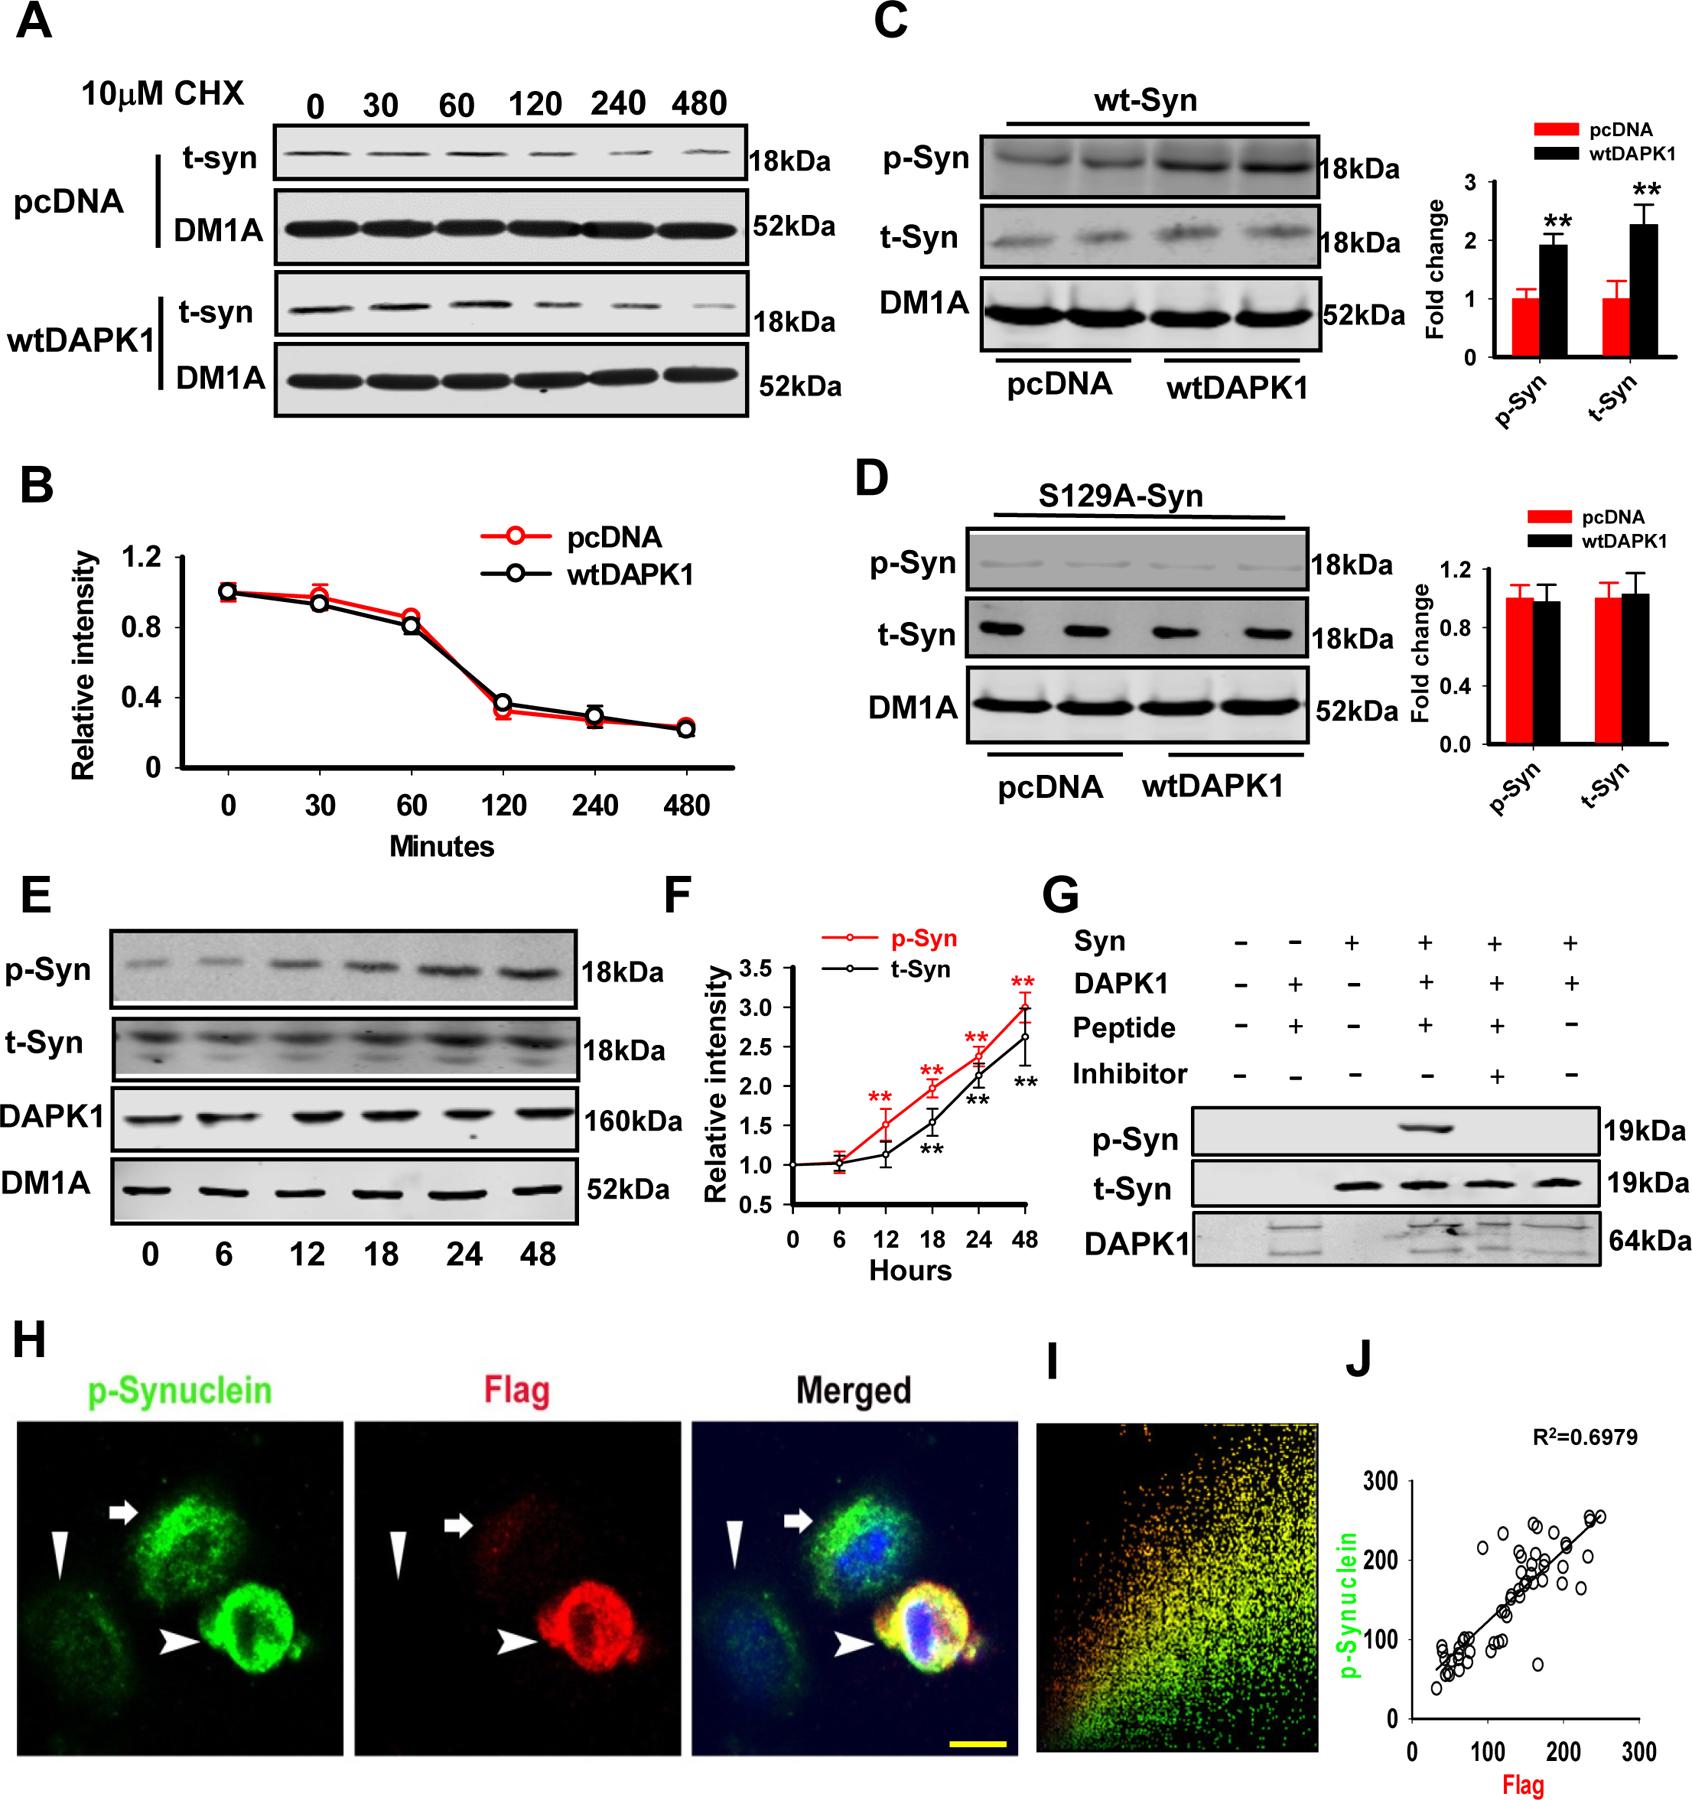
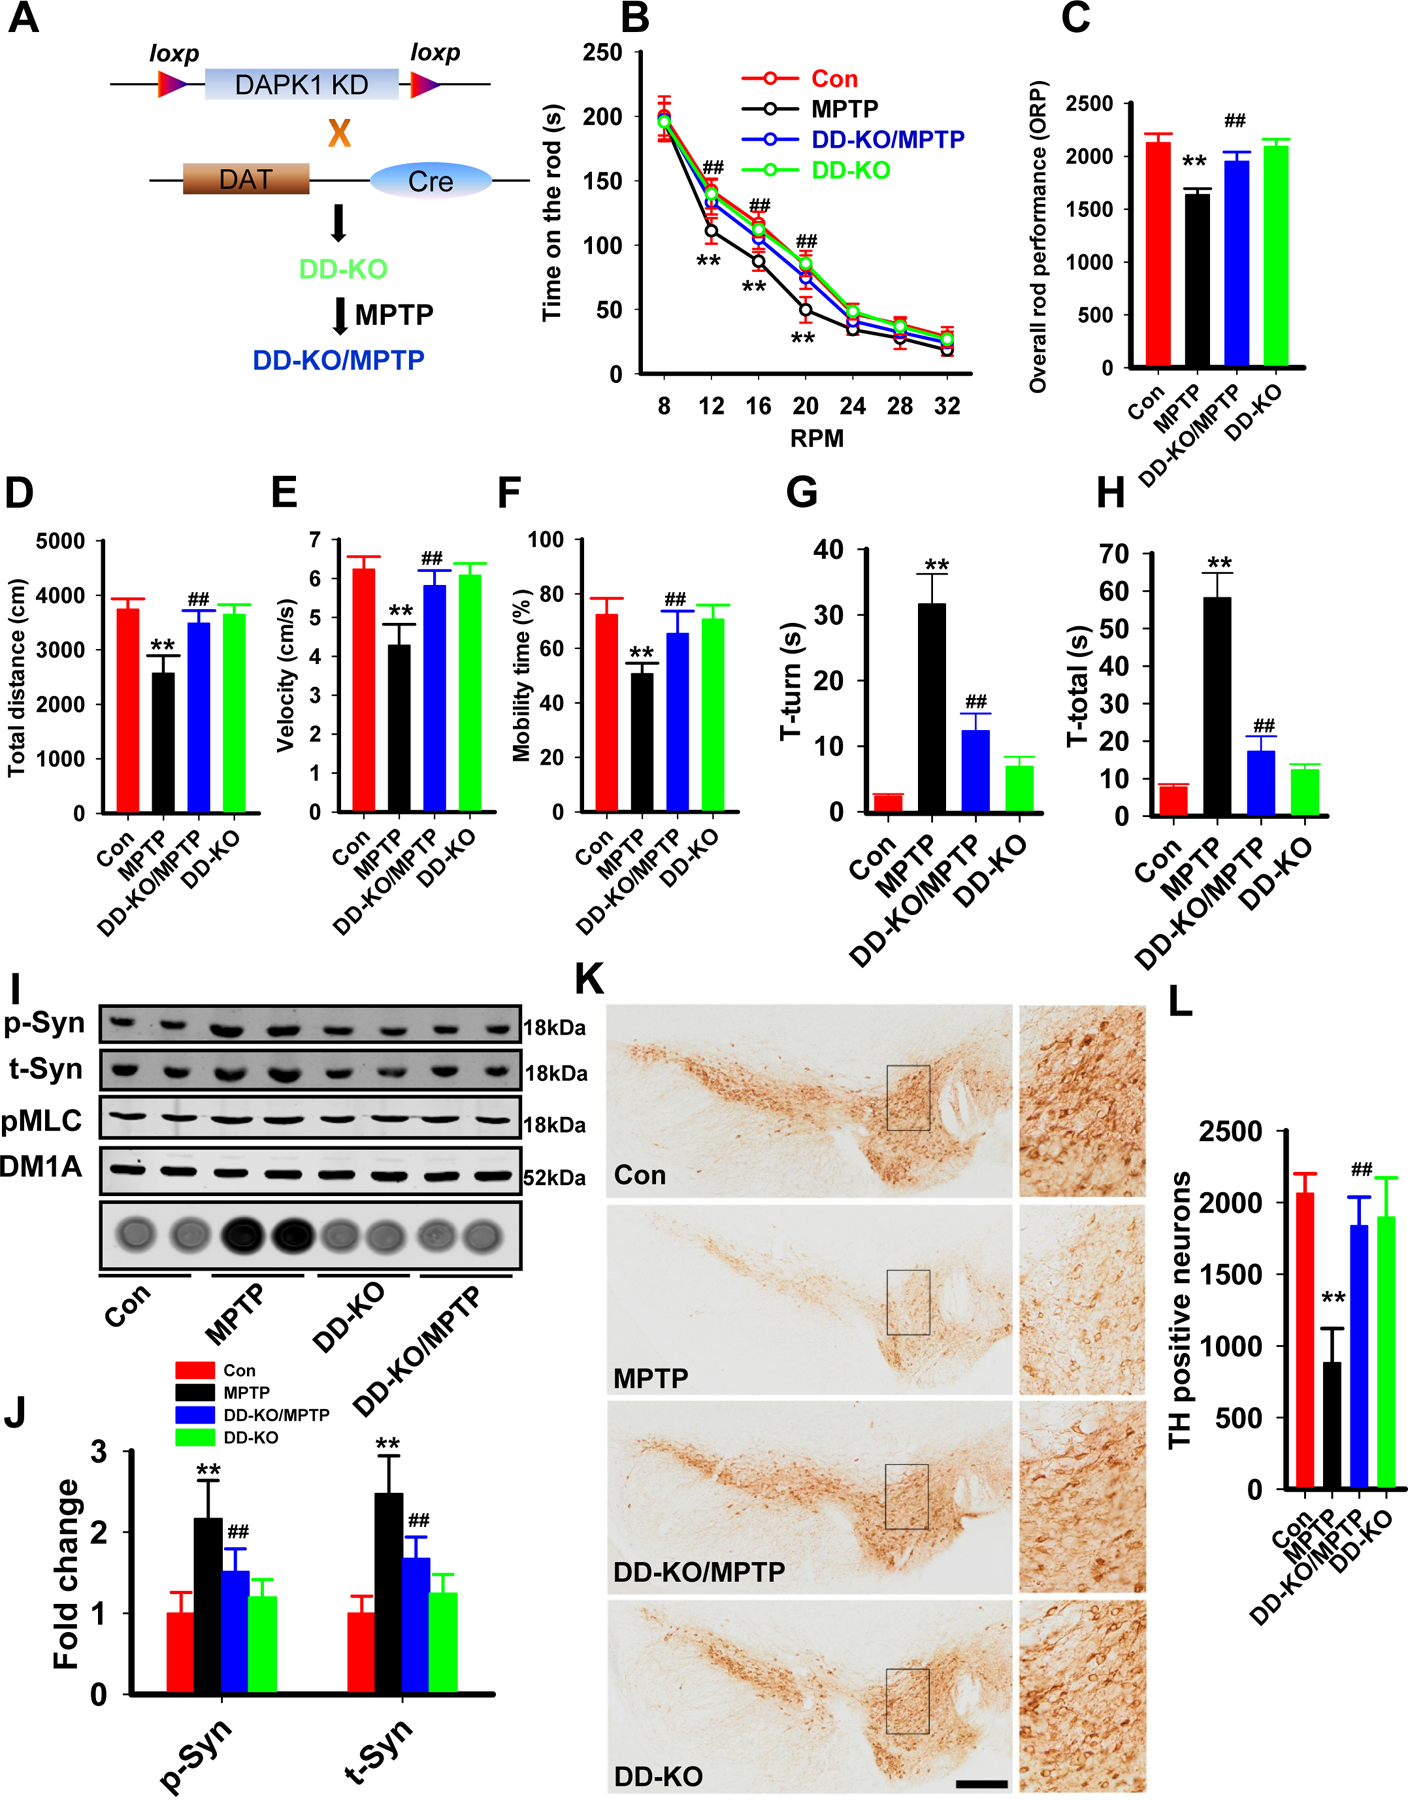
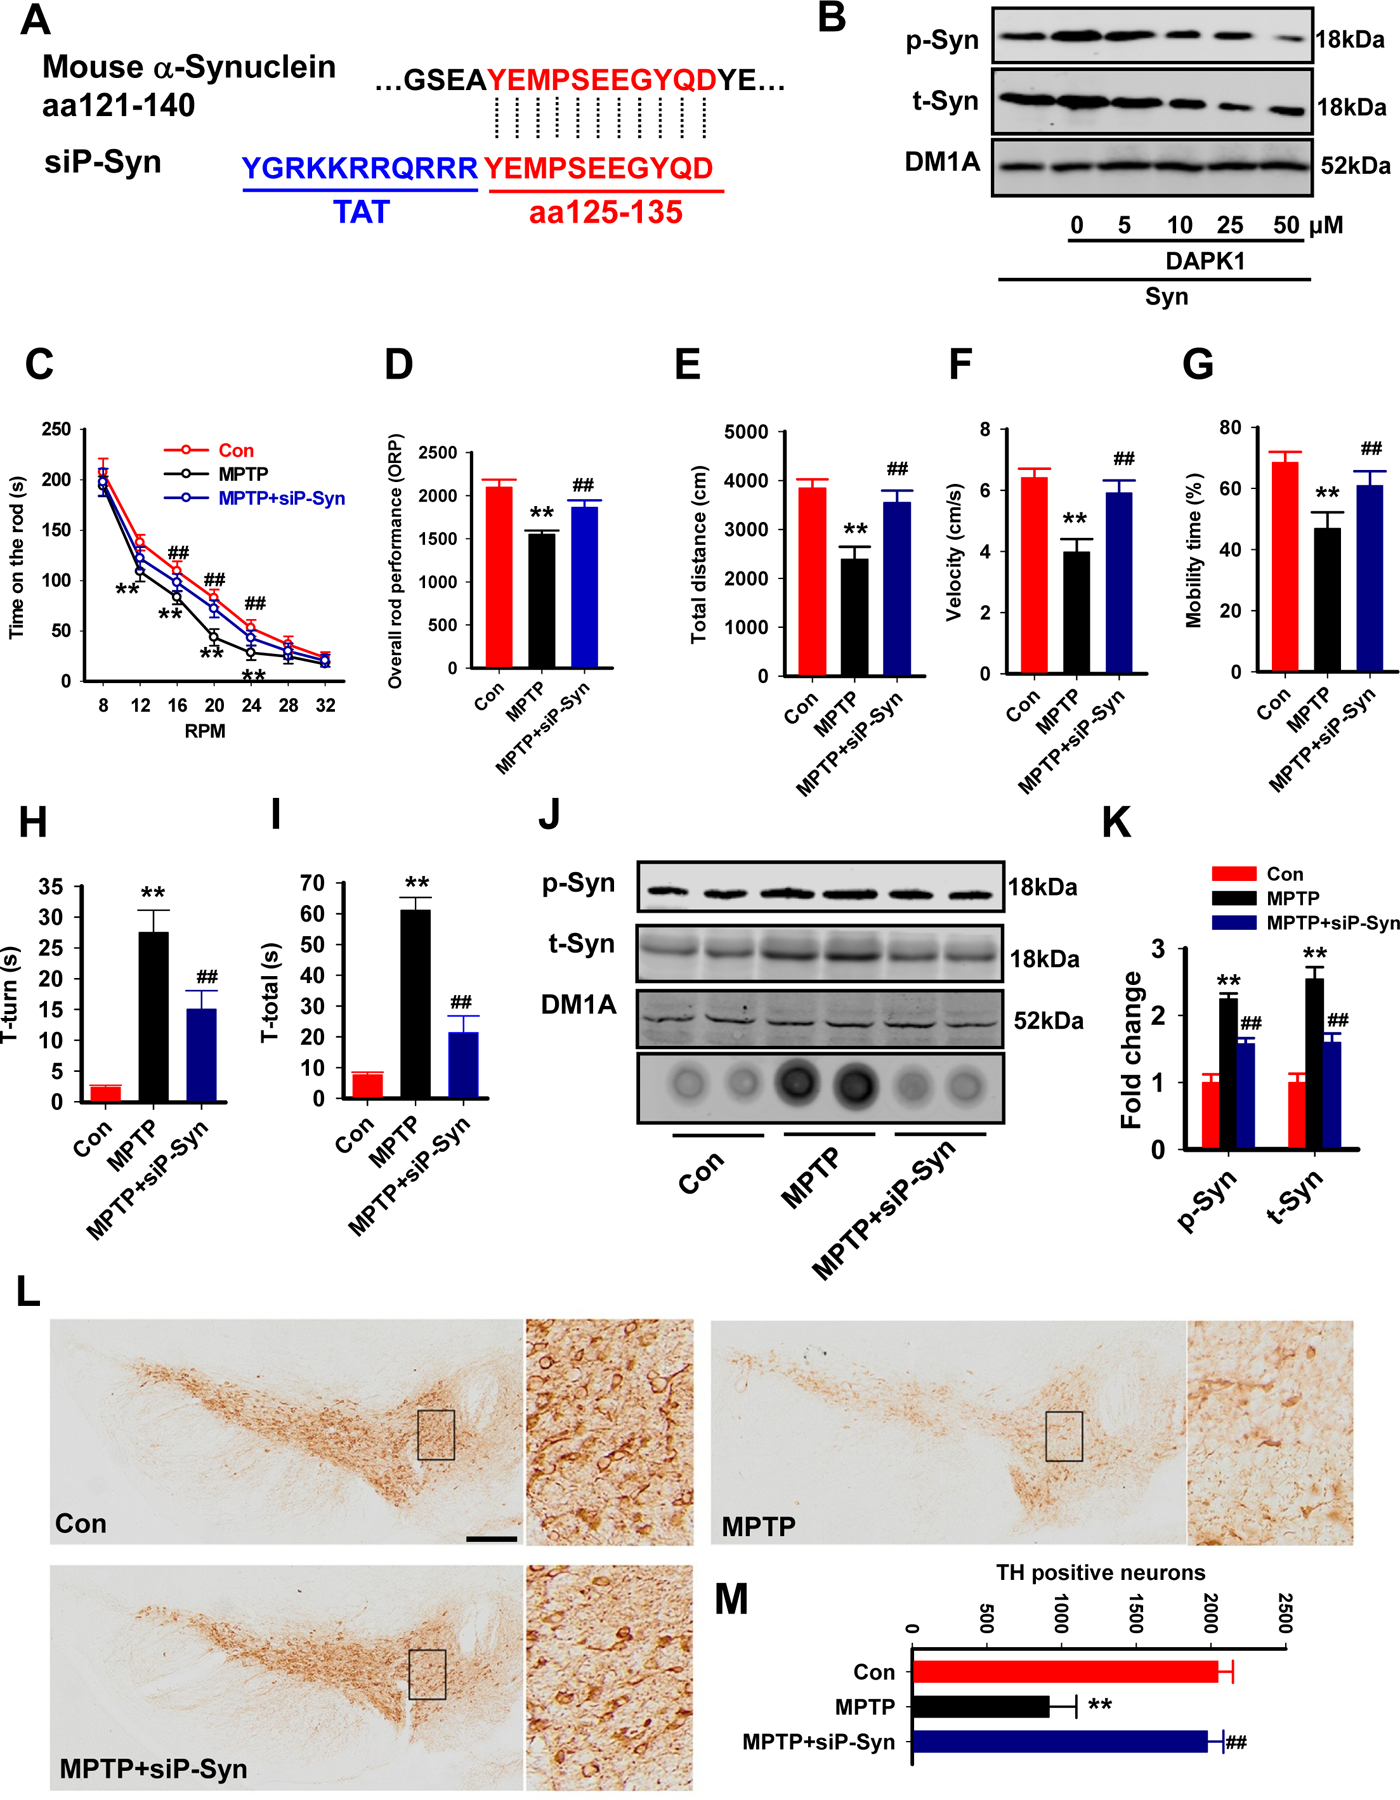
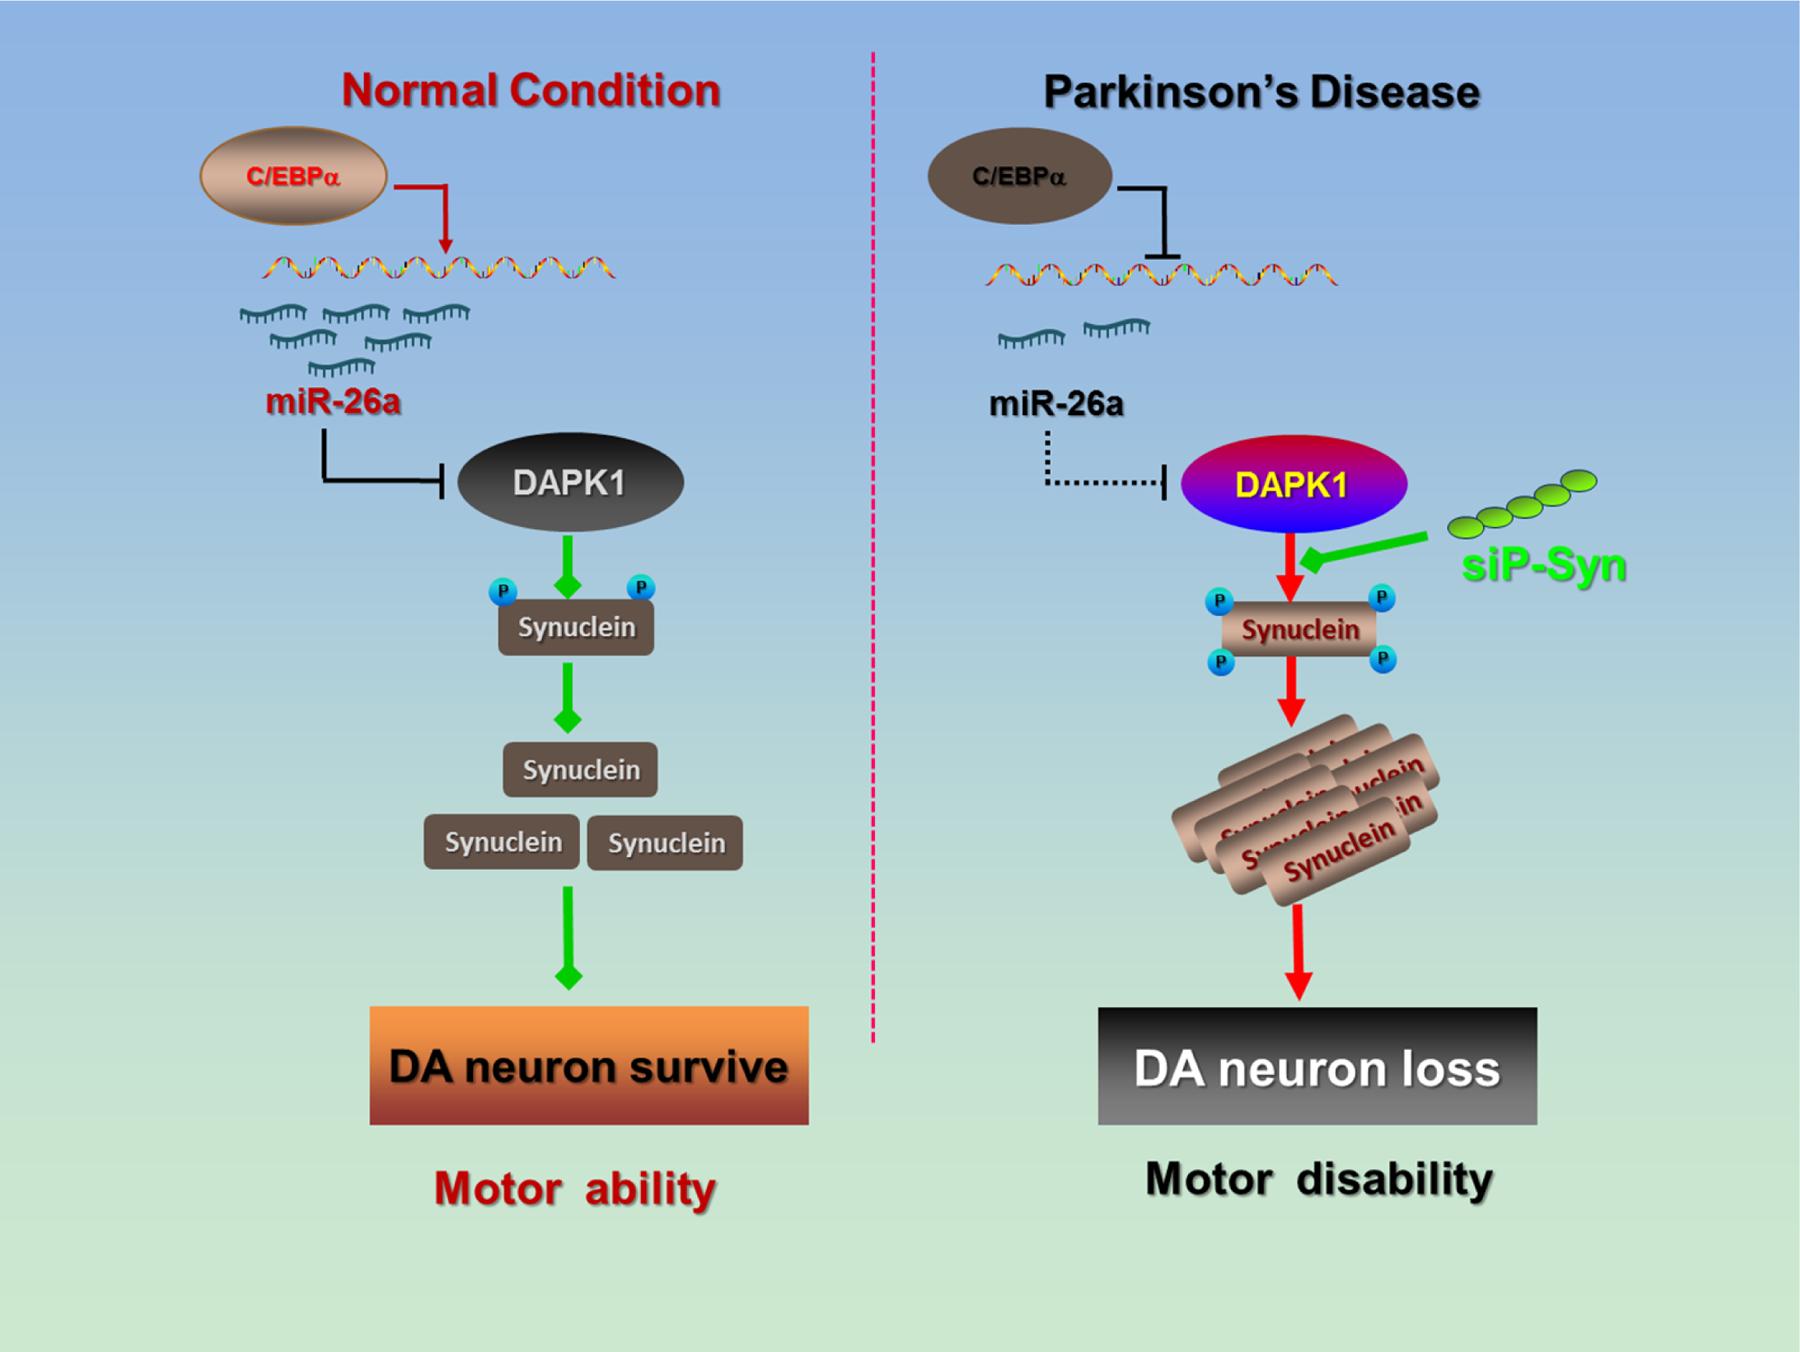
Results: We found that DAPK1 is posttranscriptionally upregulated by a reduction in microRNA-26a (miR-26a) caused by a loss of the transcription factor CCAAT enhancer-binding protein alpha. The overexpression of DAPK1 in PD mice is positively correlated with neuronal synucleinopathy. Suppressing miR-26a or upregulating DAPK1 results in synucleinopathy, dopaminergic neuron cell death, and motor disabilities in wild-type mice. In contrast, genetic deletion of DAPK1 in dopaminergic neurons by crossing DAT-Cre mice with DAPK1 floxed mice effectively rescues the abnormalities in mice with chronic MPTP treatment. We further showed that DAPK1 overexpression promotes PD-like phenotypes by direct phosphorylation of α-synuclein at the serine 129 site. Correspondingly, a cell-permeable competing peptide that blocks the phosphorylation of α-synuclein prevents motor disorders, synucleinopathy, and dopaminergic neuron loss in the MPTP mice.

Conclusions: miR-26a/DAPK1 signaling cascades are essential in the formation of the molecular and cellular pathologies in PD.

Keywords: DAPK1; MPTP; Parkinson’s disease; Peptide; miRNA; α-Synuclein.


Conflict of interest statement

Conflict of Interest

The peptide used to block synuclein phosphorylation submitted to the Patent Office of the People’s Republic of China by Dr. Ling-Qiang Zhu, Dr. Man-Fei Deng, Dr. Dan Liu, Dr. Ao-Ji Xie and Dr.Ya-Fan Zhou (Application No. 2018100396990). All other authors report no biomedical financial interests or potential conflicts of interest.

Figures

Figure 1.
Figure 1.. DAPK1 is increased in the MPTP mice and is positively correlated with synucleinopathy
(A-B) Lysates from the SN of acute (A) and chronic (B) MPTP mice were examined by western blot with anti-DAPK1 and anti-DM1A antibodies. Representative images were shown. The quantitative analysis was performed with Student’s t-test. **P<0.01 vs vehicle-injected mice; N=3 independent experiments by using 6 mice per group. (C-D) Immunohistochemical staining with anti-DAPK1 was performed in coronal slices from the acute (C) and chronic (D) MPTP-injected mice. The black rectangle regions in the left panels were shown in higher magnification at the right panels. Bar=50 µm; Student’s t-test; N=3 independent experiments by using 6 mice per group. (E-F) Double immunofluorescence was performed in coronal slices from the chronic MPTP-injected mice by using the DAPK1 (green) and total α-synuclein (red) antibodies (E), and the correlation analysis (F) was performed via SigmaPlot after the fluorescent intensity measurements were acquired via ImageJ. Bar=50 µm; red and black circles are the fluorescent intensities from the MPTP- and vehicle-treated mice; R2=0.3401; P<0.001. (G-H) Double immunofluorescence staining was performed in coronal slices from the chronic MPTP-injected mice using DAPK1 (green) and p-syn (red) antibodies (G), and the correlation analysis (H) was performed via SigmaPlot after the fluorescent intensity measurements were acquired via ImageJ. Bar=50 µm, red and black circles are the fluorescent intensities from MPTP- and vehicle-treated mice; R2=0.3728; P<0.001. (I) Neurons with high magnification showing α-synuclein (red) inclusions (white arrow) and strong DAPK1 staining (green). The cell on the left side displays more intense DAPK1 staining. Bar=10 µm.
Figure 2.
Figure 2.. Abnormal downregulation of miR-26 is responsible for DAPK1 elevation in PD
(A) DAPK1 mRNA expression showed no change in the MPTP models. (B) Alterations in predicted miRNAs that target DAPK1 in the SN of chronic MPTP-injected mice models. **P<0.01 vs vehicle; Student’s t-test; N=8 from 3 independent experiments. (C) Alterations in miR-26a, miR-26b and miR-141 in the CSF of PD patients and aged-matched healthy subjects. **P<0.01 vs vehicle; Student’s t-test. (D) The binding sites of miR-26a with DAPK1 3’UTR are conserved in mammalians. Mmu, mouse; Rno, rat; Rmk, Rhesus monkey; Hsa, human; Pig, pig. (E) The wt and mut 3’UTR of DAPK1 were sub-cloned into the psi-CHECK vector and transfected into HEK293 cells, together with miR-26a mimics or its scrambled control. The luciferase intensity was measured. Unpaired Student’s t-test was used; **P<0.01 compared to the scrambled control-treated group; N=6 for each group. (F-H) The N2a cells were treated with miR-26a mimics and its scrambled control or with the A-miR-26a and its scrambled control for 24 h. The cell lysates were collected for the detection of DAPK1 protein and mRNA expression. Representative blots (F), quantitative analysis (G), and the relative expression level of DAPK1 mRNA (H) are shown. **P<0.01 compared to the respective Con; N=6; Student’s t-test. (I) Analysis of the correlation between the miR-26 level and DAPK1 protein levels in the brain tissue of chronic MPTP-injected mice. (J) A representative image of localization of miR-26 and DAPK1 in the dopaminergic neurons. Bar=20µm.
Figure 3.
Figure 3.. Overexpression of DAPK1 or inhibition of miR-26a induces synucleinopathy
(A) Diagram of the virus injection site (upper panel) and a representative fluorescence image (lower panel). (B-C) Effects of DAPK1 overexpression (B) and miR-26a inhibition (C) on the phosphorylation level and expression of α-synuclein in wt mice. The upper panels are representative blots, and the lower panels are the quantified data. Vector: AAV-EGFP virus; DAPK1: AAV-DAPK1-IRES-EGFP virus; Scramble: the scrambled control for miR-26a antagomer; A-miR-26a: miR-26a antagomer. **P<0.01 vs vector (B) or scramble (C); Student’s t-test; N=8 from 3 independent experiments. (D-E) Effects of DAPK1 overexpression (D) and miR-26a inhibition (E) on the solubility of α-synuclein. The left panels are representative blots, and the right panels are the quantified data (left side of the blue dash for the 70% FA, right side for RIPA). **P<0.01 vs vector (D) or scramble (E); Student’s t-test; N=8 from 3 independent experiments. (F-G) The filter trap experiments were used to detect α-synuclein oligomer formation with DAPK1 overexpression (F) or miR-26a inhibition (G).
Figure 4.
Figure 4.. Overexpression of DAPK1 or inhibition of miR-26a induces DA neuron death and locomotor disabilities
(A-B) Immunohistochemistry of TH staining in the SN of mice treated with A-miR-26a or the Con (scrambled control). (A) Representative image and (B) the quantification of TH-positive neurons. Bar=100 µm; **P<0.01 vs Con. (C-D) Immunohistochemistry of TH staining in the SN of mice treated with AAV-DAPK1 or the vector control. Vector: AAV-EGFP virus; DAPK1: AAV-DAPK1-IRES-EGFP virus. (C) A representative image and (D) the quantification of TH-positive neurons. Bar=100 µm; ** P<0.01 vs vector; Student’s t-test. (E-F) Mice were injected with A-miR-26a or the Con, and the rotarod test was performed. (E) Time spent on the rod by mice in each group at different rotation speeds. (F) ORP scores in two groups. **P<0.01 vs Con; N=10; one-way ANOVA with Bonferroni post hoc test was used. (G-H) Mice were injected with AAV-DAPK1 or the control virus (vector), and the rotarod test was performed. (G) Time spent on the rod by mice in each group at different rotation speeds. (H) ORP scores in two groups. ** P<0.01 vs Con; N=10–11; one-way ANOVA with Bonferroni post hoc test was used. (I-K) The total distance traveled (I), mean velocity (J) and percentage of time spent mobile (K) in the open field test of mice treated with A-miR-26a or a control. ** P<0.01 vs Con; N=10; Student’s t-test. (L-N) The total distance traveled (L), mean velocity (M) and percentage of time spent mobile (N) in the open field test of mice treated with AAV-DAPK1 or the control virus (vector). **P<0.01 vs vector; N=10–11; Student’s t-test.
Figure 5.
Figure 5.. DAPK1 directly promotes the phosphorylation of α-synuclein at Ser129
(A-B) A representative western blot image (A) of total α-synuclein protein levels during the CHX chase experiment. HEK293 cells were transfected with the wt α-synuclein plasmids with either wtDAPK1 or pcDNA. Twenty-four hours after transfection, cells were treated with CHX for the indicated time periods. Quantification of the data is shown (B). N=3 independent experiments; Student’s t-test. (C-D) HEK293 cells were co-transfected with the wt α-synuclein (C) or mut (D), together with either wtDAPK1 or pcDNA. The cell lysates were collected 48 h later for western blotting. ** P<0.01 vs pcDNA; N=4; Student’s t-test. (E-F) The N2a cells were transfected with wild type DAPK1 and the cell lysates were collected at 0, 6, 12, 18, 24, 48 h for examination of pSer129-α-Synuclein (p-Syn) and total α-Synuclein (t-Syn). The representative blots were shown in (E) and the quantitative analysis were shown in (F). ** P<0.01 vs 0h. N=6; Bonferroni post hoc test after Repeated two-way ANOVA. (G) The recombinant α-synulcein (human) and DAPK1 (human) were incubated in 30°C for 30 minutes, and the inhibitor at 69nM was added, which were then subjected to western blot. The pSer129-α-Synuclein (p-Syn), total α-Synuclein (t-Syn) and DAPK1 were detected. (H-J) The N2a cells were transfected with Flag-DAPK1 plasmid and then double-immunostained with anti-p-syn (green) and anti-DAPK1 (red) antibodies. The nuclei were visualized by DAPI staining (H). A colocalization analysis (I) and correlation analysis (J) were performed. Arrowhead, cell with higher DAPK1 level; arrow, cell with moderate DAPK1 expression; triangle, cell without DAPK1 expression; bar=10 µm.
Figure 6.
Figure 6.. Genetic deletion of DAPK1 rescues the PD-like behaviors and pathologies of MPTP mice
(A) A diagram for the generation of DD-KO mice and DD-KO/MPTP mice. (B-H) The wild type mice (con) and the DD-KO mice (DD-KO) received a total of 10 doses of MPTP hydrochloride (25 mg/kg in saline, s.c.) on a 5-week schedule. The mice were then subjected to rotarod test (B-C), open field test (D-F) and pole test. Time spent on the rod (B) and ORP (C) were measured. The total distance traveled (D), mean velocity (E) and mobility time (F) were evaluated in the open field test. The time to orient down (G, T-turn) and total time to descend the pole (H, T-total) were evaluated in the pole test. **P<0.01 vs Con; ##P<0.01 vs MPTP; one-way ANOVA with Bonferroni post hoc test was used. (I-J) The mice were treated as described in (b-h), and the homogenates from the SN were extracted for western blotting (upper four blots) and the filter trap analysis (bottom dot blot). The representative blots (I) and the quantitative analysis for p-syn and t-syn (J) are shown. **P<0.01 vs Con; ##P<0.01 vs MPTP; N=6; one-way ANOVA with Bonferroni post hoc test was used. (K-L) Mice were treated as described in (B-H), and the coronal slices from those mice were prepared for TH staining. Representative images of the SN of different groups (K) and the quantitative analysis (L). **P<0.01 vs Con; ##P<0.01 vs MPTP; N=6; one-way ANOVA with Bonferroni post hoc test was used.
Figure 7.
Figure 7.. siP-Syn attenuates the behavioral and pathological abnormalities in PD mice
(A) A diagram of the siP-Syn design. Blue words, Tat sequence. (B) The siP-Syn peptide blocked the phosphorylation of α-synuclein in vitro. The N2a cells were transfected with α-synuclein and DAPK1, and the siP-Syn peptide was applied at different doses as indicated. At 24 h later, the cell lysates were collected for western blotting. (C-I) The siP-syn peptide and its Con peptide were injected into MPTP mice, and the mice were subjected to the rotarod test, the open field test and the pole test. The time on the rod (C) and ORP (D) were evaluated in the rotarod test. The total distance traveled (E), mean velocity (F) and mobility time (G) were evaluated in the open field test. The time to orient down (H, T-turn) and total time to descend the pole (I, T-total) were evaluated in the pole test. **P<0.01 vs Con; ##P<0.01 vs MPTP; N=9, one-way ANOVA with Bonferroni post hoc test was used. (J-K) The mice were treated as described in (C-I), and the homogenates from the SN were extracted for western blotting (upper three blots) and the filter trap analysis (lower dot blot). The representative blots (J) and the quantitative analysis for p-syn and t-syn (K) are shown. **P<0.01 vs Con; ##P<0.01 vs MPTP; N=6; one-way ANOVA with Bonferroni post hoc test was used. (L-M) The mice were treated as described in (C-I), and the coronal slices from those mice were prepared for TH staining. Representative images of the SN of different groups (L) and the quantitative analysis (M). **P<0.01 vs Con; ##P<0.01; vs MPTP; N=6; one-way ANOVA with Bonferroni post hoc test was used.
Figure 8.
Figure 8.. Schematic illustration of the effects of miR-26a
In the PD brain, the C/EBPα transcription factor is suppressed, and the transcription and expression of miR-26a is decreased. The loss of miR-26a induces post-transcriptional DAPK1 overexpression, resulting in the hyperphosphorylation of α-synuclein and α-synuclein aggregation. The toxic synucleinopathy finally causes DA neuron death and locomotor disabilities in PD.

Similar articles

Cited by

References

    1. Mortality GBD, Causes of Death C (2016): Global, regional, and national life expectancy, all-cause mortality, and cause-specific mortality for 249 causes of death, 1980–2015: a systematic analysis for the Global Burden of Disease Study 2015. Lancet 388:1459–1544. - PMC - PubMed
    1. Xia R, Mao ZH (2012): Progression of motor symptoms in Parkinson’s disease. Neurosci Bull 28:39–48. - PMC - PubMed
    1. Michel PP, Hirsch EC, Hunot S (2016): Understanding Dopaminergic Cell Death Pathways in Parkinson Disease. Neuron 90:675–691. - PubMed
    1. Dexter DT, Jenner P (2013): Parkinson disease: from pathology to molecular disease mechanisms. Free Radic Biol Med 62:132–144. - PubMed
    1. Bialik S, Kimchi A (2006): The death-associated protein kinases: structure, function, and beyond. Annu Rev Biochem 75:189–210. - PubMed

Publication types