. 2019 Feb;25(2):270-276.
doi: 10.1038/s41591-018-0297-y. Epub 2019 Jan 14.

Blood-brain barrier breakdown is an early biomarker of human cognitive dysfunction

Affiliations

Blood-brain barrier breakdown is an early biomarker of human cognitive dysfunction

Daniel A Nation et al. Nat Med. 2019 Feb.

Abstract

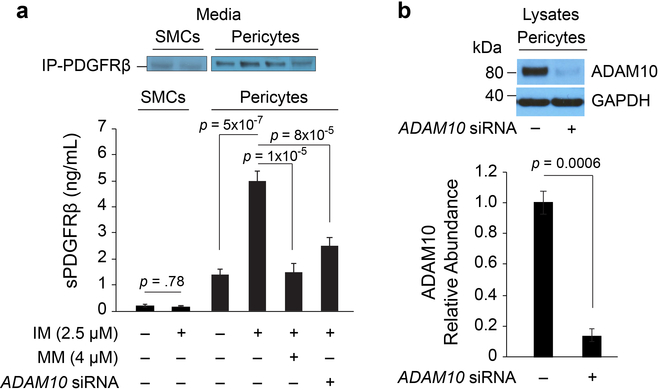
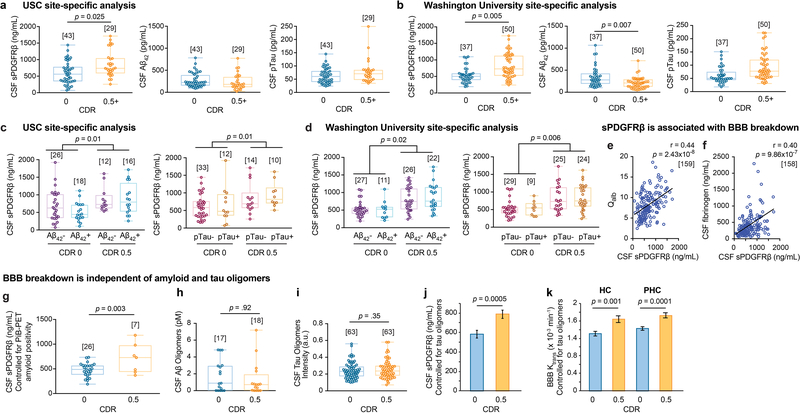
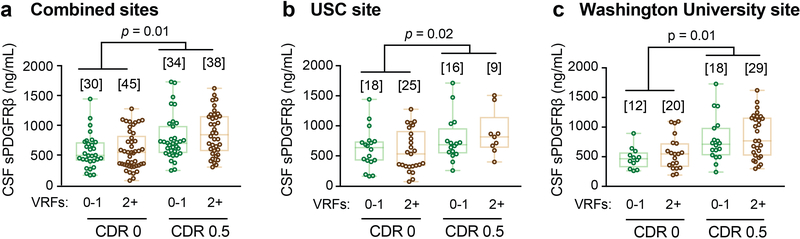
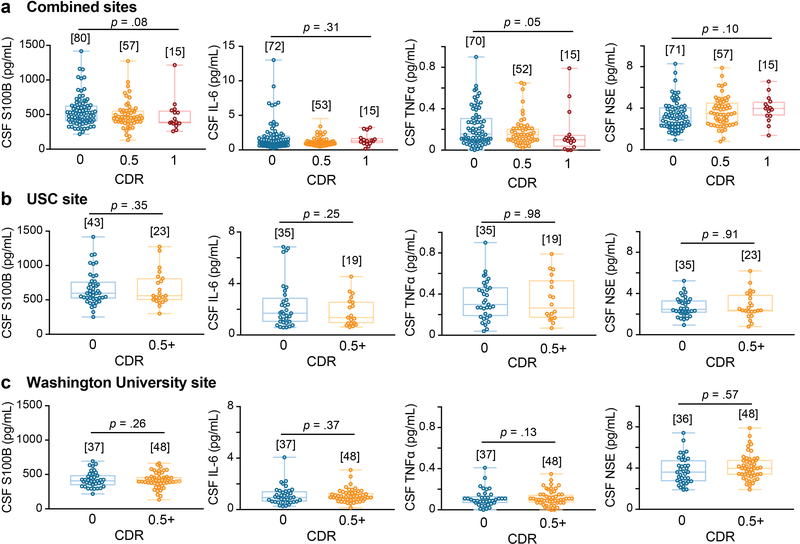
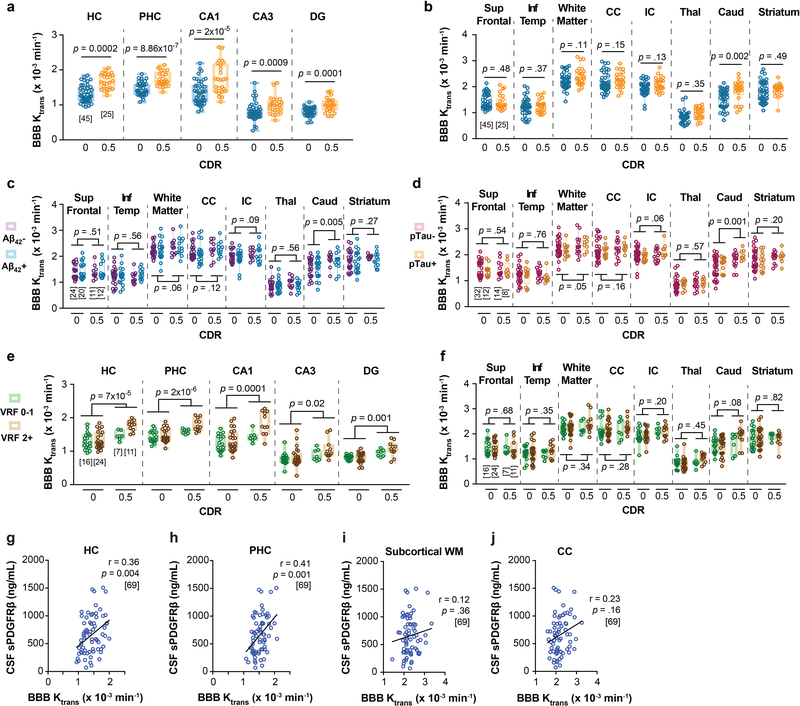
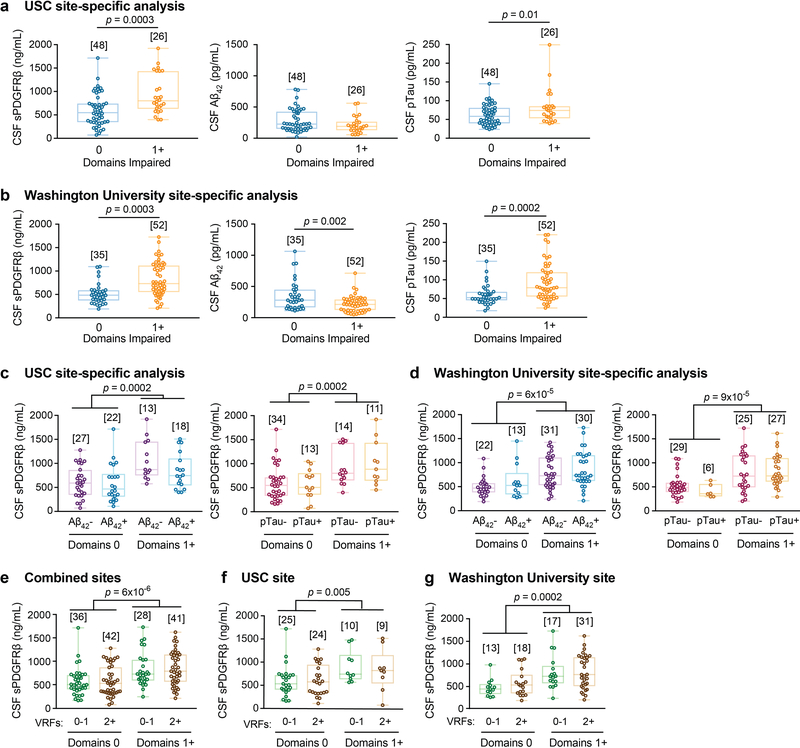
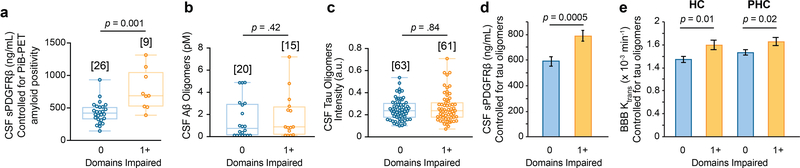
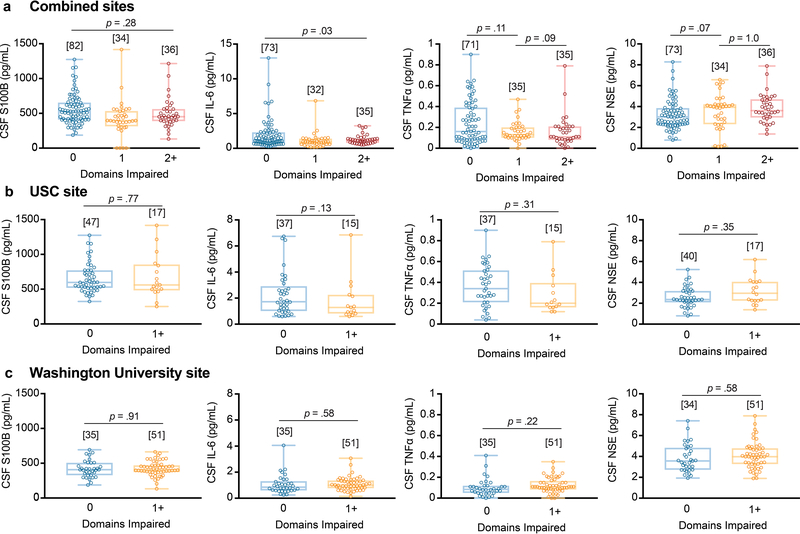
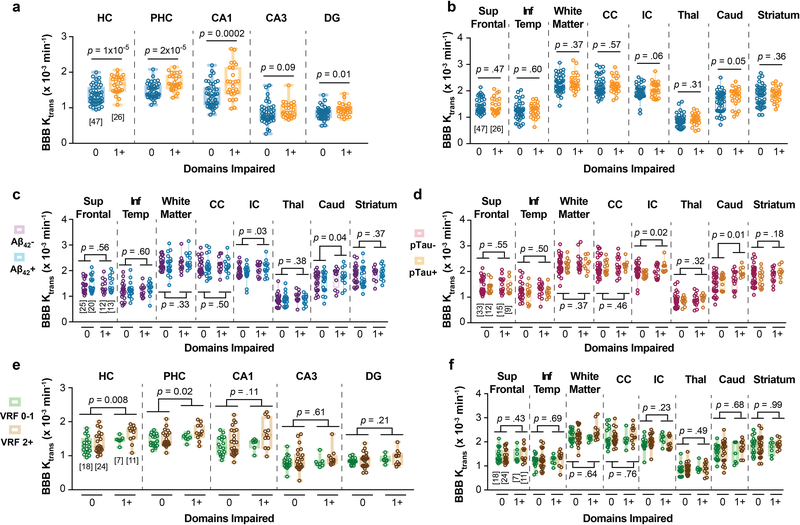
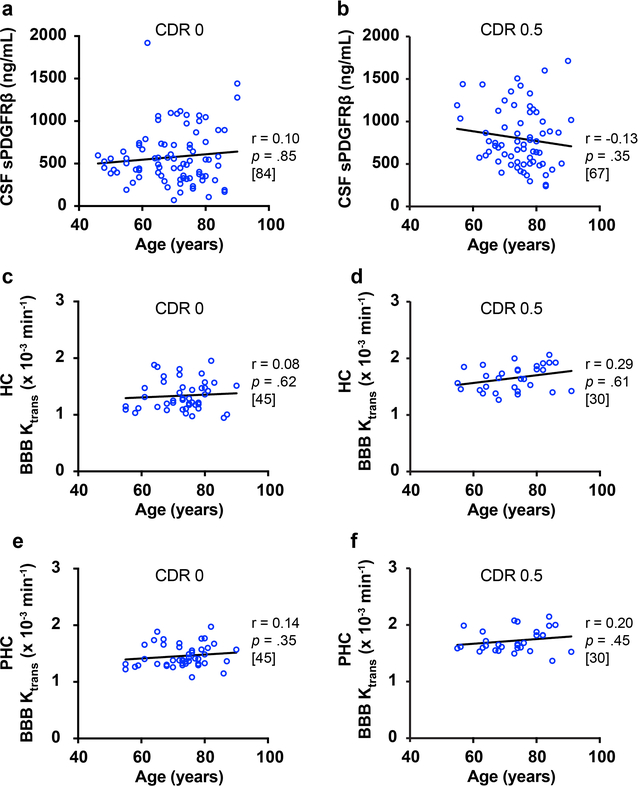
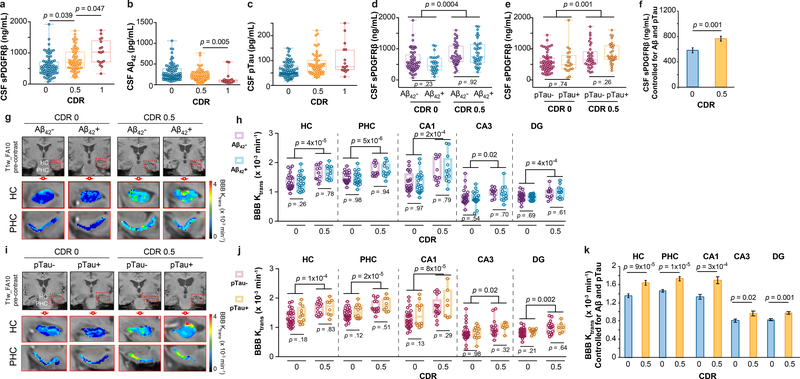
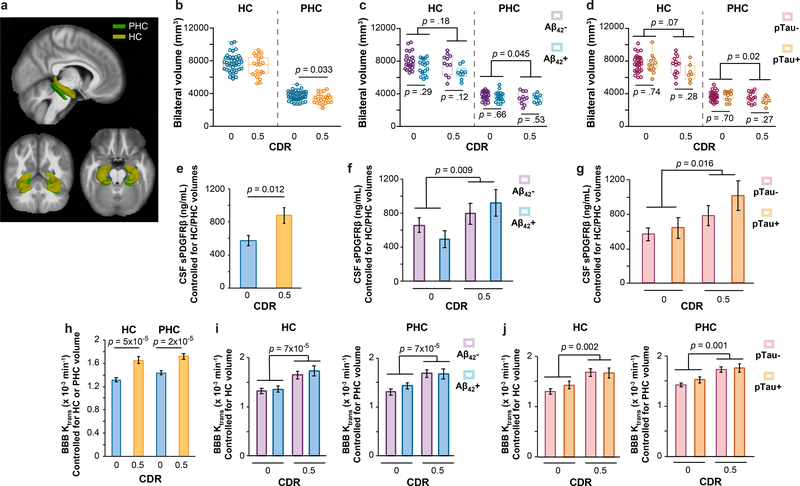
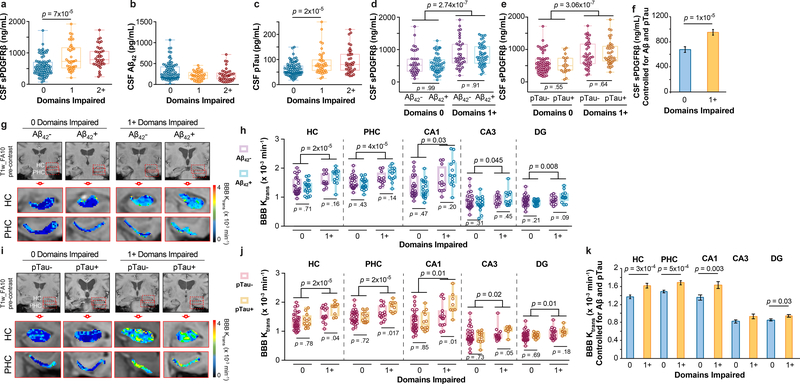
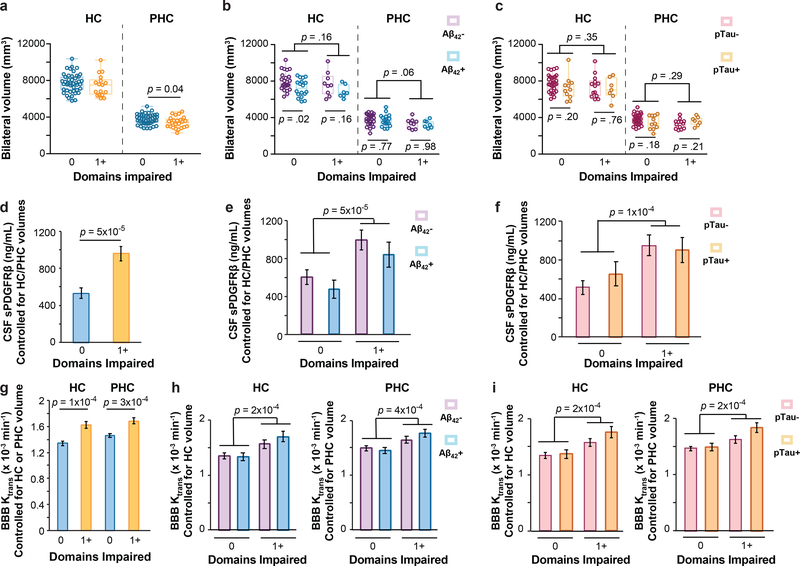
Vascular contributions to cognitive impairment are increasingly recognized1-5 as shown by neuropathological6,7, neuroimaging4,8-11, and cerebrospinal fluid biomarker4,12 studies. Moreover, small vessel disease of the brain has been estimated to contribute to approximately 50% of all dementias worldwide, including those caused by Alzheimer's disease (AD)3,4,13. Vascular changes in AD have been typically attributed to the vasoactive and/or vasculotoxic effects of amyloid-β (Aβ)3,11,14, and more recently tau15. Animal studies suggest that Aβ and tau lead to blood vessel abnormalities and blood-brain barrier (BBB) breakdown14-16. Although neurovascular dysfunction3,11 and BBB breakdown develop early in AD1,4,5,8-10,12,13, how they relate to changes in the AD classical biomarkers Aβ and tau, which also develop before dementia17, remains unknown. To address this question, we studied brain capillary damage using a novel cerebrospinal fluid biomarker of BBB-associated capillary mural cell pericyte, soluble platelet-derived growth factor receptor-β8,18, and regional BBB permeability using dynamic contrast-enhanced magnetic resonance imaging8-10. Our data show that individuals with early cognitive dysfunction develop brain capillary damage and BBB breakdown in the hippocampus irrespective of Alzheimer's Aβ and/or tau biomarker changes, suggesting that BBB breakdown is an early biomarker of human cognitive dysfunction independent of Aβ and tau.


Conflict of interest statement

COMPETING INTERESTS STATEMENT:

The authors declare no competing financial interests.

Figures

Extended Data Figure 1.
Extended Data Figure 1.. ADAM10 mediates soluble PDGFRβ (sPDGFRβ) shedding in human brain pericytes in vitro.
(a) Primary human brain vascular smooth muscle cells (SMCs) and pericytes were subjected to treatment with ionomycin (IM) (2.5 μM), a calcium ionophore that activates ADAM10, or control treatment (media only), and media was immunoprecipitated (IP) to measure sPDGFRβ by quantitative Western immunoblot. Compared to pericytes, SMCs shed extremely low levels of sPDGFRβ, which was not significantly increased by IM. Pericytes shed high basal levels of sPDGFRβ that was significantly increased by > 5-fold by treatment with IM, which activated ADAM10. To further determine ADAM10’s involvement, IM treatment was conducted in the presence of ADAM10 pharmacological inhibition with marimastat (MM, 4 μM) that inhibits ADAM10 by binding to active site zinc, and genetic siRNA knockdown of ADAM10. Both pharmacologic (MM) and genetic (siRNA) inhibition of ADAM10 significantly reduced sPDGFRβ shedding activated by IM by > 90% and 75%, respectively. (b) The siRNA ADAM10 knockdown efficiency in this study was 85% as shown by Western analysis. Data generated from n=3–6 independent culture experiments and plotted as means ± SEM. Statistical analyses: Panel a: SMC data by two-tailed Student’s t-test; pericyte data by ANOVA with Tukey post-hoc test. Panel b: Two-tailed Student’s t-test. Significance at α=0.05 for all analyses.
Extended Data Figure 2.
Extended Data Figure 2.. CSF sPDGFRβ increases with CDR impairment, independent of Aβ and tau, and reflects blood-brain barrier (BBB) breakdown.
(a-b) Site-specific analysis of CSF sPDGFRβ and standard AD biomarkers, Aβ42 and pTau, indicates an early increase in sPDGFRβ with increasing CDR in both independent clinical sites, USC (a) and Washington University (b). There were no changes in Aβ42 and pTau at USC site (a), whereas Aβ42, but not pTau, was altered at Washington University site; supports Figure 1 a-c. (c-d) Site-specific analysis of CSF sPDGFRβ increases with CDR, independent of CSF Aβ42 and pTau status in two independent sites, USC (c) and Washington University (d); supports Figure 1 d-f. (e-f) CSF sPDGFRβ is associated with blood-brain barrier (BBB) breakdown. CSF sPDGFRβ positively correlates with conventional biochemical biomarkers of BBB breakdown including CSF:plasma albumin ratio (Qalb) (e) and CSF fibrinogen (f); supports Figures 1 and 3. (g) CSF sPDGFRβ is increased with CDR, independent of amyloid positivity by (11)C-Pittsburgh compound B positron emission tomography (PiB-PET); supports Figure 1 d and f. (h-i) No differences were observed in CSF Aβ oligomer levels (h) and tau oligomer levels (i) in individuals with CDR 0 vs. CDR 0.5; supports Figure 1 d-f. (j-k) Increases in CSF sPDGFRβ (j) and regional BBB Ktrans in the hippocampus (HC) and parahippocampal gyrus (PHC) (k) of individuals with CDR 0.5 vs. CDR 0 remain significant after statistically controlling for the impact of CSF tau oligomers; supports Figure 1 d-f. Panels a-d, g-i: Box-and-whisker plot lines indicate median values, boxes indicate interquartile range and whiskers indicate minimum and maximum values. Panels a-d, g: significance tests from ANCOVAs. Panels e-f: Statistical significance determined by Pearson correlation; r = Pearson correlation coefficient. Panels h-i: Significance by two-tailed Student’s t-test at α=0.05. Panels j-k: ANCOVA models representing estimated marginal means ± SEM. Brackets denote sample size (n) in each analysis.
Extended Data Figure 3.
Extended Data Figure 3.. sPDGFRβ increases with CDR independent of vascular risk factors (VRFs), and no change in other neurovascular unit biomarkers.
(a-c) CSF sPDGFRβ is increased with CDR, independent of VRFs burden in the combined site analysis (a) and in two independent clinical sites from USC (b) and Washington University (c). VRFs 0–1: no or 1 vascular risk factor. VRFs 2+: 2 or more vascular risk factors. See Supplementary Table 1 for the list of VRFs; supports Figure 1 a-f. Box-and-whisker plot lines indicate median values, boxes indicate interquartile range and whiskers indicate minimum and maximum values. Significance tests from ANCOVAs. Brackets denote sample size (n) in each analysis.
Extended Data Figure 4.
Extended Data Figure 4.. Other CSF biomarkers of the neurovascular unit are not altered with CDR cognitive impairment.
(a-c) CSF markers of glial, inflammatory, or neuronal injury exhibited no significant differences between unimpaired and impaired individuals on CDR, including S100 calcium-binding protein B (S100B), interleukin-6 (IL-6), tumor necrosis factor-α (TNFα), or neuron-specific enolase (NSE) in the combined site analysis (a) and similarly in site-specific analysis of individuals from USC (b) and from Washington University (c); supports Figure 1 a-c. Box-and-whisker plot lines indicate median values, boxes indicate interquartile range and whiskers indicate minimum and maximum values. Significance tests from ANCOVAs. Brackets denote sample size (n) in each analysis.
Extended Data Figure 5.
Extended Data Figure 5.. Regional blood-brain barrier (BBB) breakdown Ktrans increases with CDR independent of CSF Aβ and tau and vascular risk factors (VRFs), and relates to sPDGFRβ only in hippocampal gray matter regions.
(a-b) An increase in Ktrans values in the hippocampus (HC), parahippocampal gyrus (PHC) and CA1, CA3 and dentate gyrus (DG) hippocampus subfields, with increasing CDR (a), but not in other brain regions including superior frontal cortical gyrus (Sup Front) and inferior temporal cortical gyrus (Inf Temp), white matter regions including subcortical white matter fibers (white matter, WM), corpus callosum (CC), and internal capsule (IC), and deep gray matter regions including thalamus (Thal), caudate nucleus (Caud) and striatum (b). (c-d) Additional brain regions showed no significant differences in Ktrans BBB permeability values in individuals with CDR 0 and CDR 0.5, regardless of CSF Aβ42 (c) or pTau (d) status. (e-f) VRFs burden does not influence an increase in the Ktrans BBB permeability values with increasing CDR in the HC, PHC, and hippocampus subfields (i.e., CA1, CA3, DG) (e), and no change in the Ktrans BBB permeability values in other brain regions (f). See Supplementary Table 1 for the list of VRFs. Panels a-f support Figure 1 g-k. (g-j) CSF sPDGFRβ is associated with BBB breakdown measured by neuroimaging in hippocampal gray matter regions (g-h), but not in WM regions (i-j); supports Figures 1 and 3. Panels a-f: Box-and-whisker plot lines indicate median values, boxes indicate interquartile range and whiskers indicate minimum and maximum values. Significance tests after FDR correction from ANCOVAs. Panels g-j: Statistical significance determined by Pearson correlation; r = Pearson correlation coefficient. Brackets denote sample size (n) in each analysis; applies to all regions within each panel.
Extended Data Figure 6.
Extended Data Figure 6.. CSF sPDGFRβ increases with CDR impairment, independent of Aβ, tau, and vascular risk factors (VRFs).
(a-b) Site-specific analysis of CSF sPDGFRβ and standard AD biomarkers, Aβ42 and pTau, indicates an early increase in sPDGFRβ with increasing domains impaired in both independent clinical sites, USC (a) and Washington University (b); supports Figure 3 a-c. (c-d) Site-specific analysis of CSF sPDGFRβ indicates increases with the number of cognitive domains impaired, independent of CSF Aβ42 and pTau status in two independent sites, USC (c) and Washington University (d); supports Figure 3 d-f. (e-g) CSF sPDGFRβ is increased with increasing number of cognitive domains impaired, independent of VRFs burden in the combined site analysis (e) and in two independent clinical sites, USC (f) and Washington University (g). VRFs 0–1: no or 1 vascular risk factor. VRFs 2+: 2 or more vascular risk factors. See Supplementary Table 2 for the list of VRFs. Supports Figure 3 a-f. Panels a-g: Box-and-whisker plot lines indicate median values, boxes indicate interquartile range and whiskers indicate minimum and maximum values. Significance tests from ANCOVAs. Brackets denote sample size (n) in each analysis.
Extended Data Figure 7.
Extended Data Figure 7.. BBB breakdown is independent of amyloid and tau oligomers.
(a) CSF sPDGFRβ is increased with cognitive domains impaired, independent of amyloid positivity by (11)C-Pittsburgh compound B positron emission tomography (PiB-PET); supports Figure 3 d and f. (b-c) No differences were observed in CSF Aβ oligomer levels (b) and tau oligomer levels (c) in individuals with 0 or 1+ cognitive domains impaired. (d-e) Increases in CSF sPDGFRβ (d) and regional blood-brain barrier (BBB) Ktrans in the hippocampus (HC) and parahippocampal gyrus (PHC) (e) of individuals with 1+ versus 0 cognitive domain impairment remain significant after statistically controlling for the impact of CSF tau oligomers; supports Figure 3 d-f. Panels a-c: Box-and-whisker plot lines indicate median values, boxes indicate interquartile range and whiskers indicate minimum and maximum values. Panel a: significance tests from ANCOVAs. Panels b-c: Significance by two-tailed Student’s t-test at α=0.05. Panels d-e: ANCOVA models representing estimated marginal means ± SEM. Brackets denote sample size (n) in each analysis.
Extended Data Figure 8.
Extended Data Figure 8.. Other CSF biomarkers of the neurovascular unit are not altered with cognitive domain impairment.
(a-c) CSF markers of glial, inflammatory, or neuronal injury exhibited no significant differences between unimpaired and impaired individuals on neuropsychological exams, including S100 calcium-binding protein B (S100B), interleukin-6* (IL-6), tumor necrosis factor-α (TNFα), or neuron-specific enolase (NSE) in the combined site analysis (a) or in the site-specific analysis of individuals from USC (b) or from Washington University (c). Panels a-c: Box-and-whisker plot lines indicate median values, boxes indicate interquartile range and whiskers indicate minimum and maximum values. Significance tests after FDR correction from ANCOVAs with post-hoc Bonferroni comparisons. Brackets denote sample size (n) in each analysis. *Analysis did not survive significance after FDR correction. Individual group comparison p values reported because omnibus test was p < 0.05 but post-hoc group comparisons were null. Supports Figure 3 a-c.
Extended Data Figure 9.
Extended Data Figure 9.. Regional blood-brain barrier (BBB) breakdown Ktrans increases with cognitive domain impairment, independent of CSF Aβ and tau and vascular risk factors (VRFs).
(a-b) An increase in Ktrans values in the hippocampus (HC), parahippocampal gyrus (PHC), and CA1, CA3 and dentate gyrus (DG) hippocampal subfields with increasing cognitive impairment measured by the number of cognitive domains impaired (a), but not in other brain regions including superior frontal cortical gyrus (Sup Front) and inferior temporal cortical gyrus (Inf Temp), white matter regions including subcortical white matter fibers (white matter), corpus callosum (CC), and internal capsule (IC), and deep gray matter regions including thalamus (Thal), caudate nucleus (Caud) and striatum (b). (c-d) Additional brain regions showed no significance difference in Ktrans BBB permeability in individuals with 0 and 1+ cognitive domains impaired, regardless of CSF Aβ42 (c) and pTau (d) status. (e-f) Ktrans BBB permeability is increased with increasing cognitive domain impairment in the HC, PHC, and hippocampal subfields (i.e., CA1, CA3, DG), independent of VRFs burden (e), but not in other brain regions (f). VRFs 0–1: no or 1 vascular risk factor; VRFs 2+: 2 or more vascular risk factors. See Supplementary Table 2 for the list of VRFs. Panels a-f: Box-and-whisker plot lines indicate median values, boxes indicate interquartile range and whiskers indicate minimum and maximum values. Significance tests after FDR correction from ANCOVAs. Brackets denote sample size (n) in each analysis; applies to all regions within each panel. Supports Figure 3 g-k.
Extended Data Figure 10.
Extended Data Figure 10.. CSF sPDGFRβ and medial temporal BBB permeability Ktrans values are not correlated with age, indicating that changes in CSF sPDGFRβ and Ktrans capture processes relating to cognitive impairment independent of normal aging. In CDR 0 individuals, age does not correlate with CSF sPDGFRβ.
(a) or regional Ktrans in the hippocampus (HC) (c) and parahippocampal gyrus (PHC) (e). Similarly, in CDR 0.5 individuals, age does not correlate with CSF sPDGFRβ (a) or regional Ktrans in the hippocampus (HC) (c) and parahippocampal gyrus (PHC) (e). Statistical significance determined by Pearson correlation; r = Pearson correlation coefficient. Brackets denote sample size (n) in each analysis. Supports Figures 1 and 3.
Figure 1.
Figure 1.. Early brain capillary damage and blood-brain barrier breakdown in human hippocampus and parahippocampal gyrus in individuals with increased clinical dementia rating score is independent of amyloid-β and tau status.
(a-c) CSF soluble platelet-derived growth factor receptor-β (sPDGFRβ) (a), Aβ1–42 (b) and pTau (c) levels in individuals with clinical dementia rating (CDR) score 0 (n=82), 0.5 (n=65) and 1 (n=17). (d) CSF sPDGFRβ in individuals with no cognitive impairment (CDR 0) that are CSF Aβ1–42 negative (Aβ-; n=53) or positive (Aβ+; n=29), and with cognitive dysfunction (CDR 0.5) that are Aβ- (n=38) or Aβ+ (n=38). (e) CSF sPDGFRβ in CDR 0 participants that are CSF pTau negative (pTau-; n=60) or positive (pTau+; n=21) and CDR 0.5 participants that are pTau- (n=33) or pTau+ (n=29). (f) CSF sPDGFRβ controlled for CSF Aβ42 and pTau levels in CDR 0 (n=80) and CDR 0.5 (n=61) participants. Estimated marginal means ± SEM from ANCOVA models. (g-h) Representative blood-brain barrier (BBB) Ktrans maps in the hippocampus (HC) and parahippocampal gyrus (PHC) (g), and quantification of Ktrans values in HC, PHC, and CA1, CA3 and dentate gyrus (DG) hippocampus subfields in CDR 0 individuals that are Aβ- (n=24) or Aβ+ (n=20) and CDR 0.5 participants that are Aβ- (n=11) or Aβ+ (n=12) (h). (i-j) Representative BBB Ktrans maps in HC and PHC (i), and quantification of Ktrans values in HC, PHC, and CA1, CA3 and DG hippocampus subfields in individuals with CDR 0 that are pTau- (n=32) or pTau+ (n=12), and with CDR 0.5 that are pTau- (n=14) or pTau+ (n=8) (j). (k) Regional Ktrans values controlled for CSF Aβ and pTau levels in CDR 0 (n=44) and CDR 0.5 (n=23) individuals. Estimated marginal means ± SEM from ANCOVA models. Box-and-whisker plot lines indicate median values, boxes indicate interquartile range and whiskers indicate minimum and maximum values. Significance tests after FDR correction from ANCOVAs with post-hoc Bonferroni comparisons.
Figure 2.
Figure 2.. Early brain capillary damage and blood-brain barrier breakdown in human hippocampus and parahippocamapal gyrus in individuals with increased clinical dementia rating score is independent of hippocampus and parahippocampal gyrus volume.
(a) 3D-segmented brain rendering of the anatomical ROIs, hippocampus (HC) and parahippocampal gyrus (PHC), overlaid on an MRI template in 3 orientations: sagittal, axial and transverse. (b-d) Bilateral HC and PHC volumes in individuals with CDR 0 (n=43) and 0.5 (n=22) (b), Aβ- (n=23) or Aβ+ (n=19) CDR 0, and Aβ- (n=11) or Aβ+ (n=9) CDR 0.5 (c), and pTau- (n=30) or pTau+ (n=12) CDR 0, and pTau- (n=13) or pTau+ (n=7) CDR 0.5 (d). (e-g) CSF sPDGFRβ values controlled for HC and PHC volume in individuals with CDR 0 (n=39) and CDR 0.5 (n=18) (e), Aβ- (n=23) or Aβ+ (n=16) CDR 0 and Aβ- (n=10) or Aβ+ (n=8) CDR 0.5 (f), and pTau- (n=30) or pTau+ (n=12) CDR 0 and pTau- (n=13) or pTau+ (n=7) CDR 0.5 (g). Estimated marginal means ± SEM from ANCOVA models. (h-j) BBB Ktrans values in the HC and PHC controlled for respective HC or PHC volume in individuals with CDR 0 (n=42) and CDR 0.5 (n=20) (h), and in the HC and PHC controlled for respective HC or PHC volume in individuals that are Aβ- (n=23) or Aβ+ (n=19) CDR 0 and Aβ- (n=11) or Aβ+ (n=9) CDR 0.5 (i), and pTau- (n=30) or pTau+ (n=12) CDR 0 and pTau- (n=13) or pTau+ (n=7) CDR 0.5 (j). Estimated marginal means ± SEM from ANCOVA models. Box-and-whisker plot lines indicate median values, boxes indicate interquartile range and whiskers indicate minimum and maximum values. Significance tests after FDR correction from ANCOVAs with post-hoc Bonferroni comparisons.
Figure 3.
Figure 3.. Early brain capillary damage and blood-brain barrier breakdown in human hippocampus and parahippocampal gyrus in individuals with increased cognitive domain impairment is independent of amyloid-β and tau status.
(a-c) CSF sPDGFRβ (a), Aβ1–42 (b) and pTau (c) levels in individuals with no cognitive domains impaired 0 (n=83), and with 1 (n=39) or 2+ (n=39) cognitive domains impaired. (d) CSF sPDGFRβ in individuals with no cognitive domains impaired that are CSF Aβ1–42 negative (Aβ-; n=35) or positive (Aβ+; n=49) and with one or more cognitive domains impaired that are Aβ- (n=37) or Aβ+ (n=47). (e) CSF sPDGFRβ in individuals with no cognitive domains impaired that are CSF pTau negative (pTau-; n=63) or positive (pTau+; n=19) and with one or more cognitive domains impaired that are pTau- (n=39) or pTau+ (n=38). (f) CSF sPDGFRβ controlled for CSF Aβ42 and pTau levels in individuals with 0 domains (n=80) and 1+ domains (n=74) impaired. Estimated marginal means ± SEM from ANCOVA models. (g-h) Representative blood-brain barrier (BBB) Ktrans maps in the hippocampus (HC) and parahippocampal gyrus (PHC) (g); quantification of Ktrans values in HC, PHC, and CA1, CA3 and dentate gyrus (DG) hippocampus subfields in individuals with no cognitive domains impaired that are Aβ- (n=25) or Aβ+ (n=20) and with one or more cognitive domains impaired that are Aβ- (n=12) or Aβ+ (n=13) (h). (i-j) Representative BBB Ktrans maps in HC and PHC (j); quantification of Ktrans values in HC, PHC, and CA1, CA3 and DG hippocampus subfields in individuals with no cognitive domains impaired that are pTau- (n=33) or pTau+ (n=12) and with one or more cognitive domains impaired that are pTau- (n=15) or pTau+ (n=9) (j). (k) Regional Ktrans values controlled for CSF Aβ and pTau levels in individuals with 0 domains (n=45) and 1+ domains (n=22) impaired. Estimated marginal means ± SEM from ANCOVA. Box-and-whisker plot lines indicate median values, boxes indicate interquartile range and whiskers indicate minimum and maximum values. Significance tests after FDR correction from ANCOVAs with post-hoc Bonferroni comparisons.
Figure 4.
Figure 4.. Early brain capillary damage and blood-brain barrier breakdown in human hippocampus and parahippocamapal gyrus in individuals with increased cognitive domain impairment is independent of hippocampus and parahippocampal gyrus volume.
(a-c) Bilateral HC and PHC volumes in individuals with 0 (n=44) and 1+ (n=24) cognitive domains impaired (a), Aβ- (n=25) or Aβ+ (n=18) with 0 domains impaired and Aβ- (n=9) or Aβ+ (n=7) with 1+ domains impaired (b), and pTau- (n=32) or pTau+ (n=11) with 0 domains impaired and pTau- (n=13) or pTau + (n=7) with 1+ domains impaired (c). (d-f) CSF sPDGFRβ controlled for HC and PHC volume in individuals with 0 domains (n=38) and 1+ domains (n=21) impaired (d), and Aβ- (n=30) or Aβ+ (n=12) 0 domains impaired and Aβ- (n=15) or Aβ+ (n=7) 1+ domains impaired (e), and pTau- (n=30) or pTau+ (n=12) 0 domains impaired and pTau- (n=13) or pTau+ (n=7) 1+ domains impaired (f). Estimated marginal means ± SEM from ANCOVA models. (g-i) BBB Ktrans values in the HC and PHC controlled for respective HC or PHC volume in individuals with 0 domains impaired (n=44) and 1+ domains impaired (n=21) (g), and in the HC and PHC controlled for respective HC or PHC volume in participants that are Aβ- (n=24) or Aβ+ (n=18) 0 domains impaired and Aβ- (n=12) or Aβ+ (n=10) 1+ domains impaired (h), and pTau- (n=30) or pTau+ (n=12) 0 domains impaired and pTau- (n=13) or pTau+ (n=7) 1+ domains impaired (i). Estimated marginal means ± SEM from ANCOVA models. Box-and-whisker plot lines indicate median values, boxes indicate interquartile range and whiskers indicate minimum and maximum values. Significance tests after FDR correction from ANCOVAs with post-hoc Bonferroni comparisons.

Comment in

Similar articles

Cited by

References

    1. Snyder HM et al. Vascular contributions to cognitive impairment and dementia including Alzheimer’s disease. Alzheimers Dement. J. Alzheimers Assoc 11, 710–717 (2015). - PMC - PubMed
    1. Gottesman RF et al. Association Between Midlife Vascular Risk Factors and Estimated Brain Amyloid Deposition. JAMA 317, 1443–1450 (2017). - PMC - PubMed
    1. Iadecola C The Neurovascular Unit Coming of Age: A Journey through Neurovascular Coupling in Health and Disease. Neuron 96, 17–42 (2017). - PMC - PubMed
    1. Sweeney MD, Sagare AP & Zlokovic BV Blood-brain barrier breakdown in Alzheimer disease and other neurodegenerative disorders. Nat. Rev. Neurol 14, 133–150 (2018). - PMC - PubMed
    1. Zlokovic BV Neurovascular pathways to neurodegeneration in Alzheimer’s disease and other disorders. Nat. Rev. Neurosci 12, 723–738 (2011). - PMC - PubMed

Publication types

MeSH terms