. 2018 Dec 18;49(6):1116-1131.e7.
doi: 10.1016/j.immuni.2018.10.013. Epub 2018 Nov 13.

The Microbial Metabolite Butyrate Stimulates Bone Formation via T Regulatory Cell-Mediated Regulation of WNT10B Expression

Affiliations

The Microbial Metabolite Butyrate Stimulates Bone Formation via T Regulatory Cell-Mediated Regulation of WNT10B Expression

Abdul Malik Tyagi et al. Immunity. .

Abstract

Nutritional supplementation with probiotics can prevent pathologic bone loss. Here we examined the impact of supplementation with Lactobacillus rhamnosus GG (LGG) on bone homeostasis in eugonadic young mice. Micro-computed tomography revealed that LGG increased trabecular bone volume in mice, which was due to increased bone formation. Butyrate produced in the gut following LGG ingestion, or butyrate fed directly to germ-free mice, induced the expansion of intestinal and bone marrow (BM) regulatory T (Treg) cells. Interaction of BM CD8+ T cells with Treg cells resulted in increased secretion of Wnt10b, a bone anabolic Wnt ligand. Mechanistically, Treg cells promoted the assembly of a NFAT1-SMAD3 transcription complex in CD8+ cells, which drove expression of Wnt10b. Reducing Treg cell numbers, or reconstitution of TCRβ-/- mice with CD8+ T cells from Wnt10b-/- mice, prevented butyrate-induced bone formation and bone mass acquisition. Thus, butyrate concentrations regulate bone anabolism via Treg cell-mediated regulation of CD8+ T cell Wnt10b production.

Keywords: Lactobacillus rhamnosus GG; NFAT; T cells; Wnt10b; bone formation; butyrate; microbiota; probiotics; regulatory T cells; short-chain fatty acids.


Conflict of interest statement

DECLARATION OF INTERESTS

The authors declare no competing interests.

Figures
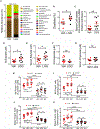
Figure 1.
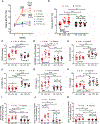
Figure 1.. LGG Increases the Relative Frequency of Clostridia in the Gut, the Levels of Butyrate (But) in the Small Intestine and Serum, and the Number of BM and Splenic Treg Cells
(A and B) Detailed relative abundance of bacterial taxa at the class level within fecal pellets collected from mice treated with LGG or vehicle control for 4 weeks. (legend continued on next page) (C) Measurement of transcript levels of butyryl-CoA:acetate CoA-transferase in the luminal contents of the ileum in mice administered LGG or vehicle control for 4 weeks. (D–G) Butyrate and propionate concentrations in small intestine tissue and serum of mice administered LGG or vehicle control for 4 weeks. (H and I) Relative and absolute frequency of BM Treg cells. (J and K) Relative and absolute frequency of splenic Treg cells. Data were expressed as mean ± SEM. All data were normally distributed according to the Shapiro-Wilk normality test. n = 6–7 mice per group in (A) and (B); n = 9 mice per group in (C)–(G); n = 12–13 mice per group in (H)–(K). Data (B–G) were analyzed by unpaired t tests. All other data were analyzed by two-way ANOVA and post hoc tests applying the Bonferroni correction for multiple comparisons. *p < 0.05, **p < 0.01, ***p < 0.001, and ****p < 0.0001 compared to the indicated group. ns = not significant.
Figure 2.
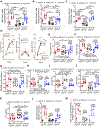
Figure 2.. Treatment with Anti-CD25 Ab Abrogates the Bone Anabolic Activity of LGG and Butyrate (But)
(A) Prospective measurements of vertebral trabecular bone volume fraction (BV/TV) by in vivo μCT scanning. (B) Cross-sectional measurements of femoral BV/TV by in vitro mCT scanning. (C) Mineral apposition rate (MAR). (D) Bone formation rate per mm bone surface (BFR/BS). (E) Number of osteoclasts per mm bone surface (N.Oc/BS). (F) Percentage of bone surface covered by osteoclasts (Oc.S/BS). (G) Serum levels of P1NP, a marker of bone formation. (H) Serum levels of type 1 cross-linked C-telopeptide (CTX), a marker of bone resorption. (I–K) Wnt10b mRNA levels in whole BM, BM CD8+ T cells, and BM CD4+ T cells. n = 10–17 mice per group. Data were expressed as mean ± SEM. All data were normally distributed according to the Shapiro-Wilk normality test. Data in (A) were analyzed by ANOVA for repeated-measures. ****p < 0.0001 compared to baseline, ####p < 0.0001 compared to Irr. Ab vehicle. All other data were analyzed by two-way ANOVA and post hoc tests applying the Bonferroni correction for multiple comparisons. *p < 0.05, **p < 0.01, ***p < 0.001, and ****p < 0.0001 compared to the indicated group. ns = not significant. Irr. Ab = Irrelevant antibody.
Figure 3.
Figure 3.. Treatment of DEREG Mice but Not of WT Littermates (WTLM) with Diphtheria Toxin (DT) Prevents the Increase in the Number of Treg Cells and the Bone Anabolic Activity Induced by LGG and Butyrate (But)
(A and B) Absolute number of Treg cells in the BM and the spleen. (C) Relative number of Treg cells in Peyer’s patches (PP). Since the enumeration of the absolute number of PP Treg cells is inaccurate, PP Treg cells are shown as percentage. (D) Prospective measurements of vertebral trabecular bone volume fraction (BV/TV) by in vivo μCT scanning. (E) Cross-sectional measurements of femoral BV/TV by in vitro μCT scanning. (F) Mineral apposition rate (MAR). (G) Bone formation rate (BFR). (H) The number of osteoclasts per mm bone surface (N.Oc/BS). (I) The percentage of bone surface covered by osteoclasts (Oc.S/BS). (J) Serum levels of osteocalcin (OCN), a marker of bone formation. (K) Serum levels of type 1 cross-linked C-telopeptide of collagen (CTX), a marker of bone resorption. (L) Wnt10b mRNA levels in whole BM. (M) Wnt10b mRNA levels in BM CD8+ T cells. For this assay, samples from 2 mice per group were randomly pooled together to generate a sufficient amount of mRNA. n = 6–13 mice per group. Data were expressed as mean ± SEM. All data were normally distributed according to the Shapiro-Wilk normality test. Data in (A) were analyzed by ANOVA for repeatedmeasures. *p < 0.05, **p < 0.01, ***p < 0.001, and ****p < 0.0001 compared to baseline, #p < 0.05, ##p < 0.01, ###p < 0.001, and ####p < 0.0001 compared to Irr. Ab vehicle. Data in (B)–(L) were analyzed by two-way ANOVA and post hoc tests applying the Bonferroni correction for multiple comparisons. *p < 0.05, **p < 0.01, ***p < 0.001, and ****p < 0.0001 compared to the indicated group. ns = not significant.
Figure 4.
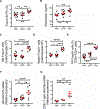
Figure 4.. Butyrate (But), but Not LGG Induces Bone Anabolic Effects in Germ-Free Mice
(A) Femoral trabecular bone volume fraction (BV/TV) as measured by in vitro mCT scanning. (B) Serum levels of osteocalcin, a marker of bone formation. (C and D) Absolute number of Treg cells in the BM and the spleen. (E) Relative number of Treg cells in Peyer’s patches (PP). Since the enumeration of the absolute number of PP Treg cells is inaccurate, PP Treg cells are shown as percentage. (F) Wnt10b mRNA levels in whole BM. (G) Wnt10b mRNA levels in BM CD8+ T cells. For (G), samples from 2 mice per group were randomly pooled together to generate a sufficient amount of mRNA. n = 5–10 mice per group. Data are expressed as mean ± SEM. All data were normally distributed according to the Shapiro-Wilk normality test. Data were analyzed by one-way ANOVA and post hoc tests applying the Bonferroni correction for multiple comparisons. *p < 0.05, **p < 0.01, and ****p < 0.0001 compared to the indicated group. ns = not significant.
Figure 5.
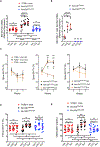
Figure 5.. LGG and Butyrate (But) Do Not Induce Bone Anabolic Effects in Mice that Are Deficient in T Cell Production of Wnt10b
TCRβ−/− mice were adoptively transferred with WT CD4+ T cells and WT CD8+ T cells, or WT CD4+ T cells and Wnt10b−/− CD8+ T cells. (A) Whole BM Wnt10b transcript levels. (B) Wnt10b transcript levels in CD8+ T cells purified from reconstituted TCRβ−/− mice at the end of the LGG or butyrate (but) treatment period. (C) Prospective measurements of vertebral trabecular bone volume fraction (BV/TV) by in vivo μCT scanning. (D) Femoral BV/TV as measured by in vitro μCT scanning at the end of the treatment period. (E) Serum levels of osteocalcin, a marker of bone formation. n = 5–12 mice per group. In (B), samples from 2 mice were pooled together. Data are expressed as mean ± SEM. All data were normally distributed according to the Shapiro-Wilk normality test. Data were analyzed by two-way ANOVA for repeated-measures and post hoc tests applying the Bonferroni correction for multiple comparisons. *p < 0.05, **p < 0.01, and ****p < 0.0001 compared to the indicated group, or baseline. ##p < 0.01, ###p < 0.001 compared to vehicle. ns = not significant.
Figure 6.
Figure 6.. LGG and Butyrate (But) Increase Wnt10b Transcription by Promoting the Binding of NFAT/SMAD Complexes to the Wnt10b Promoter
(A) Measurement of Wnt10b transcript levels in splenic CD8+ T cells treated with the NFAT activator ionomycin and TGFβ. (B–E) ChIP assays measuring LGG and butyrate induced binding of NFAT1, SMAD3, NFAT2, and SMAD2, to the Wnt10b promoter in BM CD8+ T cells. Cells from 4–5 mice were pooled to generate 1 sample. (F) Diagrammatic representation of the Wnt10b promoter and effects of Wnt10b promoter deletion on the activity of Wnt10b-luciferase reporter constructs in primary splenic CD8+ T cells. Cells were stimulated with ionomycin (500 ng/mL) and TGFβ1 (5 ng/mL) for 24 hr to induce reporter activity. n = 3 samples per group. (G) Effects of mutation of the SMAD and NFAT binding sites on the Wnt10b promoter on the activity of a luciferase-Wnt10b reporter construct in primary splenic CD8+ T cells. Data were expressed as mean ± SEM. Data were analyzed by Kruskal-Wallis and Dunn’s multiple comparisons non-parametric tests, as they were not normally distributed as assessed by Shapiro-Wilk normality test. In (A), n = 5 per group, **p < 0.01 and ****p < 0.0001 compared to the indicated groups. In (B)–(F), n = 3 samples per group, *p < 0.05, **p < 0.01, ***p < 0.001, and ****p < 0.0001 compared to Veh Irr.Ab or empty vector. In (G), n = 3 samples per group, ****p < 0.0001 compared to all other groups.
Figure 7.
Figure 7.. Effects of LGG and Butyrate (But) on TGFb1 Production by BM T Cells, on NFAT1/2 and SMAD2/3 Activation, and on PI3K and Akt Signaling in BM CD8+ T Cells
(A–C) TGFb1 mRNA expression by FACS-sorted BM conventional eGFPCD4+ T cells, eGFPCD8+ T cells, and eGFP+ Treg cells. DEREG (eGFP.Foxp3) reporter mice were treated with vehicle, LGG, or butyrate for 4 weeks. BM cells were sorted at the end of the treatment period. (D) Immunoblot analysis for the detection of NFAT1, NFAT2, pSMAD2, and pSMAD3 in purified BM CD8+ T cells. (E) Immunoblot analysis for the detection of c-Jun and c-Fos in purified BM CD8+ T cells. (D and E) Fresh BM CD8+ T cells were pooled together and then used for obtaining nuclear and cytoplasmic fractions. Laminin B1 was used as nuclear loading control. Tubulin was used as cytoplasmic loading control. (F) Immunoblot analysis for the detection of Phospho-PI3K p85 in the whole lysate from BM CD8+ T cells. (G and H) pAKT levels in BM CD8+ T cells and percent of pAKT+ BM CD8+ T cells, as determined by flow cytometry. (D–F) Conventionally raised WT mice were treated with vehicle, LGG, or butyrate for 4 weeks. BM CD8+ T cells were purified at the end of the treatment period using the EasySep Mouse CD8+ T Cell Isolation Kit. One representative experiment of 3 experiments. Data were expressed as mean ± SEM, n = 5–10 mice per group in (A)–(C), (G), and (H). Data were analyzed by two-way ANOVA and post hoc tests applying the Bonferroni correction for multiple comparisons. **p < 0.01, ***p < 0.001, and ****p < 0.0001 compared to vehicle or the indicated group. ns = not significant.

Comment in

Similar articles

Cited by

References

    1. Almeida M, Han L, Bellido T, Manolagas SC, and Kousteni S (2005). Wnt proteins prevent apoptosis of both uncommitted osteoblast progenitors and differentiated osteoblasts by beta-catenin-dependent and -independent signaling cascades involving Src/ERK and phosphatidylinositol 3-kinase/AKT. J. Biol. Chem 280, 41342–41351. - PubMed
    1. Arpaia N, Campbell C, Fan X, Dikiy S, van der Veeken J, deRoos P, Liu H, Cross JR, Pfeffer K, Coffer PJ, and Rudensky AY (2013). Metabolites produced by commensal bacteria promote peripheral regulatory T-cell generation. Nature 504, 451–455. - PMC - PubMed
    1. Bach Knudsen KE (2015). Microbial degradation of whole-grain complex carbohydrates and impact on short-chain fatty acids and health. Adv. Nutr 6, 206–213. - PMC - PubMed
    1. Bedi B, Li JY, Tawfeek H, Baek KH, Adams J, Vangara SS, Chang MK, Kneissel M, Weitzmann MN, and Pacifici R (2012). Silencing of parathyroid hormone (PTH) receptor 1 in T cells blunts the bone anabolic activity of PTH. Proc. Natl. Acad. Sci. USA 109, E725–E733. - PMC - PubMed
    1. Bennett CN, Longo KA, Wright WS, Suva LJ, Lane TF, Hankenson KD, and MacDougald OA (2005). Regulation of osteoblastogenesis and bone mass by Wnt10b. Proc. Natl. Acad. Sci. USA 102, 3324–3329. - PMC - PubMed

Publication types

MeSH terms