Relationship between intact HIV-1 proviruses in circulating CD4+ T cells and rebound viruses emerging during treatment interruption
- PMID: 30420517
- PMCID: PMC6275529
- DOI: 10.1073/pnas.1813512115
Relationship between intact HIV-1 proviruses in circulating CD4+ T cells and rebound viruses emerging during treatment interruption
Abstract
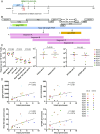
Combination antiretroviral therapy controls but does not cure HIV-1 infection because a small fraction of cells harbor latent viruses that can produce rebound viremia when therapy is interrupted. The circulating latent virus reservoir has been documented by a variety of methods, most prominently by viral outgrowth assays (VOAs) in which CD4+ T cells are activated to produce virus in vitro, or more recently by amplifying proviral near full-length (NFL) sequences from DNA. Analysis of samples obtained in clinical studies in which individuals underwent analytical treatment interruption (ATI), showed little if any overlap between circulating latent viruses obtained from outgrowth cultures and rebound viruses from plasma. To determine whether intact proviruses amplified from DNA are more closely related to rebound viruses than those obtained from VOAs, we assayed 12 individuals who underwent ATI after infusion of a combination of two monoclonal anti-HIV-1 antibodies. A total of 435 intact proviruses obtained by NFL sequencing were compared with 650 latent viruses from VOAs and 246 plasma rebound viruses. Although, intact NFL and outgrowth culture sequences showed similar levels of stability and diversity with 39% overlap, the size of the reservoir estimated from NFL sequencing was larger than and did not correlate with VOAs. Finally, intact proviruses documented by NFL sequencing showed no sequence overlap with rebound viruses; however, they appear to contribute to recombinant viruses found in plasma during rebound.
Keywords: HIV; analytical treatment interruption; latent reservoir; sequencing.
Copyright © 2018 the Author(s). Published by PNAS.
Conflict of interest statement
Conflict of interest statement: There are patents on 3BNC117 (PTC/US2012/038400) and 10-1074 (PTC/US2013/065696) that list Michel Nussenzweig as an inventor.
Figures


Similar articles
-
Characterization of Intact Proviruses in Blood and Lymph Node from HIV-Infected Individuals Undergoing Analytical Treatment Interruption.J Virol. 2019 Apr 3;93(8):e01920-18. doi: 10.1128/JVI.01920-18. Print 2019 Apr 15. J Virol. 2019. PMID: 30700598 Free PMC article. Clinical Trial.
-
HIV-1 latent reservoir size and diversity are stable following brief treatment interruption.J Clin Invest. 2018 Jul 2;128(7):3102-3115. doi: 10.1172/JCI120194. Epub 2018 Jun 18. J Clin Invest. 2018. PMID: 29911997 Free PMC article. Clinical Trial.
-
Sequence Evaluation and Comparative Analysis of Novel Assays for Intact Proviral HIV-1 DNA.J Virol. 2021 Feb 24;95(6):e01986-20. doi: 10.1128/JVI.01986-20. Print 2021 Feb 24. J Virol. 2021. PMID: 33361426 Free PMC article.
-
Low Inducibility of Latent Human Immunodeficiency Virus Type 1 Proviruses as a Major Barrier to Cure.J Infect Dis. 2021 Feb 15;223(12 Suppl 2):13-21. doi: 10.1093/infdis/jiaa649. J Infect Dis. 2021. PMID: 33586775 Free PMC article. Review.
-
New Approaches to Multi-Parametric HIV-1 Genetics Using Multiple Displacement Amplification: Determining the What, How, and Where of the HIV-1 Reservoir.Viruses. 2021 Dec 10;13(12):2475. doi: 10.3390/v13122475. Viruses. 2021. PMID: 34960744 Free PMC article. Review.
Cited by
-
HIV-1 Persistence and Chronic Induction of Innate Immune Responses in Macrophages.Viruses. 2020 Jun 30;12(7):711. doi: 10.3390/v12070711. Viruses. 2020. PMID: 32630058 Free PMC article. Review.
-
Clones of infected cells arise early in HIV-infected individuals.JCI Insight. 2019 Jun 20;4(12):e128432. doi: 10.1172/jci.insight.128432. eCollection 2019 Jun 20. JCI Insight. 2019. PMID: 31217357 Free PMC article.
-
Transient viral replication during analytical treatment interruptions in SIV infected macaques can alter the rebound-competent viral reservoir.PLoS Pathog. 2021 Jun 18;17(6):e1009686. doi: 10.1371/journal.ppat.1009686. eCollection 2021 Jun. PLoS Pathog. 2021. PMID: 34143853 Free PMC article.
-
Lessons for Understanding Central Nervous System HIV Reservoirs from the Last Gift Program.Curr HIV/AIDS Rep. 2022 Dec;19(6):566-579. doi: 10.1007/s11904-022-00628-8. Epub 2022 Oct 19. Curr HIV/AIDS Rep. 2022. PMID: 36260191 Free PMC article. Review.
-
Single-Cell Sequencing Facilitates Elucidation of HIV Immunopathogenesis: A Review of Current Literature.Front Immunol. 2022 Feb 3;13:828860. doi: 10.3389/fimmu.2022.828860. eCollection 2022. Front Immunol. 2022. PMID: 35185920 Free PMC article. Review.
References
-
- Finzi D, et al. Identification of a reservoir for HIV-1 in patients on highly active antiretroviral therapy. Science. 1997;278:1295–1300. - PubMed
Publication types
MeSH terms
Substances
Grants and funding
LinkOut - more resources
Full Text Sources
Medical
Molecular Biology Databases
Research Materials

