FcRn Expression in Wildtype Mice, Transgenic Mice, and in Human Tissues
- PMID: 30326650
- PMCID: PMC6316262
- DOI: 10.3390/biom8040115
FcRn Expression in Wildtype Mice, Transgenic Mice, and in Human Tissues
Abstract
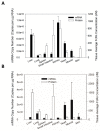
Quantitative real-time PCR and Western blot methods were developed to assess neonatal Fc-receptor (FcRn) mRNA and protein expression in human FcRn transgenic mice, Swiss Webster mice, and in select human tissues. Additionally, FcRn turnover was evaluated via pulse-chase. FcRn mRNA expression was significantly higher in transgenic mice when compared to mouse FcRn mRNA in Swiss Webster mice and it ranged from 184-fold higher in the kidney to 109,000-fold higher in the skin. FcRn protein expression was found to be 13-fold lower in kidney to 5.6-fold higher in lung obtained from transgenic mice compared to FcRn protein expression in lung samples obtained from Swiss Webster mice. FcRn protein expression in human liver and small intestine tissues matched more closely with FcRn expression in Swiss Webster mice but were significantly lower when compared to values found from Swiss Webster and transgenic mice. Although FcRn mRNA expression correlated significantly with protein expression (p < 0.0005), the correlation coefficient was only 0.113. As such, the measurement of FcRn protein may be preferred to FcRn mRNA for quantitative applications. Significant differences were found in FcRn expression in transgenic mice, Swiss Webster mice, and human tissues, which may have implications for the use of mouse models in the assessment of monoclonal antibody disposition, efficacy, and safety.
Keywords: FcRn; human FcRn transgenic mouse; mRNA; protein; tissue expression.
Conflict of interest statement
The authors declare no conflict of interest.
Figures


Similar articles
-
Expression of neonatal Fc receptor in the eye.Invest Ophthalmol Vis Sci. 2014 Mar 19;55(3):1607-15. doi: 10.1167/iovs.13-12574. Invest Ophthalmol Vis Sci. 2014. PMID: 24550358 Free PMC article.
-
Human FcRn Transgenic Mice for Pharmacokinetic Evaluation of Therapeutic Antibodies.Methods Mol Biol. 2016;1438:103-14. doi: 10.1007/978-1-4939-3661-8_6. Methods Mol Biol. 2016. PMID: 27150086
-
Generation of a double transgenic humanized neonatal Fc receptor (FcRn)/albumin mouse to study the pharmacokinetics of albumin-linked drugs.J Control Release. 2016 Feb 10;223:22-30. doi: 10.1016/j.jconrel.2015.12.019. Epub 2015 Dec 14. J Control Release. 2016. PMID: 26699424
-
Neonatal Fc receptor (FcRn): a novel target for therapeutic antibodies and antibody engineering.J Drug Target. 2014 May;22(4):269-78. doi: 10.3109/1061186X.2013.875030. Epub 2014 Jan 9. J Drug Target. 2014. PMID: 24404896 Review.
-
Accelerating antibody discovery using transgenic animals overexpressing the neonatal Fc receptor as a result of augmented humoral immunity.Immunol Rev. 2015 Nov;268(1):269-87. doi: 10.1111/imr.12364. Immunol Rev. 2015. PMID: 26497527 Review.
Cited by
-
In vivo Antibody Painting for Next Generation Weight Loss Drugs.bioRxiv [Preprint]. 2024 Aug 23:2024.08.22.609257. doi: 10.1101/2024.08.22.609257. bioRxiv. 2024. PMID: 39229199 Free PMC article. Preprint.
-
Relevance of the Materno-Fetal Interface for the Induction of Antigen-Specific Immune Tolerance.Front Immunol. 2020 May 14;11:810. doi: 10.3389/fimmu.2020.00810. eCollection 2020. Front Immunol. 2020. PMID: 32477339 Free PMC article. Review.
-
Pharmacokinetic-pharmacodynamic modelling of the anti-FcRn monoclonal antibody rozanolixizumab: Translation from preclinical stages to the clinic.CPT Pharmacometrics Syst Pharmacol. 2022 Jan;11(1):116-128. doi: 10.1002/psp4.12739. Epub 2021 Nov 23. CPT Pharmacometrics Syst Pharmacol. 2022. PMID: 34735735 Free PMC article.
-
Murine cancer cachexia models replicate elevated catabolic pembrolizumab clearance in humans.JCSM Rapid Commun. 2021 Jul-Dec;4(2):232-244. doi: 10.1002/rco2.32. Epub 2021 Feb 9. JCSM Rapid Commun. 2021. PMID: 34514376 Free PMC article.
-
Mechanistic incorporation of FcRn binding in plasma and endosomes in a whole body PBPK model for large molecules.J Pharmacokinet Pharmacodyn. 2023 Jun;50(3):229-241. doi: 10.1007/s10928-023-09849-9. Epub 2023 Mar 6. J Pharmacokinet Pharmacodyn. 2023. PMID: 36877385
References
-
- Hooks M.A., Wade C.S., Millikan W.J., Jr. Muromonab CD-3: A review of its pharmacology, pharmacokinetics, and clinical use in transplantation. Pharmacotherapy. 1991;11:26–37. - PubMed
-
- Petkova S.B., Akilesh S., Sproule T.J., Christianson G.J., Al Khabbaz H., Brown A.C., Presta L.G., Meng Y.G., Roopenian D.C. Enhanced half-life of genetically engineered human IgG1 antibodies in a humanized FcRn mouse model: Potential application in humorally mediated autoimmune disease. Int. Immunol. 2006;18:1759–1769. doi: 10.1093/intimm/dxl110. - DOI - PubMed
Publication types
MeSH terms
Substances
LinkOut - more resources
Full Text Sources
Molecular Biology Databases
Research Materials

