. 2018 Dec;136(6):919-938.
doi: 10.1007/s00401-018-1895-y. Epub 2018 Aug 23.

Changes in proteome solubility indicate widespread proteostatic disruption in mouse models of neurodegenerative disease

Affiliations

Changes in proteome solubility indicate widespread proteostatic disruption in mouse models of neurodegenerative disease

Michael C Pace et al. Acta Neuropathol. 2018 Dec.

Abstract

The deposition of pathologic misfolded proteins in neurodegenerative disorders such as Alzheimer's disease, Parkinson's disease, frontotemporal dementia and amyotrophic lateral sclerosis is hypothesized to burden protein homeostatic (proteostatic) machinery, potentially leading to insufficient capacity to maintain the proteome. This hypothesis has been supported by previous work in our laboratory, as evidenced by the perturbation of cytosolic protein solubility in response to amyloid plaques in a mouse model of Alzheimer's amyloidosis. In the current study, we demonstrate changes in proteome solubility are a common pathology to mouse models of neurodegenerative disease. Pathological accumulations of misfolded tau, α-synuclein and mutant superoxide dismutase 1 in CNS tissues of transgenic mice were associated with changes in the solubility of hundreds of CNS proteins in each model. We observed that changes in proteome solubility were progressive and, using the rTg4510 model of inducible tau pathology, demonstrated that these changes were dependent upon sustained expression of the primary pathologic protein. In all of the models examined, changes in proteome solubility were robust, easily detected, and provided a sensitive indicator of proteostatic disruption. Interestingly, a subset of the proteins that display a shift towards insolubility were common between these different models, suggesting that a specific subset of the proteome is vulnerable to proteostatic disruption. Overall, our data suggest that neurodegenerative proteinopathies modeled in mice impose a burden on the proteostatic network that diminishes the ability of neural cells to prevent aberrant conformational changes that alter the solubility of hundreds of abundant cellular proteins.

Keywords: Neurodegeneration; Protein misfolding; Proteinopathy; Proteomics; Proteostasis.


Conflict of interest statement

Conflict of Interest: The authors declare that they have no conflict of interest.

Figures

Fig. 1
Fig. 1. Quantification of changes in protein detection in SDS-insoluble fractions in brains of rTg4510 mice.
(a) Numbers of proteins that meet criteria for over-representation in SDS-insoluble fractions in rTg4510 mice at different stages of tauopathy, both with (shaded area) and without tau suppression via doxycycline. Data are presented as mean ± SD. *, p < 0.05; **, p < 0.01; ***, p<0.0001. Proteins were accepted if they achieved (i) at least a 3-fold increase in SDS-insoluble peptide spectra from nontransgenic to transgenic counterparts, (ii) when nontransgenic SDS-insoluble fractions yielded an average of <1 spectra for any given protein, the transgenic SDS-insoluble fraction contained at least 5 peptide spectra identified, and (iii) each individual protein in a given animal achieved G-test significance (p < 0.05). For doxycycline (DOX) treatment, the number shown within parentheses indicates the age (in months) at which the mice received doxycycline to suppress tau expression. Orange symbols were animals treated with DOX beginning at 4.5 months and the black symbols were animals that were treated with DOX beginning at 5.5 months of age, with all harvested at 7.0 months of age. n.s.; not significant. (b) Numbers of SDS-insoluble tau spectra corresponding to each animal analyzed. (a-b) Each data point symbol represents an individual animal with each symbol corresponding to the same animal analyzed in panel (a). (c) Venn diagram of the affected proteins that reach SAINT score threshold (≥0.9) in each individual age group of rTg4510 mice (Online Resource 2, Table S4). (d) Venn diagram of the overlap between rTg4510 and APPswe/PS1dE9 mice based upon LC-MS/MS analysis of SDS-insoluble proteins. The protein list was compiled based upon the lists of proteins generated in Online Resource 2, Table S4.
Fig. 2
Fig. 2. Immunoblot validations of LC-MS/MS data in rTg4510 mice.
(a) SDS-insoluble fractions were analyzed for rTg4510, nontransgenic littermate, and rTg21221 (wild-type) tau-expressing control mice and probed with antibodies for MDH1, PGAM1, ALDOC, UCHL1 and ENO1. 30 μL of the SDS-insoluble fractions (of the total ~300 μL volume) from the forebrains of rTg4510 or nontransgenic mice were separated on a 4–20% tris-glycine gel. DOX treated animals received the drug at 4.5 months of age (7.0 month group) or 5.5 months of age (9.5 month group). The spectral count data from the proteins analyzed by immunoblotting are provided in Online Resource 2, Table S6. (b) MDH1 immunoblot of PBS-soluble fractions of 7-month-old rTg4150 mice and nontransgenic controls. 5 μg of protein were loaded per well. Immunoblotting for SOD1 served as a loading control. All lanes in which samples were loaded are shown in each blot, with the blot cropped to include the relevant weight marker for each protein detected. (c) Quantification of MDH1 signal; data are presented as mean ± SD; n.s., not significant; A.U., arbitrary units.
Fig. 3
Fig. 3. Two-way clustering of spectral count data from SDS-insoluble fractions from rTg4510, rTg21221 and APPswe/PS1dE9 mice.
Clustering is based upon detergent-insoluble peptide spectra for 222 total proteins identified as affected in either rTg4510, rTg21221 or APPswe/PS1dE9 Line 85 (L85) mice. Red is indicative of the highest number of peptide spectra for a given protein relative to nontransgenic control mice, while blue is indicative of absence of the peptide in SDS-insoluble fractions, or absence of a difference between transgenic and nontransgenic samples. Figure generated using JMP Pro Statistical Discovery from SAS (version 13.0, Cary, NC, USA).
Fig. 4
Fig. 4. Comparison of spectral count data between rTg4510 and G93A-SOD1 mice.
(a-b) Average spectral counts of the 20 most affected proteins in either paralyzed G93A mice (a) or 7-month rTg4510 (b) mice relative to either mutant SOD1 or tau, demonstrating low levels of mutant SOD1 in the SDS-insoluble fractions of spinal cord from G93A SOD1 mice. The small black arrow marks the position for tau and SOD1 in each graph. (c) Venn diagram of the overlap between rTg4510, APPswe/PS1dE9 (L85), and G93A SOD1 mice based upon LC-MS/MS analysis of SDS-insoluble proteins. There were 91 proteins that were identified as enriched in SDS-insoluble fractions in G93A spinal cord by SAINT score analysis that were common between the three models.
Fig. 5
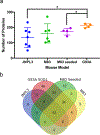
Fig. 5. Neurodegenerative models of spinal proteinopathy characterized by paralysis also induce impairments in proteome solubility.
(a) Numbers of proteins that abnormally shift to an insoluble state in JNPL3 (n = 7), homozygous M83 (n = 5), hemizygous M83 seeded (n = 4) and G93A SOD1 (n = 4). Graph displays the number of proteins in each model that were identified as over-represented in SDS-insoluble fractions of the transgenic animal relative to nontransgenic control mice. JNPL3 (all female), homozygous M83 (3 female, 2 male), hemizygous M83 seeded (2 male, 2 female) and G93A SOD1 (2 male, 2 female) mice were analyzed at end-stage phenotype (one or more limbs exhibiting paresis). The figure was generated using GraphPad Prism (version 7.0h). Significance was assessed by unpaired, two tailed T-test *, p < 0.01; **, p < 0.005. Data are presented as mean ± SD. (b) Venn diagram of the proteins that met criteria by SAINT score (0.9 threshold) as over-represented in SDS-insoluble fractions among all spinal models.
Fig. 6
Fig. 6. Analysis of cellular protein co-sedimentation with tau aggregates in mouse N2a cell models.
(a) Average DOC-insoluble spectral counts in the seeded N2a cells for a subset of proteins that were identified as aberrantly fractionating to SDS-insoluble fractions from the brains of rTg4510 mice. (b) Average PBS-soluble spectral counts for the same proteins displayed in panel (a), indicating the level of detectability of the proteins in PBS-soluble fractions. (c) Spectral count data for the small number of proteins that meet criteria for over-representation in DOC-insoluble fractions from N2a cells seeded for tau aggregation. Proteins were accepted if they (i) achieved at least a 3-fold increase in DOC-insoluble spectra from untransfected to tau seeded cells for at least 2 out of 3 experimental replicates and (ii) during instances where untransfected cells yielded 0 peptides for any given proteins, the tau seeded condition yielded a significant G-test (p < 0.05). (d) Venn Diagram comparing DOC-insoluble and PBS-soluble proteins from the N2a cells with the proteins identified as over-represented in SDS-insoluble fractions from either brain or spinal cord of rTg4510 and JNPL3 mice, respectively.
Fig. 7
Fig. 7. Bioinformatic analysis of protein classes that are statistically over-represented in SDS-insoluble fractions of proteinopathy models analyzed via LC-MS/MS.
Statistical over-representation tests (p < 0.05) with Bonferroni correction for multiple testing were conducted using the PANTHER (Protein ANalysis THrough Evolutionary Relationships) database (version 12.0). The graph was generated using Microsoft Excel (version 16.0). The protein list was compiled based upon the lists of proteins generated in Online Resource 2, Table S4.
Fig. 8
Fig. 8. Overlapping protein identifications between SDS-insoluble fractions from Tg4510 mice and previous proteomic studies of disease-associated pathological features.
Venn diagram demonstrating the number of proteins identified from previous studies listed in Online Resource 1 (Table S13). These prior studies used various techniques including laser capture microdissections of amyloid plaques and tau tangles (LCM), affinity capture with antibodies to tau, Aβ−42, or synthetic β-structure proteins (IP), isolation of detergent-insoluble proteins from transgenic mouse and human disease tissue (Detergent-Insoluble), and density gradient (Other) methodologies.

Similar articles

Cited by

References

    1. Ayyadevara S, Balasubramaniam M, Parcon PA, Barger SW, Griffin WST, Alla R, Tackett AJ, Mackintosh SG, Petricoin E, Zhou W, Shmookler Reis RJ (2016) Proteins that mediate protein aggregation and cytotoxicity distinguish Alzheimer’s hippocampus from normal controls. Aging Cell 15:924–939. doi: 10.1111/acel.12501 - DOI - PMC - PubMed
    1. Babu JR, Geetha T, Wooten MW (2005) Sequestosome 1/p62 shuttles polyubiquitinated tau for proteasomal degradation. J Neurochem 94:192–203. doi: 10.1111/j.1471-4159.2005.03181.x - DOI - PubMed
    1. Bai B, Hales CM, Chen P, Gozal Y, Dammer EB, Fritz JJ (2013) U1 small nuclear ribonucleoprotein complex and RNA splicing alterations in Alzheimer ‘ s disease. Proc Natl Acad Sci U S A 110:16562–16567. doi: 10.1073/pnas.1310249110/-/DCSupplemental.www.pnas.org/cgi/doi/10.1073/pnas.1310249110 - DOI - PMC - PubMed
    1. Bailey RM, Covy JP, Melrose HL, Rousseau L, Watkinson R, Knight J, Miles S, Farrer MJ, Dickson DW, Giasson BI, Lewis J (2013) LRRK2 phosphorylates novel tau epitopes and promotes tauopathy. Acta Neuropathol 126:809–827. doi: 10.1007/s00401-013-1188-4 - DOI - PMC - PubMed
    1. Balch WE, Morimoto RI, Dillin A, Kelly, Jeffery W (2008) Adapting Proteostasis for Disease Intervention. Science (80- ) 319:916–919. doi: 10.1126/science.1141448 - DOI - PubMed

Publication types

MeSH terms