. 2018 Jul;50(7):1011-1020.
doi: 10.1038/s41588-018-0140-x. Epub 2018 Jun 4.

The transcription factor Grainy head primes epithelial enhancers for spatiotemporal activation by displacing nucleosomes

Affiliations

The transcription factor Grainy head primes epithelial enhancers for spatiotemporal activation by displacing nucleosomes

Jelle Jacobs et al. Nat Genet. 2018 Jul.

Abstract

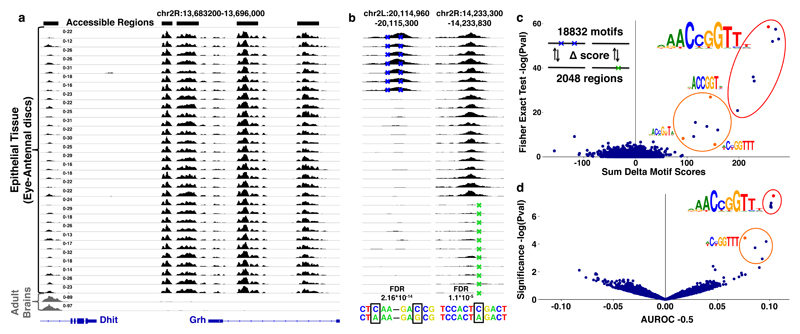
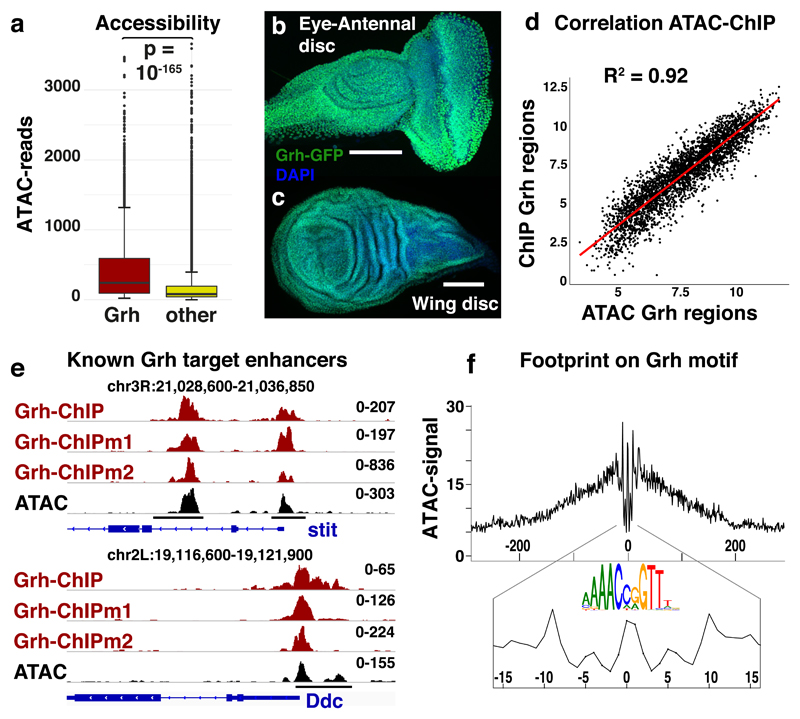
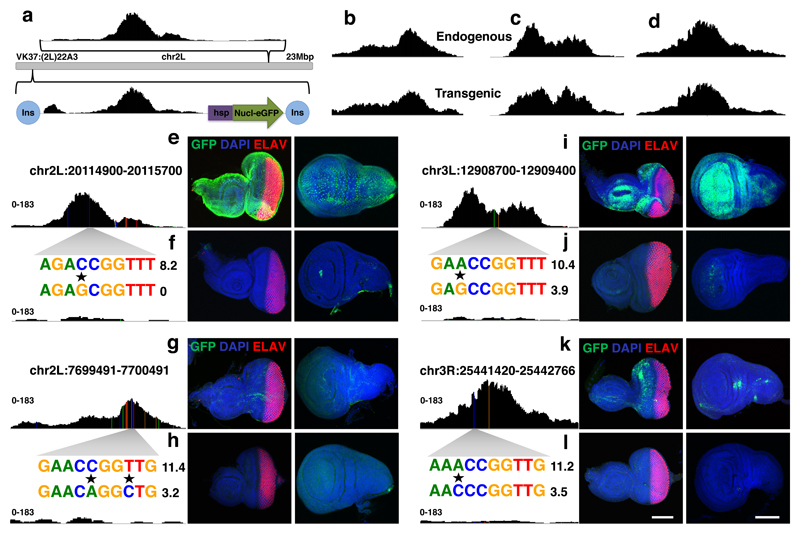
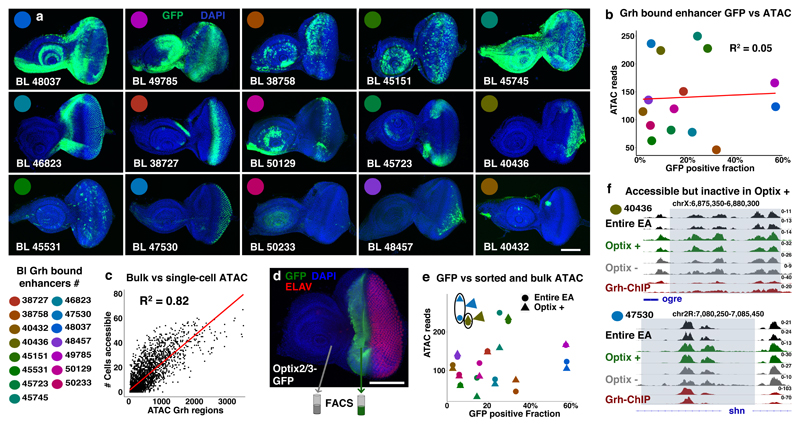
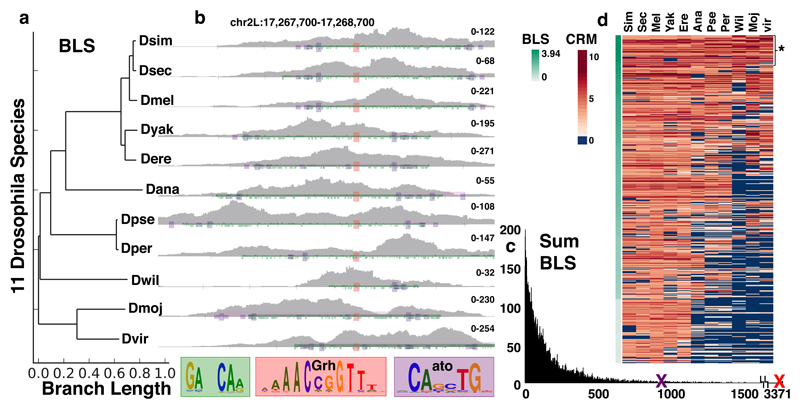
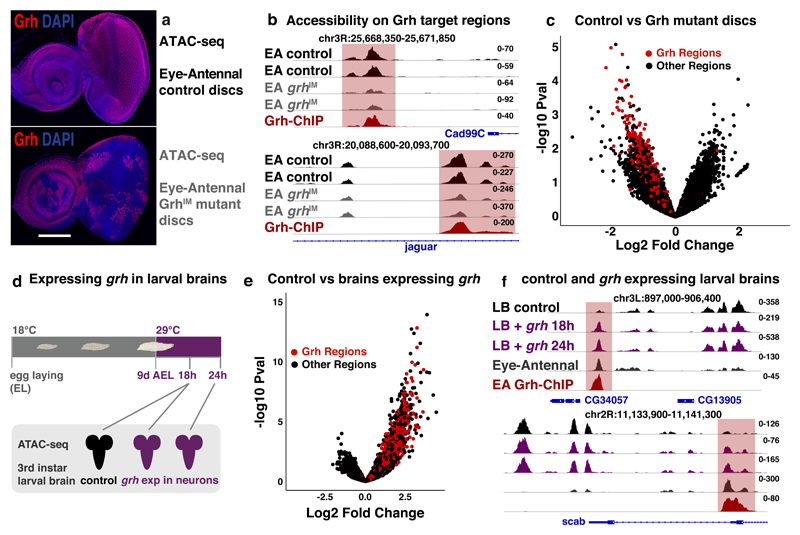
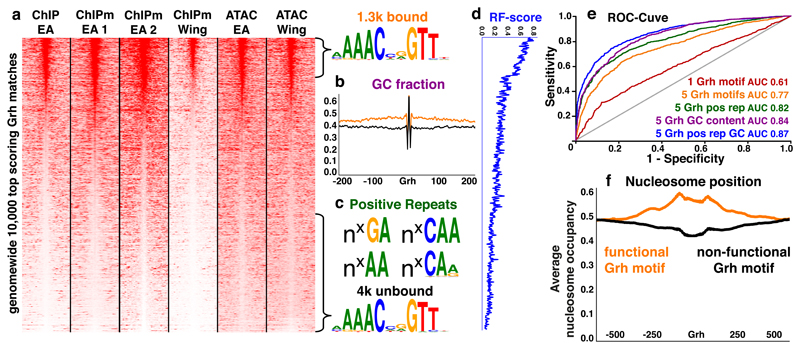
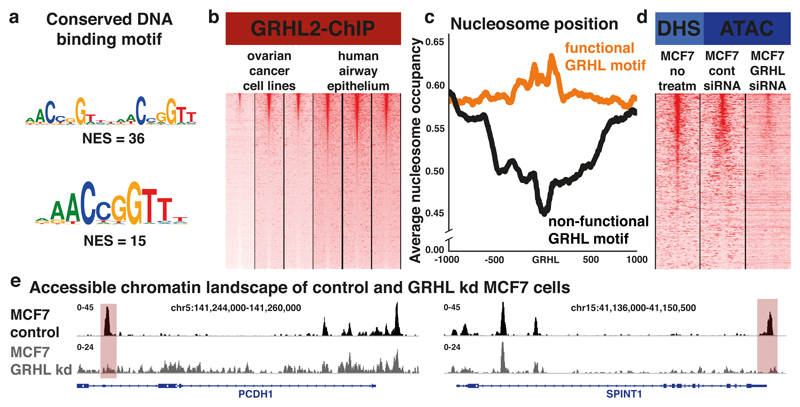
Transcriptional enhancers function as docking platforms for combinations of transcription factors (TFs) to control gene expression. How enhancer sequences determine nucleosome occupancy, TF recruitment and transcriptional activation in vivo remains unclear. Using ATAC-seq across a panel of Drosophila inbred strains, we found that SNPs affecting binding sites of the TF Grainy head (Grh) causally determine the accessibility of epithelial enhancers. We show that deletion and ectopic expression of Grh cause loss and gain of DNA accessibility, respectively. However, although Grh binding is necessary for enhancer accessibility, it is insufficient to activate enhancers. Finally, we show that human Grh homologs-GRHL1, GRHL2 and GRHL3-function similarly. We conclude that Grh binding is necessary and sufficient for the opening of epithelial enhancers but not for their activation. Our data support a model positing that complex spatiotemporal expression patterns are controlled by regulatory hierarchies in which pioneer factors, such as Grh, establish tissue-specific accessible chromatin landscapes upon which other factors can act.


Conflict of interest statement

Competing financial interests Statement

The authors have no competing interests as defined by Nature Research, or other interests that might be perceived to influence the results and/or discussion reported in this paper.

Figures

Figure 1
Figure 1. Variation in chromatin accessibility across Drosophila inbred lines.
(a) Accessible chromatin profiles obtained by ATAC-seq on 32 independent tissue samples. The first 30 profiles are from epithelial tissues (eye-antennal discs), the last two from adult brains. (b) Example of two regions with caQTLs: the first has two caQTLs; chr2L:g.20115168G>C and chr2L:g.20115092A>C that correlate with a gain in accessibility (FDR = 2.16*10-14), in the second region the caQTL chr2R:g.14233638C>A significantly correlates with a loss in accessibility (FDR = 1.1*10-5) (see Methods). (c) Delta Motif plot, showing the cumulative effect of the 4289 caQTLs on the CRM score of 18832 motifs, plotted on the x-axis (see Methods). The y-axis shows the enrichment of motifs affected by caQTLs compared to control SNPs (one-sided Fisher’s exact test (log transformed)). Significantly enriched motifs are encircled and examples (red or orange) are visualized. (d) AUROC plot, showing the AUROC statistics for motif matching (18832 motifs) between the 2048 accessible and inaccessible sequences. On the x-axis are the AUROC -0.5 values plotted for each motif. The y-axis shows the significance (log transformed pval). Significantly enriched motifs are encircled and examples (red or orange) are visualized.
Figure 2
Figure 2. Grainyhead plays a key role in the epithelial chromatin landscape.
(a) Box-and-whisker plots visualizing the normalized reads for accessible regions containing a Grh motif (n=3246) and all others accessible regions (n=27528). The median (centre lines), 25th and 75th percentiles (box edges), data points within 1.5 times the interquartile range from the edge (whiskers) and outliers (data points) are shown. The Welch two sample t-test (two-sided) was used to evaluate the difference (pval = 2.251*10-166). (b-c) Grh-GFP protein expression in eye-antennal and wing imaginal discs, using a chimeric Grh-GFP fusion line (reproducible GFP pattern in at least 5 discs, scale bar = 100μm) (d) Correlation plot between the accessibility (ATAC) and Grainyhead occupancy (ChIP(mentation)) of the 3246 Grh target regions (Spearman’s ρ = 0.919). (e) Tracks of Grh-ChIP-seq, Grh-ChIPmentation-seq and ATAC-seq in eye-antennal discs. Grh dependent enhancers (black bars), that control the expression of stit (chr3R:21028800-21037000) and Ddc (chr2L:19116600-19121750) upon wounding, are shown. (f) DNA footprint on the Grh motif; the averaged ATAC-seq signal over all 3246 accessible Grh regions, centred on their Grh motif, is shown.
Figure 3
Figure 3. Activity of Grainyhead enhancers in imaginal discs.
(a) Stable insertion of pairs of cloned region into the genome using the VK37 integration site on chromosome 2L. (a-d) Peak height and shape of each region in their endogenous locus and after genomic insertion into the VK37 integration site, the ATAC-seq experiments were done once for each line. (e-l). GFP-expression (green) driven by the four tested enhancer pairs in eye and wing discs, differentiated photoreceptors are stained by ELAV (red) and nuclei are marked by DAPI (blue) (reproducible GFP pattern in at least 3 discs, scale bar = 100μm). Variable accessibility of the endogenous regions is shown, the accessible ones are each time presented at the top (e,g,i,k), while the inaccessible counterparts are presented underneath (f,h,j,l), the ATAC-seq experiments were done once for each line. A zoom in of the affected sequence is shown (caQTLs are marked by a star) together with the Grh PWM affinity score.
Figure 4
Figure 4. Accessibility of Grainyhead enhancers does not imply activity.
(a) Confocal images showing the activity (GFP, green) of 15 Grh bound Janelia-Gal4 enhancers in the eye-antennal discs (reproducible GFP pattern in at least 4 discs per shown image, scale bar = 100μm). (b) Plot visualizing the relative activity (GFP% of encompassing eye-antennal disc) and accessibility (ATAC-seq averaged over 30 independent eye-antennal disc samples) of the 15 Grh bound enhancers. (c) Correlation plot showing the accessibility of the 3246 Grainyhead regions (normalized ATAC-reads) on the x-axis versus the actual number of single cells where the region is accessible (Spearman’s ρ = 0.82). (d) Confocal image showing the reproducible (5 discs, scale bar = 100μm) expression pattern of the Optix2/3 enhancer (GFP, green; cell nuclei DAPI, blue; and differentiated photoreceptors (ELAV, red)) in the eye-antennal disc. (e) Plot visualizing the relative activity (GFP%) and accessibility (ATAC-seq, circle: entire eye-antennal discs, triangle: Optix positive subpopulation) of the 15 Grh bound enhancers. (f) Accessible chromatin and Grh-ChIP profiles of two Grh bound enhancers, 40436 and 47530, both are accessible in the Optix positive subpopulation, but show no activity there (2 biological replicates for each sample).
Figure 5
Figure 5. Identification of co-regulator motifs through evolutionary conservation.
(a) Branch Length Scores for the 11 Drosophila species. (b) ATAC signal from eye-antennal discs of 11 Drosophila species on a conserved Grh-Atonal enhancer (two eye-antennal disc ATAC-seq replicates per specie). The Grh motifs are shown in red, Atonal in purple and repeats in green. (c) Histogram of the cumulative Branch Length Scores for the 18k motifs. The top Grh motif (red X) has a score of 3371, the top Atonal motif (purple X) has a score of 878. (d) Heatmap showing the CRM scores for the Atonal motif across the conserved Grh enhancers ordered by BLS score. The top 480 enhancers are shown, with the 92 most conserved Grh-Ato enhancers (BLS > 3) marked by *.
Figure 6
Figure 6. The pioneering role of Grh.
(a) Confocal images of control (top) and discs largely mutant for Grh (bottom), Grh C-terminal antibody staining (red), nuclei DAPI (blue) (reproducible results for 5 discs, scale bar = 100μm). (b) Tracks visualizing ATAC of control (black) and Grh mutant (grey) eye-antennal disc and Grh-ChIP (dark-red) in eye-antennal disc (2 biological replicates each). Grh target regions near epithelial genes Cad99C and jar lose accessibility. (c) Volcano plot showing the change in accessibility (DESeq2 log2FC and –log10 pval) of the 30774 regions in control versus Grh mutant eye-antennal discs, red dots mark the 3246 Grh regions. (d) Ectopic grh expression in the neurons of developing larvae. (e) Volcano plot showing the change in accessibility (DESeq2 log2FC and –log10 pval) of 37668 accessible regions in control larval brains versus larval brain with ectopic grh expression, red dots mark the 3246 Grh regions. (f) Tracks visualizing ATAC on control larval brains (black), larval brains with 18 and 24h grh expression (purple) (ATAC-seq experiments were done once for each time point) and eye-antennal discs (dark grey, 30 biological replicates), and Grh-ChIP on eye-antennal discs (dark-red, 3 biological replicates). Genomic loci near CG34057 and scab are shown with Grh target region (red).
Figure 7
Figure 7. Discovery of additional sequence features instructive for the in vivo binding of Grainyhead.
(a) Seqminer plots visualising the Grh-ChIP(mentation) and ATAC-seq signals on the 10k highest scoring Grh binding sites genome wide (ranked using order statistics see Methods). Similar de novo Grh motifs were found on the top 1300 bound regions and bottom 4000 unbound regions. (b) Average GC fraction of the 1300 bound regions and 4000 unbound regions, showing 200 bp up and downstream of the Grh motif. (c) Repeat sequences of variable length (n) enriched around (±300bp) the 1300 functional Grh motifs. (d) Random Forest score for the encompassing Grh regions (smoothed over 15 regions). (e) Receiver Operating Characteristic curves assessing the performance of a Random Forest classifier to discriminate between 1300 Grh bound and 4000 unbound sequences. (f) Predicted nucleosome affinity for the 1300 functional (orange) and 4000 non-functional (black) Grh regions.
Figure 8
Figure 8. Human GRHLs have similar properties as their Drosophila homolog.
(a) Top enriched motifs found in the GRHL2-ChIP peaks. (b) Seqminer plots visualizing the GRHL2-ChIP signal of six ChIP experiments on OVCAR3, OVCA429, PEO1 and airway epithelium d29, d36 and d44 respectively, regions are ordered using a ChIP-meta-analysis (see Methods). (c) Predicted nucleosome preference of regions with functional GRHL motifs (red) and regions with non-functional GRHL motifs (black), centred on the GRHL motif. (d) Seqminer plots visualizing the accessible chromatin of MCF7 on the GRHL bound regions, public DHS data on non-treated cells, omni-ATAC on MCF7 cells 48h after non-targeting siRNAs, omni-ATAC on MCF7 cells 48h after mix of GRHL targeting siRNAs. (e) Omni-ATAC-seq tracks of the MCF7 cell line, control (black) and 48h after treatment with GRHL targeting shRNAs (Grey) (Omni-ATAC-seq experiments were done once for each sample). Predicted GRHL target regions (red) near two epithelial genes, PCDH1 and SPINT1 are shown.

Similar articles

Cited by

References

    1. Bernstein BE, et al. The NIH Roadmap Epigenomics Mapping Consortium. Nat Biotechnol. 2010;28:1045–1048. - PMC - PubMed
    1. ENCODE Project Consortium. The ENCODE (ENCyclopedia Of DNA Elements) Project. Science. 2004;306:636–640. - PubMed
    1. Yue F, et al. A comparative encyclopedia of DNA elements in the mouse genome. Nature. 2014;515:355–364. - PMC - PubMed
    1. Robertson G, et al. Genome-wide profiles of STAT1 DNA association using chromatin immunoprecipitation and massively parallel sequencing. Nat Methods. 2007;4:651–657. - PubMed
    1. Song L, Crawford GE. DNase-seq: a high-resolution technique for mapping active gene regulatory elements across the genome from mammalian cells. Cold Spring Harb Protoc. 2010;2010 pdb.prot5384. - PMC - PubMed

Publication types