. 2018 Apr 10;11(525):eaao5775.
doi: 10.1126/scisignal.aao5775.

mTORC1 controls lysosomal Ca2+ release through the two-pore channel TPC2

Affiliations

mTORC1 controls lysosomal Ca2+ release through the two-pore channel TPC2

Oluseye A Ogunbayo et al. Sci Signal. .

Abstract

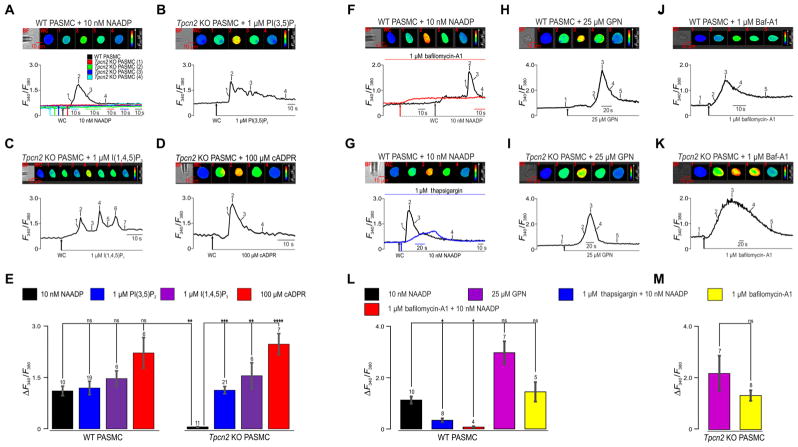
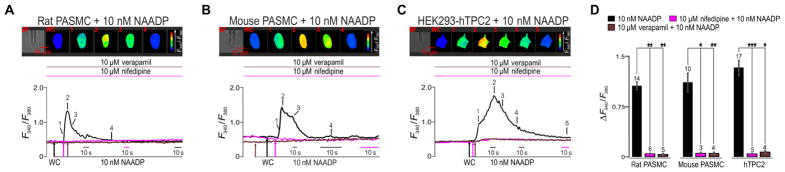
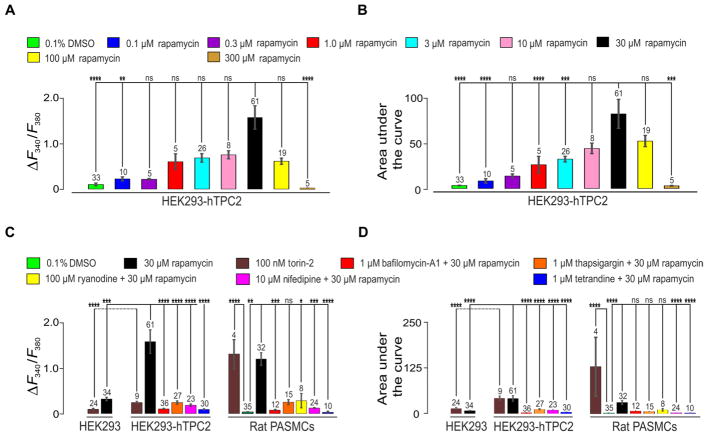
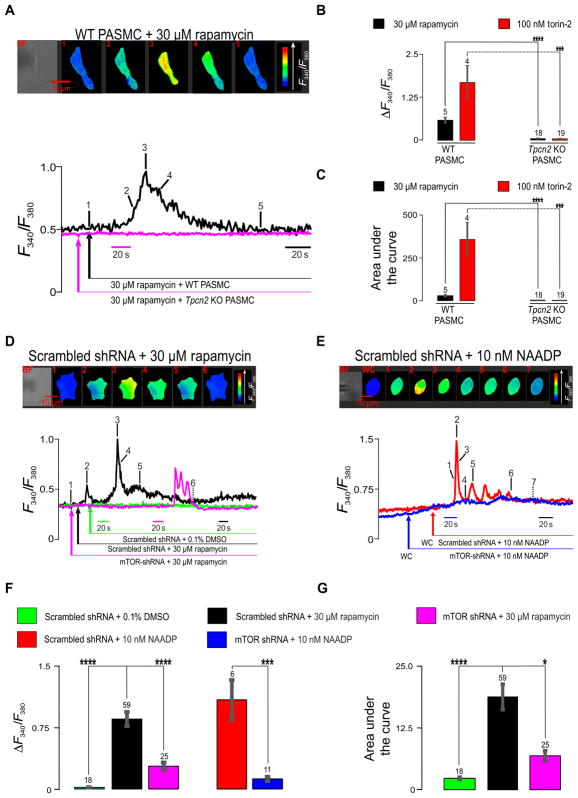
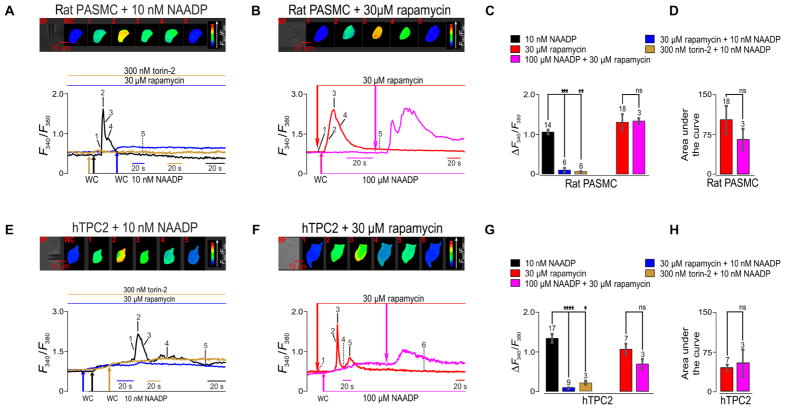
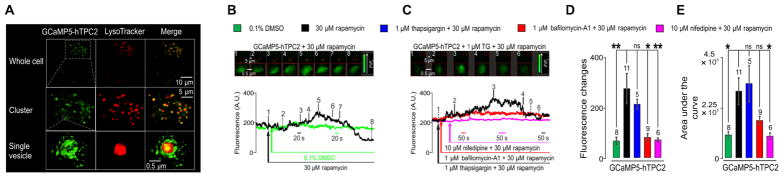
Two-pore segment channel 2 (TPC2) is a ubiquitously expressed, lysosomally targeted ion channel that aids in terminating autophagy and is inhibited upon its association with mechanistic target of rapamycin (mTOR). It is controversial whether TPC2 mediates lysosomal Ca2+ release or selectively conducts Na+ and whether the binding of nicotinic acid adenine dinucleotide phosphate (NAADP) or phosphatidylinositol 3,5-bisphosphate [PI(3,5)P2] is required for the activity of this ion channel. We show that TPC2 is required for intracellular Ca2+ signaling in response to NAADP or to mTOR inhibition by rapamycin. In pulmonary arterial myocytes, rapamycin and NAADP evoked global Ca2+ transients that were blocked by depletion of lysosomal Ca2+ stores. Preincubation of cells with high concentrations of rapamycin resulted in desensitization and blocked NAADP-evoked Ca2+ signals. Moreover, rapamycin and NAADP did not evoke discernable Ca2+ transients in myocytes derived from Tpcn2 knockout mice, which showed normal responses to other Ca2+-mobilizing signals. In HEK293 cells stably overexpressing human TPC2, shRNA-mediated knockdown of mTOR blocked rapamycin- and NAADP-evoked Ca2+ signals. Confocal imaging of a genetically encoded Ca2+ indicator fused to TPC2 demonstrated that rapamycin-evoked Ca2+ signals localized to lysosomes and were in close proximity to TPC2. Therefore, inactivation of mTOR may activate TPC2 and consequently lysosomal Ca2+ release.


Conflict of interest statement

Competing interests: The authors declare that they have no competing interests.

Figures

Fig. 1
Fig. 1. Deletion of TPC2 in pulmonary arterial myocytes blocks Ca2+ transients evoked by NAADP but not those triggered by PI(3,5)P2, I(1,4,5)P3, or cADPR
(A) Upper panels show a bright-field (BF) image of an acutely isolated mouse pulmonary arterial smooth muscle cell (PASMC) and a series of pseudocolor images of the Fura-2 fluorescence ratio (F340/F380) recorded in the same cell during intracellular dialysis from a patch pipette of 10 nM nicotinic acid adenine dinucleotide phosphate (NAADP). Lower panel shows corresponding record (black) of F340/F380 ratio against time; the time points at which pseudocolor images were acquired are indicated by the numbered lines. WC indicates the beginning of intracellular dialysis upon entering the whole-cell configuration. The red, blue, cyan, and green records show the effect of NAADP in myocytes from Tpcn2 knockout (KO) mice. WT, wild-type. (B to D) As in (A) but showing responses of myocytes from Tpcn2 knockout mice to intracellular dialysis of phosphatidylinositol 3,5-bisphosphate [PI(3,5)P2] (B), inositol 1,4,5-trisphosphate [I(1,4,5)P3] (C), or cyclic adenosine 5′-diphosphoribose (cADPR) (D). (E) Bar chart shows the mean ± SEM for each stimulus across all cells studied [number of cells (n) indicated above bars]. ns, not significant; **P < 0.01, ***P < 0.001, ****P < 0.0001. (F) Upper panel shows a bright-field image of a PASMC acutely isolated from a WT mouse and a series of pseudocolor images of the Fura-2 fluorescence ratio (F340/F380) recorded in the same cell during intracellular dialysis from a patch pipette of 10 nM NAADP. Lower panel shows corresponding record (black) of F340/F380 ratio against time; the time points at which pseudocolor images were acquired are indicated by the numbered lines. WC indicates the beginning of intracellular dialysis upon entering the whole-cell configuration. Red record shows the effect of NAADP after preincubation (≥50 min) of a myocyte with 1 μM bafilomycin-A1 (Baf-A1). (G) As in (F) but with a blue record that shows the effect of NAADP in a different cell after preincubation with the SR Ca2+ adenosine triphosphatase inhibitor thapsigargin (1 μM; ≥40 min). (H) Response of a WT mouse PASMC to extracellular application of 25 μM glycyl-L-phenylalanine-2-naphthylamide (GPN). (I) As in (H) but showing the response of a myocyte from a Tpcn2 knockout mouse. (J and K) As in (H) and (I) but showing responses to 1 μM bafilomycin-A1. (L and M) Bar charts show the mean ± SEM [number of cells (n) indicated above bars] for the experiments shown in (F), (G), (H), and (J) for WT (L) and (I) and (K) for Tpcn2 KO mice (M). *P < 0.05.
Fig. 2
Fig. 2. Nifedipine and verapamil block NAADP-evoked Ca2+ transients
(A) Upper panels show a bright-field image of an acutely isolated rat PASMC and a series of pseudocolor images of the Fura-2 fluorescence ratio (F340/F380) recorded in the same cell during intracellular dialysis from a patch pipette of 10 nM NAADP. Lower panel shows corresponding record (black) of F340/F380 ratio against time; the time points at which pseudocolor images were acquired are indicated by the numbered lines. WC indicates the beginning of intracellular dialysis upon entering the whole-cell configuration. The magenta and brown records show the effect of NAADP in myocytes preincubated with 10 μM nifedipine and 10 μM verapamil, respectively. (B) As in (A) but for an acutely isolated WT mouse PASMC. (C) As in (A) but for a human embryonic kidney (HEK) 293 cell stably overexpressing hTPC2. (D) Bar chart shows the mean ± SEM for each stimulus across all cells studied [number of cells (n) indicated above bars]. *P < 0.05, **P < 0.01, ***P < 0.001.
Fig. 3
Fig. 3. Rapamycin induces Ca2+ transients in pulmonary arterial myocytes and hTPC2-expressing HEK293 cells that are blocked by bafilomycin-A1 and nifedipine
(A to H) Example records (black) showing the concentration-response relationship as changes in Fura-2 fluorescence ratio (F340/F380) against time during extracellular application of indicated concentrations of rapamycin (0.1 to 300 μM) onto different HEK293 cells that stably expressed human TPC2. (I) Upper panel shows a bright-field image of a HEK293 cell stably overexpressing hTPC2 and a series of pseudocolor images of F340/F380 recorded in the same cell during extracellular application of 30 μM rapamycin. Lower panel shows corresponding record (black) of F340/F380 ratio against time; the time points at which pseudocolor images were acquired are indicated by the numbered lines. Green record shows the effect of dimethyl sulfoxide (DMSO) (vehicle control) in a different cell, and a cyan record shows the effect of rapamycin on a WT HEK293 cell. (J) As in (I) but with a red record showing the effect of rapamycin after preincubation (≥50 min) of an hTPC2-expressing HEK293 cell with 1 μM bafilomycin-A1. (K) As in (I) but with an orange record showing the effect of rapamycin after preincubation (≥50 min) of a cell with 1 μM thapsigargin. (L) As in (I) but with a magenta record showing the effect of rapamycin after preincubation (≥50 min) of a cell with 10 μM nifedipine. (M to P) As in (I) to (L) but for acutely isolated rat pulmonary arterial myocytes, except that (O) shows an additional record in gold of the effect of rapamycin after preincubation (≥50 min) of a myocyte with 100 μM ryanodine.
Fig. 4
Fig. 4. Comparison of the effects of rapamycin and torin-2 in pulmonary arterial smooth muscle cells acutely isolated from rats or mice, WT HEK293 cells and HEK293 cells stably overexpressing hTPC2
(A) Bar chart showing the concentration-response relationship (mean ± SEM) for the peak change in Fura-2 fluorescence ratio (ΔF340/F380) during extracellular application of rapamycin onto HEK293 cells that stably expressed hTPC2. (B) As in (A) but for area under the curve. (C) Bar chart compares the mean ± SEM for the peak change in Fura-2 fluorescence ratio during extracellular application of rapamycin onto WT HEK293 cells, HEK293 cells that stably expressed hTPC2 and pulmonary arterial myocytes under all conditions studied (see key). (D) As in (C) but for area under the curve [number of cells (n) indicated above bars]. *P < 0.05, **P < 0.01, ***P < 0.001, ****P < 0.0001.
Fig. 5
Fig. 5. Ca2+ transients induced by mTOR inhibitors in pulmonary arterial myocytes are blocked by deletion of TPC2 and by shRNA knockdown of mTOR
(A) Upper panel shows a bright-field image of a WT mouse PASMC and a series of pseudocolor images of the Fura-2 fluorescence ratio (F340/F380) recorded in the same cell during extracellular application of 30 μM rapamycin. Lower panel shows corresponding record (black) of F340/F380 ratio against time; the time points at which pseudocolor images were acquired are indicated by the numbered lines. Pink record shows the response to 30 μM rapamycin of a myocyte isolated from a Tpcn2 knockout (Tpcn2 KO) mouse. (B and C) Bar charts show the mean ± SEM [number of cells (n) indicated above bars] for the peak change in F340/F380 during the first transient recorded (B) and the area under the curve during the response of each cell to rapamycin and torin-2 (C). ***P < 0.001, ****P < 0.0001. (D) Upper panel shows a bright-field image of a HEK293 cell overexpressing hTPC2 48 hours after transfection of scrambled short hairpin RNA (shRNA) and a series of pseudocolor images of the Fura-2 fluorescence ratio (F340/F380) recorded in the same cell during extracellular application of 30 μM rapamycin. Lower panel shows corresponding record (black) of F340/F380 ratio against time; the time points at which pseudocolor images were acquired are indicated by the numbered lines. Green and pink records show the response to DMSO and 30 μM rapamycin, respectively, of two different hTPC2-expressing HEK293 cells that were transfected with shRNA against mechanistic target of rapamycin (mTOR). (E) As in (D) but for different cells during intracellular dialysis with 10 nM NAADP, as performed in Fig. 1; red record for a cell 48 hours after transfection of scrambled shRNA and blue record for a cell transfected with shRNA against mTOR. (F and G) Bar chart shows the mean ± SEM [number of cells (n) indicated above bars] for the experiments shown in (D) and (E), for the peak change in F340/F380 ratio induced by NAADP and the peak change attained during the first transient recorded after rapamycin (C) and the area under the curve during the response to rapamycin (D). *P < 0.05, ***P < 0.001, ****P < 0.0001.
Fig. 6
Fig. 6. Ca2+ transients evoked by mTOR inhibition and NAADP exhibit cross-desensitization in pulmonary arterial myocytes and hTPC2-expressing HEK293 cells
(A) Upper panel shows a bright-field image of a rat PASMC and a series of pseudocolor images of the Fura-2 fluorescence ratio (F340/F380) recorded in the same cell during intracellular dialysis of 10 nM NAADP. Lower panel shows corresponding record (black) of F340/F380 ratio against time; the time points at which pseudocolor images were acquired are indicated by the numbered lines. WC indicates the beginning of intracellular dialysis upon entering the whole-cell configuration. Blue and brown records show, respectively, the response to 10 nM NAADP of myocytes preincubated (30 min) with 30 μM rapamycin or 300 nM torin-2. (B) As in (A) but for rapamycin in the absence of (red) and 2 min after intracellular dialysis of 100 μM NAADP (pink). (C and D) Bar charts show the mean ± SEM for the experiments shown in (A) and (B) for the peak change induced by 10 nM NAADP and the peak change attained during the first transient recorded after 30 μM rapamycin (C) and the area under the curve during the response to rapamycin (D). (E to H) As in (A) to (D) but for HEK293 cells stably overexpressing hTPC2 [number of cells (n) indicated above bars]. *P < 0.05, **P < 0.01, ***P < 0.001, ****P < 0.0001.
Fig. 7
Fig. 7. Rapamycin induces bafilomycin- and nifedipine-sensitive Ca2+ signals proximal to lysosomes in HEK293 cells that stably overexpress GCaMP5-TPC2
(A) Deconvolved confocal images show a three-dimensional reconstruction (from left to right) of a single HEK293 cell stably expressing GCaMP5-hTPC2 (green), the distribution of LysoTracker-Red (red) labeling within the same cell, and a merged image depicting regions of colocalization (yellow). (B) Upper panels show confocal images of a HEK293 cell overexpressing GCaMP5-hTPC2 (green) during extracellular application of 30 μM rapamycin. Lower panel shows corresponding record (black) of F/F0 ratio against time; the time points at which confocal images were acquired are indicated by the numbered lines. Green record shows the effect of DMSO (vehicle control) in a different cell. (C) As in (B) but showing the response of different cells to 30 μM rapamycin after preincubation with 1 μM thapsigargin (black), 1 μM bafilomycin-A1 (red), and 10 μM nifedipine (pink). (D and E) Bar charts show the mean ± SEM for the peak change in F/F0 (D) and the area under the curve during the response to rapamycin (E) [number of cells (n) indicated above bars]. *P < 0.05, **P < 0.01. A.U., arbitrary units; TG, thapsigargin.

Similar articles

Cited by

  • Guidelines for the use and interpretation of assays for monitoring autophagy (4th edition)1.
    Klionsky DJ, Abdel-Aziz AK, Abdelfatah S, Abdellatif M, Abdoli A, Abel S, Abeliovich H, Abildgaard MH, Abudu YP, Acevedo-Arozena A, Adamopoulos IE, Adeli K, Adolph TE, Adornetto A, Aflaki E, Agam G, Agarwal A, Aggarwal BB, Agnello M, Agostinis P, Agrewala JN, Agrotis A, Aguilar PV, Ahmad ST, Ahmed ZM, Ahumada-Castro U, Aits S, Aizawa S, Akkoc Y, Akoumianaki T, Akpinar HA, Al-Abd AM, Al-Akra L, Al-Gharaibeh A, Alaoui-Jamali MA, Alberti S, Alcocer-Gómez E, Alessandri C, Ali M, Alim Al-Bari MA, Aliwaini S, Alizadeh J, Almacellas E, Almasan A, Alonso A, Alonso GD, Altan-Bonnet N, Altieri DC, Álvarez ÉMC, Alves S, Alves da Costa C, Alzaharna MM, Amadio M, Amantini C, Amaral C, Ambrosio S, Amer AO, Ammanathan V, An Z, Andersen SU, Andrabi SA, Andrade-Silva M, Andres AM, Angelini S, Ann D, Anozie UC, Ansari MY, Antas P, Antebi A, Antón Z, Anwar T, Apetoh L, Apostolova N, Araki T, Araki Y, Arasaki K, Araújo WL, Araya J, Arden C, Arévalo MA, Arguelles S, Arias E, Arikkath J, Arimoto H, Ariosa AR, Armstrong-James D, Arnauné-Pelloquin L, Aroca A, Arroyo DS, Arsov I, Artero R, Asaro DML, Aschner M, Ashrafizadeh M, Ashur-Fabian O, Atanasov AG, Au AK, Auberger P, Auner HW, Aurelian L, Autelli R… See abstract for full author list ➔ Klionsky DJ, et al. Autophagy. 2021 Jan;17(1):1-382. doi: 10.1080/15548627.2020.1797280. Epub 2021 Feb 8. Autophagy. 2021. PMID: 33634751 Free PMC article.
  • On a Magical Mystery Tour with 8-Bromo-Cyclic ADP-Ribose: From All-or-None Block to Nanojunctions and the Cell-Wide Web.
    Evans AM. Evans AM. Molecules. 2020 Oct 16;25(20):4768. doi: 10.3390/molecules25204768. Molecules. 2020. PMID: 33081414 Free PMC article. Review.
  • The role of autophagy in the progression of HIV infected cardiomyopathy.
    Sun Y, Xu M, Duan Q, Bryant JL, Xu X. Sun Y, et al. Front Cell Dev Biol. 2024 Jul 17;12:1372573. doi: 10.3389/fcell.2024.1372573. eCollection 2024. Front Cell Dev Biol. 2024. PMID: 39086659 Free PMC article. Review.
  • Membrane transport proteins in melanosomes: Regulation of ions for pigmentation.
    Wiriyasermkul P, Moriyama S, Nagamori S. Wiriyasermkul P, et al. Biochim Biophys Acta Biomembr. 2020 Dec 1;1862(12):183318. doi: 10.1016/j.bbamem.2020.183318. Epub 2020 Apr 22. Biochim Biophys Acta Biomembr. 2020. PMID: 32333855 Free PMC article. Review.
  • mTORC1 and SGLT2 Inhibitors-A Therapeutic Perspective for Diabetic Cardiomyopathy.
    Saha S, Fang X, Green CD, Das A. Saha S, et al. Int J Mol Sci. 2023 Oct 11;24(20):15078. doi: 10.3390/ijms242015078. Int J Mol Sci. 2023. PMID: 37894760 Free PMC article. Review.

References

    1. Ishibashi K, Suzuki M, Imai M. Molecular cloning of a novel form (two-repeat) protein related to voltage-gated sodium and calcium channels. Biochem Biophys Res Commun. 2000;270:370–376. - PubMed
    1. Calcraft PJ, Ruas M, Pan Z, Cheng X, Arredouani A, Hao X, Tang J, Rietdorf K, Teboul L, Chuang K-T, Lin P, Xiao R, Wang C, Zhu Y, Lin Y, Wyatt CN, Parrington J, Ma J, Evans AM, Galione A, Zhu MX. NAADP mobilizes calcium from acidic organelles through two-pore channels. Nature. 2009;459:596–600. - PMC - PubMed
    1. Calcraft P, Ogunbayo O, Ma J, Galione A, Churchill GC, Zhu MX, Evans AM. Does nicotinic acid adenine dinucletoide phosphate elicit Ca2+ release via two-pore channel 2 in rat pulmonary arterial smooth muscle cells. Proc Physiol Soc. 2008;13:PC18.
    1. Schieder M, Rötzer K, Brüggemann A, Biel M, Wahl-Schott CA. Characterization of two-pore channel 2 (TPCN2)-mediated Ca2+ currents in isolated lysosomes. J Biol Chem. 2010;285:21219–21222. - PMC - PubMed
    1. Pitt SJ, Funnell TM, Sitsapesan M, Venturi E, Rietdorf K, Ruas M, Ganesan A, Gosain R, Churchill GC, Zhu MX, Parrington J, Galione A, Sitsapesan R. TPC2 is a novel NAADP-sensitive Ca2+ release channel operating as a dual sensor of luminal pH and Ca2+ J Biol Chem. 2010;285:35039–35046. - PMC - PubMed

Publication types

MeSH terms

LinkOut - more resources