

Role of Kidney Biopsies for Biomarker Discovery in Diabetic Kidney Disease
- PMID: 29580583
- PMCID: PMC5875458
- DOI: 10.1053/j.ackd.2017.11.004
Role of Kidney Biopsies for Biomarker Discovery in Diabetic Kidney Disease
Abstract
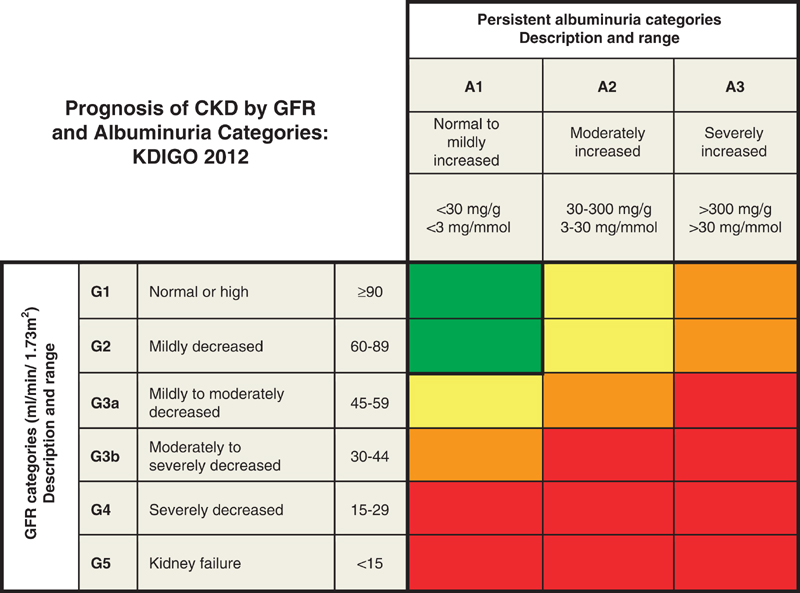
Although estimated glomerular filtration rate and albuminuria are well-established biomarkers of diabetic kidney disease (DKD), additional biomarkers are needed, especially for the early stages of the disease when both albuminuria and estimated glomerular filtration rate may still be in the normal range and are less helpful for identifying those at risk of progression. Traditional biomarker studies for early DKD are challenging because of a lack of good early clinical end points, and most rely on changes in existing imprecise biomarkers to assess the value of new biomarkers. There are well-characterized changes in kidney structure, however, that are highly correlated with kidney function, always precede the clinical findings of DKD and, at preclinical stages, predict DKD progression. These structural parameters may thus serve as clinically useful end points for identifying new biomarkers of early DKD. In addition, investigators are analyzing tissue transcriptomic data to identify pathways involved in early DKD which may have associated candidate biomarkers measurable in blood or urine, and differentially expressed microRNAs and epigenetic modifications in kidney tissue are beginning to yield important observations which may be useful in identifying new clinically useful biomarkers. This review examines the emerging literature on the use of kidney tissue in biomarker discovery in DKD.
Keywords: Biomarkers; Diabetic kidney disease; Imaging; Kidney biopsy; Morphometry.
Published by Elsevier Inc.
Figures
Similar articles
-
Novel biomarkers for prognosticating diabetic kidney disease progression.Int Urol Nephrol. 2023 Apr;55(4):913-928. doi: 10.1007/s11255-022-03354-7. Epub 2022 Oct 22. Int Urol Nephrol. 2023. PMID: 36271990 Free PMC article. Review.
-
Prognostic imaging biomarkers for diabetic kidney disease (iBEAt): study protocol.BMC Nephrol. 2020 Jun 29;21(1):242. doi: 10.1186/s12882-020-01901-x. BMC Nephrol. 2020. PMID: 32600374 Free PMC article.
-
Trajectories of kidney function in diabetes: a clinicopathological update.Nat Rev Nephrol. 2021 Nov;17(11):740-750. doi: 10.1038/s41581-021-00462-y. Epub 2021 Aug 6. Nat Rev Nephrol. 2021. PMID: 34363037 Review.
-
Serum hemoglobin concentration and risk of renal function decline in early stages of diabetic kidney disease: a nationwide, biopsy-based cohort study.Nephrol Dial Transplant. 2022 Feb 25;37(3):489-497. doi: 10.1093/ndt/gfab185. Nephrol Dial Transplant. 2022. PMID: 34028524
-
Novel biomarkers of diabetic kidney disease: current status and potential clinical application.Acta Diabetol. 2021 Jul;58(7):819-830. doi: 10.1007/s00592-020-01656-9. Epub 2021 Feb 2. Acta Diabetol. 2021. PMID: 33528734 Review.
Cited by
-
Associations of Plasma Glucagon Levels with Estimated Glomerular Filtration Rate, Albuminuria and Diabetic Kidney Disease in Patients with Type 2 Diabetes Mellitus.Diabetes Metab J. 2021 Nov;45(6):868-879. doi: 10.4093/dmj.2020.0149. Epub 2021 Mar 23. Diabetes Metab J. 2021. PMID: 33752319 Free PMC article.
-
Serum albumin and albuminuria predict the progression of chronic kidney disease in patients with newly diagnosed type 2 diabetes: a retrospective study.PeerJ. 2021 Jul 6;9:e11735. doi: 10.7717/peerj.11735. eCollection 2021. PeerJ. 2021. PMID: 34268015 Free PMC article.
-
Urinary small extracellular vesicles derived CCL21 mRNA as biomarker linked with pathogenesis for diabetic nephropathy.J Transl Med. 2021 Aug 17;19(1):355. doi: 10.1186/s12967-021-03030-x. J Transl Med. 2021. PMID: 34404433 Free PMC article.
-
Urinary Extracellular Vesicles in Chronic Kidney Disease: From Bench to Bedside?Diagnostics (Basel). 2023 Jan 26;13(3):443. doi: 10.3390/diagnostics13030443. Diagnostics (Basel). 2023. PMID: 36766548 Free PMC article. Review.
-
Predictive Effects of FT3/FT4 on Diabetic Kidney Disease: An Exploratory Study on Hospitalized Euthyroid Patients with T2DM in China.Biomedicines. 2023 Aug 7;11(8):2211. doi: 10.3390/biomedicines11082211. Biomedicines. 2023. PMID: 37626708 Free PMC article.
References
-
- National Kidney Foundation. KDOQI clinical practice guidelines for diabetes and CKD: 2012 update. Am J Kidney Dis. 2012;60:850–886. - PubMed
-
- Steinke JM, Sinaiko AR, Kramer MS, Suissa S, Chavers BM, Mauer M. The early natural history of nephropathy in Type 1 Diabetes: III. Predictors of 5-year urinary albumin excretion rate patterns in initially normoalbuminuric patients. Diabetes. 2005;54(7):2164–2171. - PubMed
-
- Perrin NE, Torbjornsdotter T, Jaremko GA, Berg UB. Risk markers of future microalbuminuria and hypertension based on clinical and morphological parameters in young type 1 diabetes patients. Pediatr Diabetes. 2010;11(5):305–313. - PubMed
-
- Bader R, Bader H, Grund KE, Mackensen-Haen S, Christ H, Bohle A. Structure and function of the kidney in diabetic glomerulosclerosis. Correlations between morphological and functional parameters. Pathol Res Pract. 1980;167(2–4):204–216. - PubMed
Publication types
MeSH terms
Substances
Grants and funding
LinkOut - more resources
Full Text Sources
Other Literature Sources
Medical
