. 2018;14(1):38-52.
doi: 10.1080/15548627.2017.1389822. Epub 2018 Feb 20.

A negative feedback regulation of MTORC1 activity by the lysosomal Ca2+ channel MCOLN1 (mucolipin 1) using a CALM (calmodulin)-dependent mechanism

Affiliations

A negative feedback regulation of MTORC1 activity by the lysosomal Ca2+ channel MCOLN1 (mucolipin 1) using a CALM (calmodulin)-dependent mechanism

Xue Sun et al. Autophagy. 2018.

Abstract

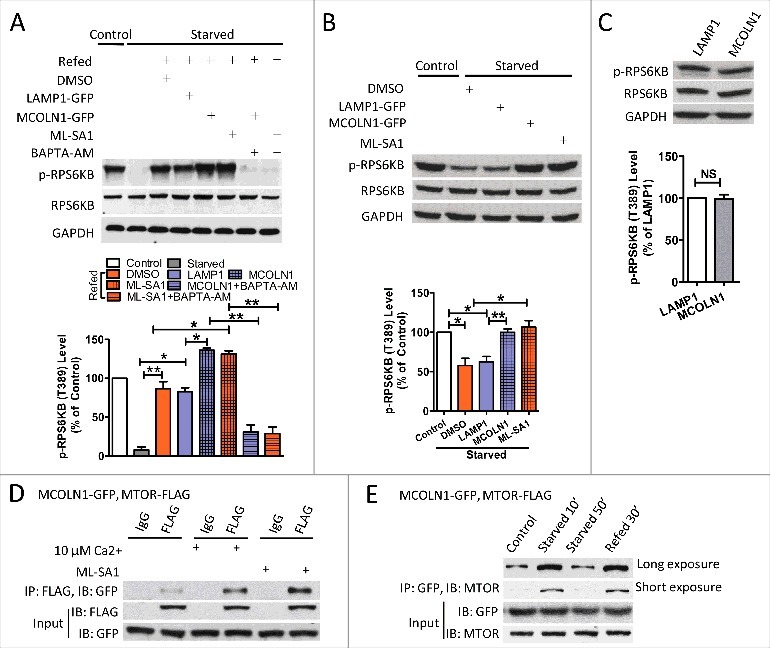
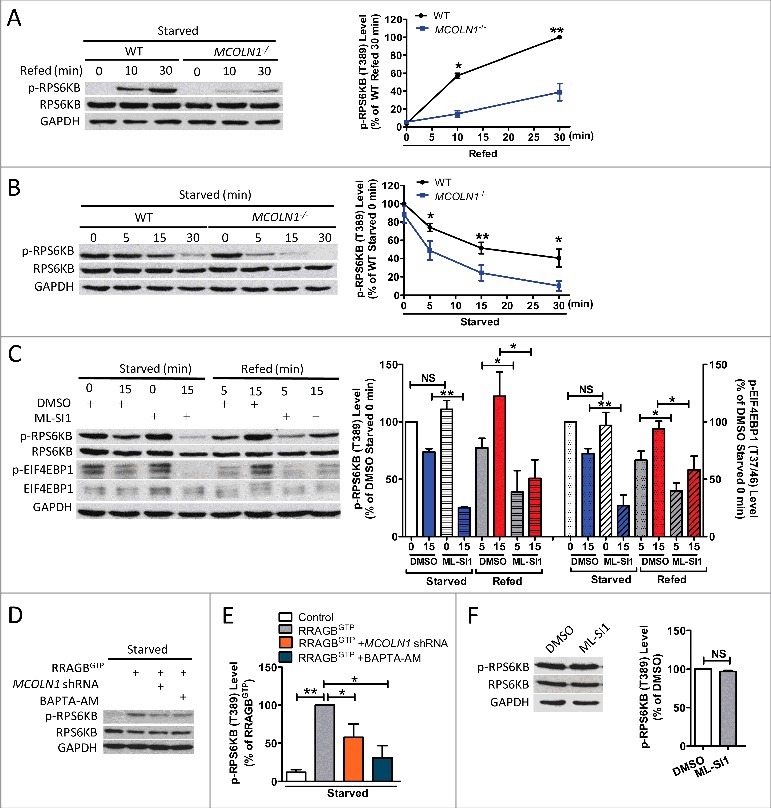
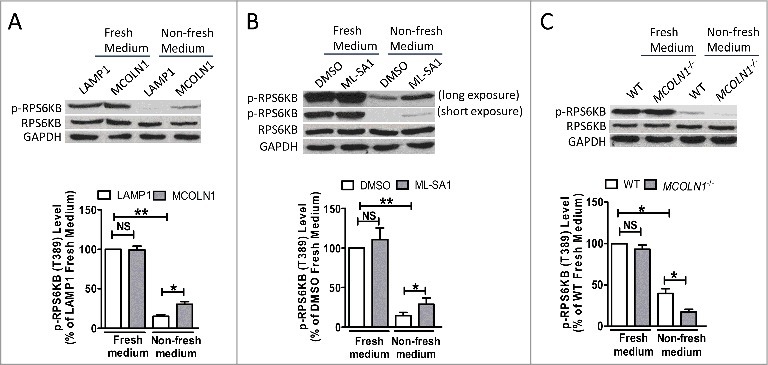
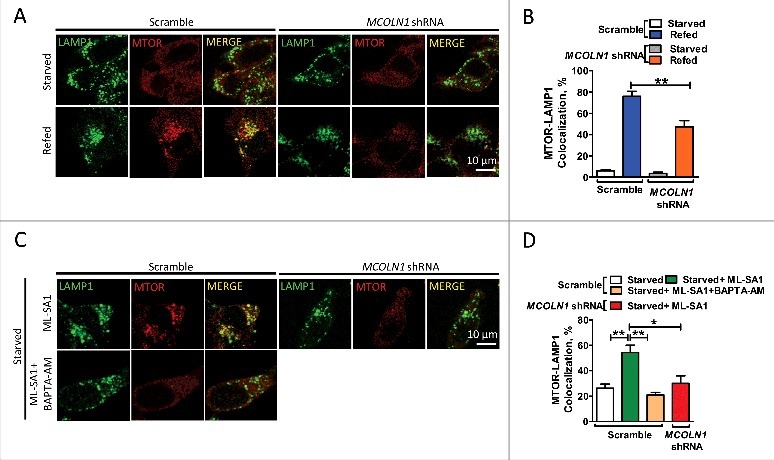
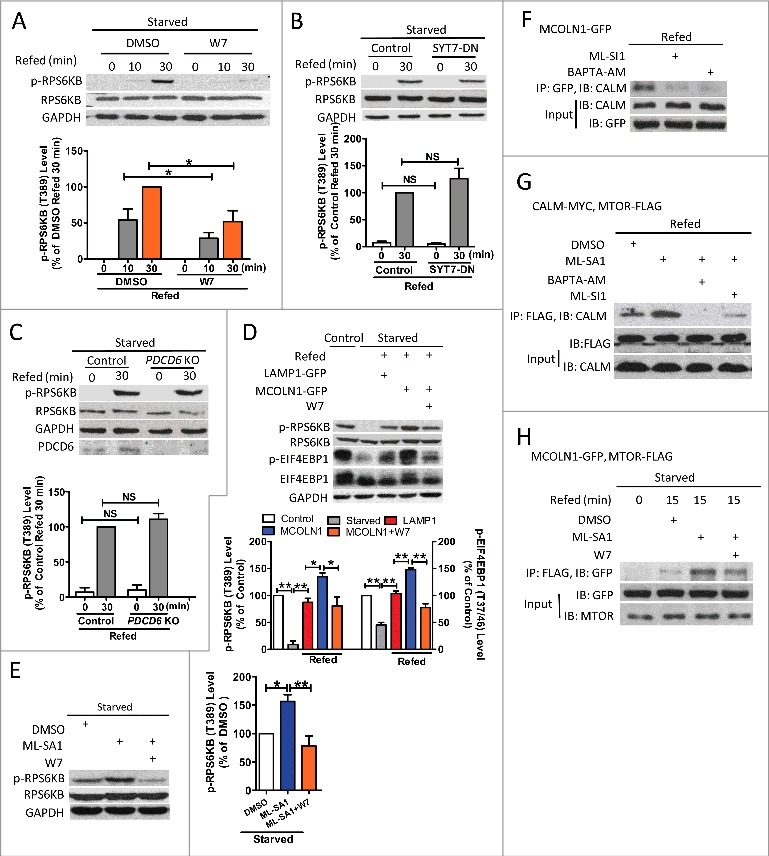
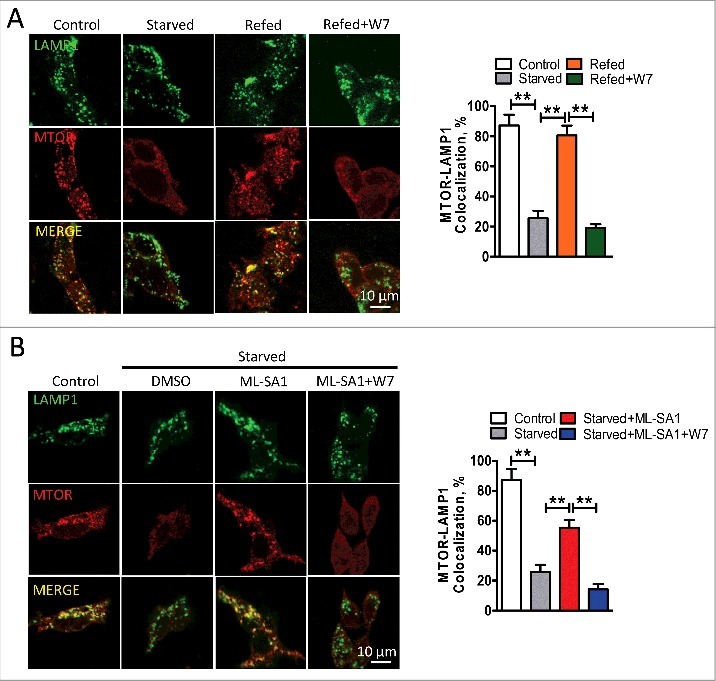
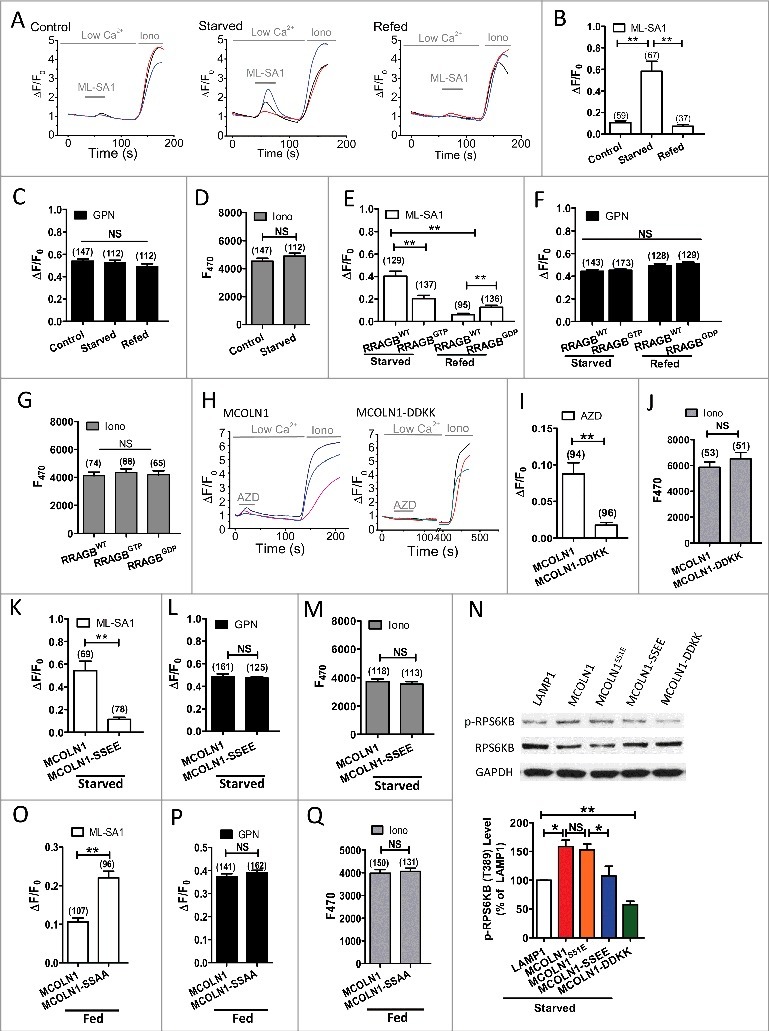
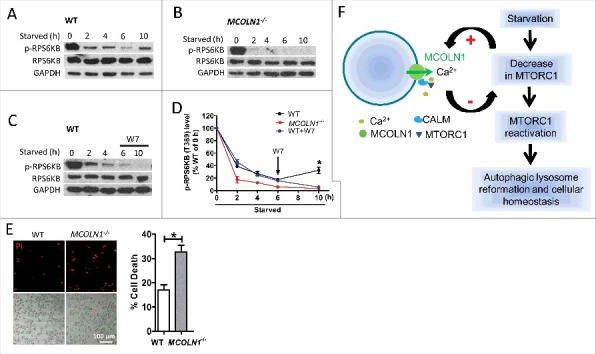
Macroautophagy/autophagy is an evolutionarily conserved pathway that is required for cellular homeostasis, growth and survival. The lysosome plays an essential role in autophagy regulation. For example, the activity of MTORC1, a master regulator of autophagy, is regulated by nutrients within the lysosome. Starvation inhibits MTORC1 causing autophagy induction. Given that MTORC1 is critical for protein synthesis and cellular homeostasis, a feedback regulatory mechanism must exist to restore MTORC1 during starvation. However, the molecular mechanism underlying this feedback regulation is unclear. In this study, we report that starvation activates the lysosomal Ca2+ release channel MCOLN1 (mucolipin 1) by relieving MTORC1's inhibition of the channel. Activated MCOLN1 in turn facilitates MTORC1 activity that requires CALM (calmodulin). Moreover, both MCOLN1 and CALM are necessary for MTORC1 reactivation during prolonged starvation. Our data suggest that lysosomal Ca2+ signaling is an essential component of the canonical MTORC1-dependent autophagy pathway and MCOLN1 provides a negative feedback regulation of MTORC1 to prevent excessive loss of MTORC1 function during starvation. The feedback regulation may be important for maintaining cellular homeostasis during starvation, as well as many other stressful or disease conditions.

Keywords: MCOLN1/mucolipin-1; MTORC1; autophagy; lysosome; lysosome Ca2+.


Figures

Figure 1.
Figure 1.
MCOLN1 promotes MTORC1 activation. (A) Upregulation of MCOLN1 promotes MTORC1 reactivation during refeeding, and this was inhibited by BAPTA-AM. HEK293T cells transfected with or without LAMP1-GFP, or MCOLN1-GFP were kept in normal culture medium, starved for 50 min or followed by nutrient refeeding for 15 min ± ML-SA1 (15 µM) and/or BAPTA-AM (10 µM) as indicated. Cell extracts were analyzed by western blotting using anti-p-RPS6KB (T389) and anti-RPS6KB antibodies, and anti-GAPDH antibody was used as a loading control. Histograms represent the mean percentage of the ratio of p-RPS6KB:RPS6KB (mean ± SEM, n = 3 independent experiments) in the indicated conditions, relative to that of the control. (B) Upregulation of MCOLN1 prohibited the loss of MTORC1 activity upon starvation. HEK293T cells transfected with or without LAMP1-GFP, or MCOLN1-GFP were starved for 30 min ± ML-SA1 (15 µM). Histograms represent the mean percentage of the ratio of p-RPS6KB:RPS6KB (mean ± SEM, n = 3 independent experiments) in the indicated conditions, relative to that of the control. (C) MCOLN1 overexpression did not alter MTORC1 activity under normal conditions. HEK293T cells were transfected with either LAMP1-GFP or MCOLN1-GFP. MTORC1 activity was examined after the cells were cultured for 2–4 h in fresh culture medium. Histograms represent the mean percentage of the ratio of p-RPS6KB:RPS6KB (mean ± SEM, n = 3 independent experiments) in the indicated conditions, relative to that of LAMP1-expressing cells. (D) Co-IP of MCOLN1 and MTORC1. HeLa cells expressing MCOLN1-GFP and MTOR-FLAG were kept in normal culture medium. Cell extracts were subject to FLAG or IgG immunoprecipitation ± ML-SA1 (15 µM) or 10 µM Ca2+ and analyzed by western blotting for the indicated proteins. Note that culture medium was not changed before the co-IP experiments. (E) The association of MCOLN1 and MTORC1 is regulated by starvation. Short-term (10 min) starvation increased the association between MCOLN1 and MTORC1, and this was suppressed by long-term (50 min) starvation. Nutrient refeeding also increases the association between MCOLN1 and MTORC1. HEK293T cells expressing MCOLN1-GFP and MTOR-FLAG were kept in fresh culture medium, starved for 10 min and 50 min, or starved for 50 min followed by 30 min refeeding. NS, not significant; *, P < 0.05; **, P < 0.01.
Figure 2.
Figure 2.
MCOLN1 is required for MTORC1 activation. (A) MCOLN1 ablation compromised MTORC1 reactivation during nutrient refeeding. WT and MCOLN1/ human skin fibroblasts were starved for 50 min or followed by nutrient refeeding for 10 or 30 min as indicated. Cell extracts were analyzed by western blotting for the indicated proteins. The graph illustrates the mean percentage of the ratio of p-RPS6KB:RPS6KB (mean ± SEM, n = 3 independent experiments), relative to that in WT cells with 30 min refeeding. (B) MCOLN1/ cells lose MTORC1 activity more easily compared with WT cells when starved. WT and MCOLN1/ cells were kept in normal culture medium or starved for 5, 15 or 30 min. Cell extracts were analyzed by western blotting for the indicated proteins. The graph shows the mean percentage of the ratio of p-RPS6KB:RPS6KB (mean ± SEM, n = 3 independent experiments), relative to that in fed WT cells. (C) Inhibition of MCOLN1 suppressed MTORC1 activity upon starvation and nutrient refeeding. HEK293T cells were kept in normal culture medium, starved for 15 min, or starved for 50 min followed by nutrient refeeding for 5 or 15 min ± ML-SI1 (50 µM) as indicated. MTORC1 activity was assessed by measuring p-RPS6KB (T389) and p-EIF4EBP1 (T37/46) using western blot. The graph shows the mean percentage of the ratio of p-RPS6KB:RPS6KB (left) and p-EIF4EBP1:EIF4EBP1 (right) (mean ± SEM, n = 3 independent experiments), relative to that in nontreated fed cells. (D, E) High MTORC1 activity in cells expressing constitutively active RRAGB, which partially mimics nutrient-replete conditions was suppressed by MCOLN1 deletion and BAPTA-AM. HEK293T cells were transfected with RRAGBGTP or together with scramble or MCOLN1 shRNA; 24 h later cells were starved with amino acid-free DMEM for 30 min in the presence or absence of 10 μM BAPTA-AM. (F) MCOLN1 inhibition did not alter MTORC1 activity under normal conditions. HEK293T cells were treated with DMSO or ML-SI1 (50 μM) for 1 h in normal medium. The graph illustrates the mean percentage of the ratio of p-RPS6KB:RPS6KB (mean ± SEM, n = 3 independent experiments), relative to that in DMSO-treated cells. NS, not significant; *, P < 0.05; **, P < 0.01.
Figure 3.
Figure 3.
MTORC1 activity is regulated by culture medium conditions. (A) HEK293T cells were transfected with LAMP1-GFP or MCOLN1-GFP for 24 h, and then the culture medium was either changed to fresh complete medium for 2 h (fresh medium) or kept unchanged (nonfresh medium) before measuring MTORC1. MCOLN1 overexpression increased MTORC1 activity in cells incubated in nonfresh medium but not in fresh medium. Histograms represent the mean percentage of the ratio of p-RPS6KB:RPS6KB (mean ± SEM, n = 3 independent experiments) in the indicated conditions, relative to that of fed cells expressing LAMP1. (B) Cells were cultured for 24 h, and then treated with ML-SA1 (10 μM) for 3 h in fresh or nonfresh medium. Histograms represent the mean percentage of the ratio of p-RPS6KB:RPS6KB (mean ± SEM, n = 3 independent experiments) in the indicated conditions, relative to that of fed cells treated with DMSO. (C) WT and MCOLN1/ human skin fibroblasts were cultured for 24 h, and then incubated in fresh or nonfresh medium for 2 h. Histograms represent the mean percentage of the ratio of p-RPS6KB:RPS6KB (mean ± SEM, n = 3 independent experiments) in the indicated conditions, relative to that of WT fed cells. NS, not significant; *, P < 0.05; **, P < 0.01.
Figure 4.
Figure 4.
MCOLN1 regulates MTOR lysosome recruitment. (A) In the MCOLN1 knockdown HEK293T cell line that was generated with lentivirus carrying shRNA against MCOLN1, a decrease in MCOLN1 suppressed MTOR recruitment onto lysosomes. Scramble and MCOLN1 shRNA knockdown HEK293T cells were starved for 1 h followed by nutrient refeeding for 10 min. Cells were then fixed and immunostained with antibodies against LAMP1 and MTOR. (B) The percentage of colocalization between LAMP1 and MTOR as in (A). (C) Upregulation of MCOLN1 by ML-SA1 prohibited MTOR dissociation from lysosomes in control but not MCOLN1-deficient cells. This was blocked by BAPTA-AM. Scramble and MCOLN1 shRNA knockdown HEK293T cells were starved for 50 min in the presence of ML-SA1 (15 µM) ± BAPTA-AM (10 µM) as indicated. (D) The percentage of colocalization between LAMP1 and MTOR as in (C). More than 20 cells were analyzed for each condition in 3 independent experiments. NS, not significant; **, P < 0.01.
Figure 5.
Figure 5.
MCOLN1 activates MTORC1 through CALM. (A) W7 prevented MTORC1 reactivation during refeeding. HEK293T cells were starved for 50 min or followed by nutrient refeeding for 10 or 30 min ± W7 (3 µM) as indicated. Cell extracts were analyzed by western blotting using anti-p-RPS6KB (T389) and anti-RPS6KB antibodies, and anti-GAPDH antibody was used as a loading control. Histograms represent the mean percentage of the ratio of p-RPS6KB:RPS6KB (mean ± SEM, n = 3 independent experiments) in the indicated conditions, relative to that of cells with 30 min refeeding. (B) SYT7-DN had no effect on MTORC1 reactivation during refeeding. HEK293T cells transfected with or without a dominant negative form of SYT7 (SYT-DN) were starved for 50 min or followed by nutrient refeeding for 30 min. Histograms represent the mean percentage of the ratio of p-RPS6KB:RPS6KB (mean ± SEM, n = 3 independent experiments) in the indicated conditions, relative to that of cells with 30 min refeeding. (C) PDCD6 knockout did not influence MTORC1 reactivation during refeeding. Control HEK293T cells or cells with PDCD6 knockout were starved for 50 min or followed by nutrient refeeding for 30 min. Histograms represent the mean percentage of the ratio of p-RPS6KB/RPS6KB (mean ± SEM, n = 3 independent experiments) in the indicated conditions, relative to that of cells with 30 min refeeding. (D) The increased MTORC1 activity induced by MCOLN1 overexpression was inhibited by W7. HEK293T cells transfected with or without MCOLN1-GFP were kept in normal culture medium, starved for 50 min or followed by nutrient refeeding for 30 min ± W7 (3 µM) as indicated. MTORC1 activity was assessed by measuring RPS6KB (T389) and p-EIF4EBP1 (T37/46) using western blot. Histograms represent the mean percentage of the ratio of p-RPS6KB:RPS6KB (left) and p-EIF4EBP1:EIF4EBP1 (right) (mean ± SEM, n = 3 independent experiments) in the indicated conditions, relative to the control. (E) W7 inhibited the ML-SA1-induced increase of MTORC1 activity during starvation. HEK293T cells were starved for 15 min ± ML-SA1 (15 µM) with or without W7 (3 µM) as indicated, and then lysed and subjected to immunoblotting. Histograms represent the mean percentage of the ratio of p-RPS6KB:RPS6KB (mean ± SEM, n = 3 independent experiments) in the indicated conditions, relative to that of cells without treatment. (F) Co-IP of MCOLN1 and CALM. The interaction between MCOLN1 and CALM was inhibited by ML-SI1 or BAPTA-AM. HEK293T cells expressing MCOLN1-GFP were starved for 50 min followed by nutrient refeeding for 30 min ± ML-SI1 (50 µM) or BAPTA-AM (10 µM) as indicated. Cell extracts were subject to GFP immunoprecipitation and analyzed by western blotting for the indicated proteins. (G) Co-IP of CALM and MTORC1. The interaction between CALM and MTORC1 during refeeding was enhanced by activating MCOLN1 with ML-SA1, and this was eliminated by BAPTA-AM or ML-SI1. HEK293T cells expressing CALM-MYC-HIS and MTOR-FLAG were starved for 50 min followed by nutrient refeeding for 15 min ± ML-SA1 (15 µM), BAPTA-AM (10 µM) or ML-SI1 (50 µM) as indicated. Cell extracts were subject to FLAG immunoprecipitation and analyzed by western blotting for the indicated proteins. (H) Co-IP of MCOLN1 and MTORC1. During nutrient refeeding, the ML-SA1-induced increase in the interaction between MCOLN1 and MTORC1 was inhibited by W7. HEK293T cells expressing MCOLN1-GFP and MTOR-FLAG were starved for 50 min, or followed by nutrient refeeding for 15 min ± ML-SA1 (15 µM) with or without W7 (3 µM) as indicated. Cell extracts were subject to FLAG immunoprecipitation and analyzed by western blotting for the indicated proteins. NS, not significant; *, P < 0.05; **, P < 0.01.
Figure 6.
Figure 6.
MCOLN1 regulates MTOR recruitment onto lysosomes through CALM. (A) Inhibiting CALM by W7 prohibited MTOR recruitment induced by nutrient refeeding. HEK293T cells were starved for 50 min, followed by nutrient refeeding for 10 or 15 min ± W7 (3 µM) as indicated. The data was expressed as a percentage of colocalization between LAMP1 and MTOR. (B) W7 eliminated the effect of ML-SA1 on preventing MTOR dissociation from lysosomes. HEK293T cells were kept in normal culture medium, or starved for 50 min ± W7 (3 µM) and/or ML-SA1 (15 µM) as indicated. The data are expressed as a percentage of colocalization between LAMP1 and MTOR. More than 20 cells were analyzed for each condition in 3 independent experiments. **, P < 0.01.
Figure 7.
Figure 7.
MTORC1-dependent regulation of MCOLN1-mediated lysosomal Ca2+ release. (A) Starvation increased MCOLN1 activity as indicated by elevated GECO-MCOLN1 responses to ML-SA1 in HEK293T cells expressing GECO-MCOLN1. Cells were kept in normal culture medium, starved for 50 min or followed by nutrient refeeding for 15 min prior to the measurement. (B) Summary of ML-SA1-induced GECO-MCOLN1 responses as in (A). (C, D) Starvation or refeeding did not affect GECO-MCOLN1 response to GPN (200 µM) (C) or ionomycin (Iono, 2 µM) (D). (E) RRAGBGTP decreased GECO-MCOLN1 responses in starved cells, whereas RRAGBGDP increased GECO-MCOLN1 responses in refeeding cells. HEK293T cells expressing GECO-MCOLN1 and RRAGBWT together with RRAGBGTP or RRAGBGDPwere subjected to starvation, or nutrient refeeding (DMEM + 10% FBS, 15 min). (F, G) GECO-MCOLN1 response to GPN (200 µM) (F) and Ionomycin (2 µM) (G) was comparable to conditions in (E). (H-J) Inhibition of MTOR with AZD8055 (1 µM) induced GECO responses in HEK293T cells expressing GECO-MCOLN1 but not GECO-MCOLN1-DDKK, a nonconducting mutant of MCOLN1. GECO signals were measured in the absence of external Ca2+. GECO responses to ionomycin (2 µM, with 2 mM Ca2+ in the bath) was used to compare the expression levels of GECO-MCOLN1 and GECO-MCOLN1-DDKK. (K) S571,576E phosphomimetic mutation of GECO-MCOLN1 (GECO-MCOLN1-SSEE) decreased ML-SA1-induced GECO responses upon starvation compared to GECO-MCOLN1. HEK293T cells expressing GECO-MCOLN1 and GECO-MCOLN1-SSEE, respectively, were subjected to starvation (50 min) prior to the measurement. (L, M) GECO-MCOLN1 response to GPN (200 µM) (I) or ionomycin (2 µM) (M) was comparable in conditions as in (H). (N) WT MCOLN1 but not MCOLN1-SSEE and MCOLN1-DDKK increased MTORC1 activity. HEK293T cells expressing LAMP1-GFP, MCOLN1-EGFP, MCOLN1S51E-EGFP, MCOLN1-SSEE-EGFP and MCOLN1-DDKK-GFP, respectively, were starved for 30 min. MCOLN1-DDKK-GFP (MCOLN1D471,472K-GFP) is a MCOLN1 nonconducting pore. MCOLN1S51E-EGFP is a control phosphomimetic mutant that is not related to MTORC1 phosphorylation. Cell extracts were analyzed by western blotting using anti-p-RPS6KB (T389) and anti-RPS6KB antibodies, and anti-GAPDH antibody was used as a loading control. Histograms represent the mean percentage of the ratio of p-RPS6KB:RPS6KB (mean ± SEM, n = 3 independent experiments) in the indicated conditions, relative to that of cells expressing LAMP1. (O-Q) Summary of ML-SA1-induced GECO responses in HEK293T cells expressing GECO-MCOLN1 and GECO-MCOLN1-SSAA under normal fed conditions. MCOLN1-SSAA displayed a higher activity in normal fed conditions compared to MCOLN1. However, MCOLN1-SSAA did not have an effect on lysosomal Ca2+ content. These findings suggest that the lysosome must have a mechanism to maintain its Ca2+ homeostasis. In this case, although MCOLN1-SSAA increases Ca2+ release, a compensational mechanism exists to increase Ca2+ uptake that depends on the endoplasmic reticulum Ca2+ release. NS, not significant; *, P < 0.05; **, P < 0.01.
Figure 8.
Figure 8.
MCOLN1 is required for MTORC1 reactivation during prolonged starvation. (A) MTORC1 reactivation by prolonged starvation. WT human fibroblasts were starved in DMEM medium in the absence of FBS for 2, 4, 6, and 10 h. Cell extracts were analyzed by western blotting using anti-p-RPS6KB (T389) and anti-RPS6KB antibodies, and anti-GAPDH antibody was used as a loading control. (B) Loss of MTORC1 reactivation in MCOLN1/ human fibroblasts. (C) W7 inhibited MTORC1 reactivation in human fibroblasts. W7 (3 µM) was added in the DMEM medium during the 6 to 10 h of starvation. (D) Quantification of MTORC1 activity by assessing p-RPS6KB using western blot. Histograms represent the mean percentage of the ratio of p-RPS6KB:RPS6KB (mean ± SEM, n = 3 independent experiments) in the indicated conditions, relative to that of fed WT cells. (E) HBSS starvation for 48 h significantly decreased cell viability in MCOLN1/ human skin fibroblasts compared to WT fibroblasts. Cell death was revealed by propidium iodide (PI) staining (mean ± SEM, n = 3 independent experiments). (F) Illustration of a feedback regulation between MTORC1 and MCOLN1 during starvation. Starvation caused a decrease in MTORC1 activity, leading to an increase in MCOLN1-mediated Ca2+ release. Ca2+ binds to CALM, promoting lysosomal MTORC1 recruitment and reactivation. This feedback regulatory mechanism is essential for autophagic lysosome reformation and cellular homeostasis during starvation. *: P < 0.05.

Similar articles

Cited by

References

    1. Levine B, Kroemer G. Autophagy in the pathogenesis of disease. Cell. 2008;132:27–42. doi:10.1016/j.cell.2007.12.018. PMID:18191218. - DOI - PMC - PubMed
    1. Komatsu M, Waguri S, Chiba T, Murata S, Iwata J, Tanida I, Ueno T, Koike M, Uchiyama Y, Kominami E, Tanaka K. Loss of autophagy in the central nervous system causes neurodegeneration in mice. Nature. 2006;441:880–884. doi:10.1038/nature04723. PMID:16625205. - DOI - PubMed
    1. Fulda S, Kogel D. Cell death by autophagy: Emerging molecular mechanisms and implications for cancer therapy. Oncogene. 2015;34(40):5105–13. doi:10.1038/onc.2014.458. - DOI - PubMed
    1. Levine B, Mizushima N, Virgin HW. Autophagy in immunity and inflammation. Nature. 2011;469:323–35. doi:10.1038/nature09782. PMID:21248839. - DOI - PMC - PubMed
    1. Mizushima N, Levine B. Autophagy in mammalian development and differentiation. Nat Cell Biol. 2010, 12:823–30. doi:10.1038/ncb0910-823. PMID:20811354. - DOI - PMC - PubMed

Publication types

Substances

Grants and funding